


Abstract
Background A 2-Week Wait (2WW) referral pathway for earlier diagnosis of suspected cancer was introduced in England in 2000. Nevertheless, a significant proportion of patients with cancer are diagnosed by other routes (detection rate), only a small proportion of 2WW referrals have cancer (conversion rate) and there is considerable between-practice variation.
Aim This study examined use by practices of the 2WW referral in relation to all cancer diagnoses.
Design and setting A cross-sectional analysis of data extracted from the Cancer Waiting Times Database for all 2WW referrals in 2009 and for all patients receiving a first definitive treatment in the same year.
Method The age standardised referral ratio, conversion rate, and detection rate were calculated for all practices in England and the correlation coefficient for each pair of measures. The median detection rate was calculated for each decile of practices ranked by conversion rate and vice versa, performing nonparametric tests for trend in each case.
Results Data for 8049 practices, 865 494 referrals, and 224 984 cancers were analysed. There were significant correlations between referral ratio and conversion rate (inverse) and detection rate (direct). There was also a direct correlation between conversion and detection rates. There was a significant trend in conversion rate for deciles of detection rate, and vice versa, with a marked difference between the lowest and higher deciles.
Conclusion There is a consistent relationship between 2WW referral conversion rate and detection rate that can be interpreted as representing quality of clinical practice. The 2WW referral rate should not be a measure of quality of clinical care.
INTRODUCTION
Achieving earlier diagnosis of cancer has been a part of the strategy for improving cancer outcomes in England since 2000, when an urgent GP referral pathway for suspected cancer, requiring that patients should wait no more than 2 weeks to be seen (here termed a 2-Week Wait (2WW) referral) was introduced.1 The Cancer Reform Strategy2 identified early diagnosis as being critical to improved survival, a priority recently reiterated in Improving Outcomes: a Strategy for Cancer.3 It led to the National Awareness and Early Diagnosis Initiative,4 a series of actions intended to understand and address the reasons for later diagnosis of cancer in England.
Implicit in the 2WW referral pathway in England is the intention that the majority of cancers should be diagnosed by this route, while efficient use of the pathway would be demonstrated by the precision of its use. As increasingly detailed data on 2WW referrals has become available at a national level, it is apparent that a significant proportion of cancers reach a diagnosis by other routes (in 2007 only 25% of cancers were diagnosed through the 2WW pathway),5 while the proportion of 2WW referrals found to have cancer has fallen from 13% in 2006–2007 to 11% in 2009–2010.6 The criteria for 2WW referral have long been considered to be too narrowly defined7 and there is wide variation in compliance with the guidelines for its use.8 Nevertheless, efficient referral practice, underpinned by NICE advice,9 is now a key part of the Quality, Innovation, Productivity and Prevention (QIPP) agenda for the NHS.10 Furthermore, fast-track referral for suspected cancer is being viewed as a valuable diagnostic option elsewhere in Europe as countries seek to improve their cancer survival statistics.11,12
More recently, the amount of variation in use of the 2WW pathway between practices and primary care trusts has been a cause for concern for the National Audit Office6 and the Public Accounts Committee,13 both of which have recommended that this should be investigated and addressed by commissioners. Every practice in England can now access its cancer profile, a set of 24 measures relating to cancer screening and diagnosis, produced by the National Cancer Intelligence Network in December 2010, which includes data on 2WW referrals and is intended to support quality improvement in this area.14 The interpretation of these profiles, however, has been hampered by uncertainty among GPs and Cancer Networks as to what represents best practice.
This study examined use by practices of the 2WW referral pathway and related this to all cancer diagnoses on the Cancer Waiting Times Database (CWT-Db) to identify patterns of use that might represent good practice.
Method
Data, including patient’s NHS number, were extracted from the national CWT-Db for all 2WW referrals with a date first seen in 2009 and for all patients receiving a first definitive treatment for cancer (including, as well as conventional treatments, active monitoring and declined treatment) with a treatment start date in 2009.
How this fits in
There is considerable variation in GPs’ use of the 2-week referral pathway for suspected cancer, in the proportion of those referrals that prove to have cancer (conversion rate) and in the proportion of all cancer diagnosed by this pathway (detection rate). This study shows a relationship between the latter two measures that represents quality of clinical practice and has potential as a quality indicator.
The patient’s registered GP practice (as at mid-2010) and demographic information (including date of birth and postcode) were obtained by tracing patients (using the NHS Open Exeter Batch Tracing Service) according to their NHS number.
The age-standardised referral ratio, conversion rate, and detection rate were calculated for all practices in England, excluding those with a list size <1000 and those where different data sources indicated a considerable change in list size, suggesting practice mergers or closures.
The measures were calculated in accordance with the methodology used for producing practice cancer profiles15 and are defined as follows:
Referral ratio — the indirectly standardised number of 2WW referrals relative to the GP list size.
Conversion rate — the proportion of 2WW referrals which result in a cancer diagnosis (positive predictive value [PPV]).
Detection rate — the proportion of cancers treated which were 2WW referrals (sensitivity).
Scatter plots were constructed and correlation coefficients were calculated for each of the three pairs of the three measures. As the rates are not normally distributed and the relationships are non-linear, Spearman’s rank correlation was used, which is based on the relative orders of the rates. The relationships between variables was also investigated for different patient and practice subgroups, based on patient’s age (<65 and ≥65 years), practice socioeconomic deprivation (IMD quintiles),16 practice list size, strategic health authority (SHA) and 2WW referral rates. The median detection rate was calculated also for each decile of practices ranked by conversion rate and the median conversion rate for each decile of practices ranked by detection rate. A nonparametric test for trend17 in detection rate was performed by deciles of conversion rate and vice versa. The analyses were performed using Stata (version 12).
RESULTS
Data on 865 494 2WW referrals and 224 984 cancers from 8049 of the 8229 practices in the 2008–2009 Quality and Outcomes Framework database were analysed.18 Table 1 shows the calculated referral, conversion and detection rates, overall and by patient and practice subgroups.
Referral, conversion, and detection rates, by various factors
Of all 2WW referrals, 11% (n = 96 561) resulted in a cancer diagnosis (conversion rate). Diagnoses resulting from 2WW referrals accounted for 43% of all first treatments for cancer recorded on the CWT database (detection rate).
After adjusting for age and sex, there was significant variation in standardised referral ratios, particularly by practice list size and SHA, but there was no significant deprivation gradient. Significantly lower conversion rates were found in the most deprived areas, for those aged <65 years and those practices with higher referral ratios. Lower detection rates were found in the most deprived areas, for those aged <65 years, those practices with low referral ratios and those practices with smaller list sizes.
Correlations between the three measures
An inverse relationship between standardised referral ratio and conversion rate was found; that is, those with higher 2WW referral ratios generally have lower conversion rates (correlation coefficient –0.35, P<0.001) (Figure 1).

Correlation between age-sex standardised referral ratio and conversion rate.
A direct relationship between standardised referral ratio and detection rate was found; that is, those practices with higher referral ratios generally have higher detection rates (correlation coefficient 0.42, P<0.001) (Figure 2).
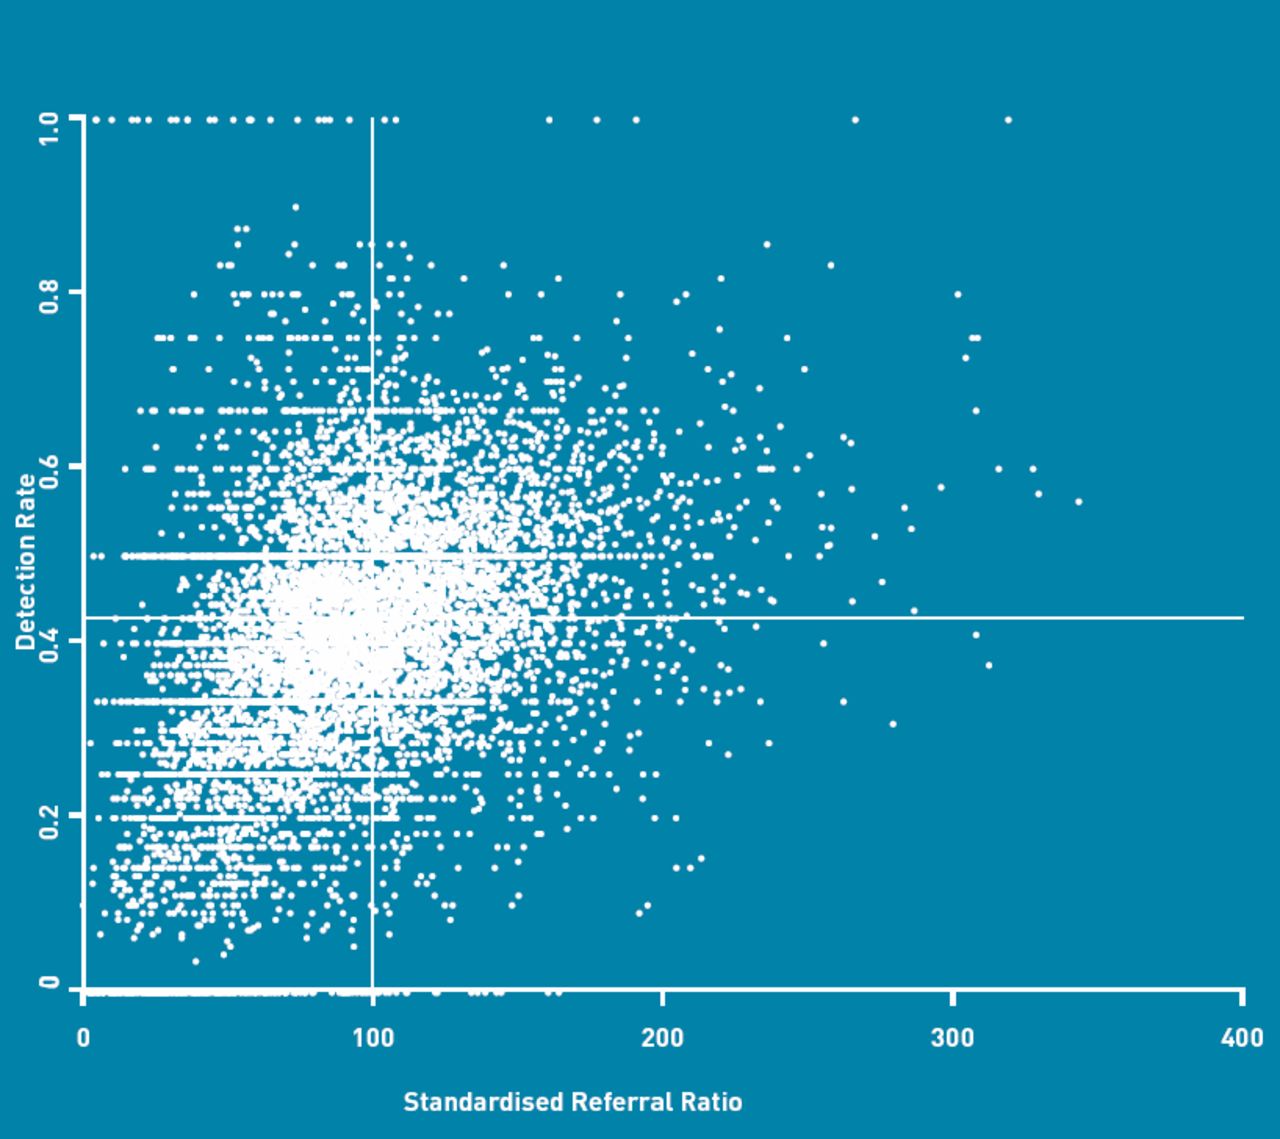
Correlation between age-sex standardised referral ratio and detection rate.
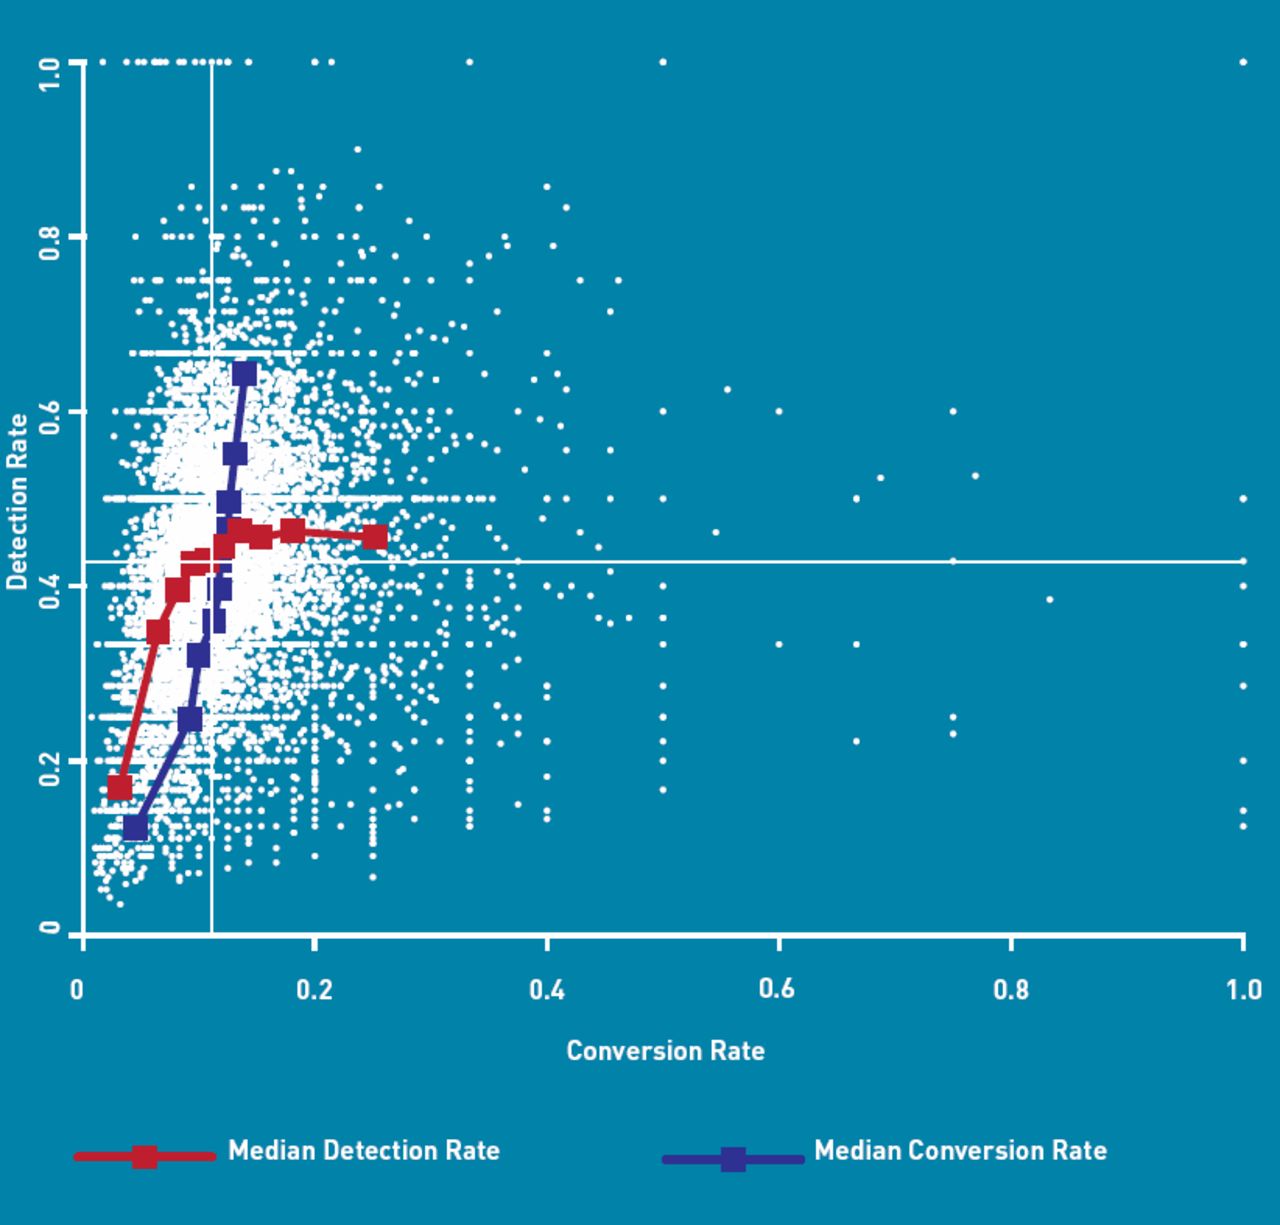
Finally, a direct relationship between conversion and detection rates was found also; that is, those practices with higher conversion rates generally have higher detection rates and vice versa (correlation coefficient 0.37, P<0.001) (Figure 3).

Correlation between conversion rate and detection rate (with lines plotting the median detection rate within deciles of conversion rate and the median conversion rate within deciles of detection rate).
The correlations, between the standardised 2WW referral ratio and conversion rate, standardised 2WW referral ratio and detection rate, and conversion and detection rates remained significant when calculated for all patient and practice subgroups. (Table 2).
Correlations between referral, conversion and detection rates, by various factors
There was a statistically significant (P<0.001) trend in detection rate, for deciles of practices based on conversion rate; the median detection rate increased from 17% for practices in the lowest decile of conversion rate to 45–46% for practices in the highest four deciles of conversion rate. There was also a statistically significant (P<0.001) trend in conversion rate, for deciles of detection rate; the median conversion rate increasing from 4% to 14%, for practices in the lowest to highest deciles of detection rate. In both cases, there was a marked difference between the lowest decile and all higher deciles. (Figure 3)
DISCUSSION
Summary
There was a significant correlation between 2WW referral conversion and detection rates such that practices with higher conversion rates also tended to have higher detection rates and vice versa.
Everything else being equal, practices with low 2WW referral ratios would expect a high proportion of their referrals to be diagnosed with the disease (high conversion rate) compared with high-referring practices. Practices with low 2WW referral ratios would also expect a higher proportion of their patients to be diagnosed with cancer via other routes, such as following routine referrals or emergency presentation (low detection rate). These expected relationships have been borne out in the results of this study. They also imply that practices with high conversion rates would expect to have low detection rates, and vice versa. However, this study’s results indicate that the opposite is true. Because the positive correlation observed between conversion rate and detection rate is significant across a wide range of patient and practice subgroups, it represents an intrinsic difference in diagnostic quality between practices; that is, a quality gradient.
As conversion rate increases, there is a ceiling effect in the increasing detection rate trend. Reasons for this include screen-detected cancers, patients not presenting to the GP with 2WW-qualifying alarm symptoms and diagnoses made as emergencies without prior presentation to the GP. However, as detection rate increases there is a continuing trend for increasing conversion rate, despite being skewed by the poor PPV of many cancer alarm symptoms, reflecting the accuracy with which the 2WW criteria are applied.
Strengths and limitations
On average a practice will have 27 new cancer diagnoses each year recorded in the CWT-Db. As a result, individual practice conversion rates and detection rates lack precision. However, this study’s finding of a relationship between detection and conversion rates is based on an analysis of data for almost all of the practices in England, more than 8000 in total, and for 865 000 referrals and 225 000 cancers. The observed correlation between these two measures is therefore very unlikely to have occurred by chance and is not subject to bias in the selection of practices. Furthermore, the relationship is evident across all of the patient and practice subgroups investigated.
Collection of the data used in this analysis is mandatory for all NHS provider trusts in England, meaning that these findings are nationally representative. It is also done according to agreed definitions and systematic data collection bias is therefore unlikely. However, as 2009 was the first year that cancer waiting times data were recorded according to a new system19 it is possible that the number of referrals may have been under-recorded in some hospitals, with some resulting inaccuracies in referral, conversion and detection rates for some practices.
Some patients diagnosed with cancer are not recorded in the CWT-Db; for example, those who die prior to treatment commencing or who receive treatment privately,20 or who are diagnosed outside the hospital setting. In 2009, the number of cases recorded on the CWT-Db was 15% less than the number of cases (excluding non melanoma skin cancer) registered by cancer registries,21 although there are some differences in the definitions used for these two data sources. In the current analysis, cases not recorded on the CWT-Db will not contribute to a practice’s conversion or detection rate. However, is not expected to have a significant impact on the study’s conclusions.
The number of cancers and number of referrals used to calculate the practice measures are based on slightly different cohorts of patients. Specifically, the number of 2WW referrals is taken as the number of cases first seen in the hospital receiving the referral in 2009, whereas the number of cancers is taken as the number of cases starting treatment in 2009. Although most patients first seen in 2009 will also have started treatment in that year, some patients starting treatment in 2009 will have been first seen in 2008 and some patients first seen in 2009 will not have started treatment until some time in 2010. This may have a small effect on the conversion and detection rates for some practices but the effect does not result in a systematic bias in any single direction.
Differential availability and use of direct access to diagnostic tests between practices and hospitals may have an effect on 2WW referral rates and resulting conversion and detection rates, particularly where use results in patients bypassing the 2WW pathway. For example, in some integrated respiratory medicine services, a patient suspected of having lung cancer following a GP referral for chest X-ray may be seen and diagnosed by a specialist without going through the 2WW pathway and will not contribute to that practice’s 2WW detection rate. Similarly, patients diagnosed following referral from a national screening programme will also not contribute to their practice’s detection rate.
Some cancers are more likely to be diagnosed as emergencies than others.5 The case mix of cancers in any one practice will therefore affect its referral, conversion and detection rates. However, in this study the correlations between measures remained consistent across all subgroups, and notably within all deprivation groups and geographical areas.
Comparison with existing literature
Referral rates from general practice have been extensively studied and a recent Scottish study has reported a sixfold variation between practices in referral rates for their equivalent of 2WW referral.22 A National Cancer Intelligence Network analysis of referral ratios for England has shown that 15% of practices made less than half the average number of 2WW referrals, while 10% made over 50% more than the average number of referrals.23 The 11% conversion rate reflects the low predictive value of cancer symptoms, even those regarded as alarm symptoms,24 while the 43% detection rate reflects the finding of a Danish study that around 50% of patients with cancer do not present with alarm symptoms.25 The factors influencing referral, however, remain incompletely understood. A study using the General Practice Research Database found that morbidity explained 30% of total variation, whilst that attributable to practices was only 5%.26 Socioeconomic status of the practice population explains about a quarter of the observed variation.27,28 A significant part of the variation remains unexplained and may relate to intrinsic psychological variables on the part of the GP and hospital supply factors.29 This study has highlighted that referral rates alone are a poor measure of quality of clinical care.
The current findings of a negative correlation between referral ratios and conversion rates and positive correlation between referral ratios and detection rates are consistent with earlier studies; for example of breast and gynaecological cancer 2WW referrals, where a downward trend in conversion rates was observed as referrals rose in the years after introduction of the urgent referral pathway.30,31
Implications for research and practice
A high conversion rate implies efficient use of the 2WW referral pathway. A high detection rate implies that fewer patients are being diagnosed by routes that are either slower, such as routine referrals, or as emergencies, a route associated with poorer outcomes.32 A high conversion rate together with a high detection rate (top right quadrant, Figure 3) therefore constitutes an indicator of good clinical practice and the positive correlation found across all practices represents a quality gradient in cancer referral practice. Furthermore, practices in the top left quadrant (low conversion, high detection) may be overusing the 2WW referral pathway, while those in the bottom right quadrant (high conversion, low detection) may not be using it enough. Those practices in the bottom left quadrant (low conversion, low detection) may be poor at case selection, implying poor clinical practice. These interpretations can help practices to interpret their practice cancer profiles, can inform a more meaningful dialogue between primary care, secondary care and cancer networks and allows them to measure improvement over time.
The Quality and Outcomes Framework (QOF) contains only two indicators for cancer care, neither of which relate to earlier diagnosis. These findings show that two separate, readily available measures of diagnostic performance (conversion rate and detection rate) are correlated in such a way as to offer a means of distinguishing good and poor referral practice, and could serve as the basis for a QOF indicator. Further modelling is required, however, to investigate the feasibility of developing a robust indicator based on these two measures which takes into account both systematic and random variation between practices.
These findings can inform QIPP initiatives, notably those intended to reduce inappropriate referrals. For cancer, 2WW referral rate alone is not a measure of quality, and the relationship between conversion and detection rates is more important. Similar relationships may be evident in other clinical areas. For example, practice quality of care (overall clinical QOF score) has already been shown to be associated with risk of admission for angina.33 The analysis of referrals to rapid access chest pain clinics using this study’s approach may allow new insights into quality of cardiovascular care.
Practice cancer profiles were provided to practices for the first time in 2010 and, by repeating this analysis in 2011, their impact on conversion and detection should be apparent. Further detailed study of those practices that achieve high conversion and high detection rates may give insights into the direction for future quality improvement initiatives for cancer diagnosis in general practice. Conversely, the use of cancer-specific audit and significant event analysis may help practices with low conversion and detection rates to identify where they may have scope for improvement.34
There remains a need for more detailed analyses of these data, to investigate possible explanations for why those practices with the lowest conversion rates also tend to have much lower detection rates (and vice-versa) and to determine whether the quality gradient is consistent across individual cancer sites and how it impacts on patient outcomes such as survival. The routine collection of this data also allows the possibility of longitudinal research studies of the impact of quality improvement initiatives in general practice.
Discuss this article
Contribute and read comments about this article on the Discussion Forum: http://www.rcgp.org.uk/bjgp-discuss
Acknowledgments
Department of Health for providing access to these activity data via the Cancer Waiting Times Database. Jason Poole for advice on the decile analysis.
Notes
Funding
No funding received.
Ethical approval
Trent Cancer Registry has permission under section 251 of the NHS Act 2006 to process confidential patient information. The Department of Health allows Trent Cancer Registry to have access to the CWT-Db to carry out specific analyses on behalf of Department of Health, the National Cancer Action Team and the National Cancer Intelligence Network.
Provenance
Freely submitted; externally peer reviewed.
Competing interests
The authors have declared no competing interests.
- Received January 29, 2012.
- Revision received February 14, 2012.
- Accepted April 10, 2012.
- © British Journal of General Practice 2012
REFERENCES
In this issue


Jump to section
More in this TOC Section
Related Articles
Cited By...

