


Abstract
Background There is conflicting evidence as to whether achievement of cholesterol targets at the population level is dependent on the choice and cost of statin.
Aim To investigate the practice-level relationship between cholesterol quality indicators in patients with heart disease, stroke, and diabetes and prescribing of low-cost statins.
Design and setting Correlations and linear regression modelling of retrospective cross-sectional practice-level data with potential explanatory variables in 7909 (96.4%) general practices in England in 2008–2009.
Method Quality indicator data were obtained from the Information Centre and prescribing data from the NHS Business Authority. A ‘cholesterol quality indicator’ score was constructed by dividing the numbers of patients achieving the target for cholesterol control of ≤5 mmol/l in stroke, diabetes, and heart disease by the numbers on each register. A ‘low-cost statin’ ratio score was constructed by dividing the numbers of defined daily doses of simvastatin and pravastatin by the total numbers of defined daily doses of statins.
Results Simvastatin accounted for 83.3% (standard deviation [SD] = 15.7%) of low-cost statins prescribed and atorvastatin accounted for 85.7% (SD = 14.8%) of high-cost statins prescribed. The mean cholesterol score was 73.7% (SD = 6.0%). Practices using a higher proportion of the low-cost statins were less successful in achieving cholesterol targets. An increase of 10% in the prescribing of low-cost statins was associated with a decrease of 0.46% in the cholesterol quality indicator score (95% confidence interval = –0.54% to –0.38%, P<0.001).
Conclusion Greater use of low-cost statins was associated with a small reduction in cholesterol control.
INTRODUCTION
Statins have been available in primary care for over 20 years and they are highly effective in reducing both mortality and cardiovascular events in heart disease, which is the leading cause of morbidity and mortality worldwide.1 Their use in patients with cardiovascular disease, stroke, and diabetes is recommended by guidelines internationally,2 including those published by the National Institute for Health and Clinical Excellence (NICE) for England and Wales and in the Quality and Outcomes Framework (QOF) in UK primary care.3,4 Statins are also indicated for primary prevention of cardiovascular disease;5 however, there is conflicting evidence for their cost effectiveness in this situation.6 There is extensive variation at the general practice level, both in prescribing costs for statins and in quality indicator performance for cholesterol-lowering targets.7,8
There are five statin drugs currently available for primary care: atorvastatin, fluvastatin, pravastatin, rosuvastatin, and simvastatin. There is a 14-fold variation in the cost of statins, with UK prices ranging from £1.72 ($2.72, €2.07) for simvastatin to £29.69 ($46.96, €35.69) for rosuvastatin for 4 weeks’ treatment at the recommended dose for secondary prevention.5 There are small differences between statins regarding their effectiveness in lowering cholesterol. Three studies reported that rosuvastatin and atorvastatin were most effective at reducing low-density lipoprotein (LDL) cholesterol.9,–,11 NICE guidance states that, when starting a statin, a drug with a ‘low acquisition cost’ should first be selected, and the Department of Health in the UK has recommended that low-cost statins should make up at least 79% of all statin use. This target is incorporated into a performance indicator for primary care in the NHS Better Care, Better Value Indicators.12 Two studies have been published which examine the relationship between achievement of cholesterol targets and the volumes of low- and high-cost statins, with conflicting findings.13,14
The hypothesis for this study was ‘quality indicator performance in cholesterol-lowering targets for heart disease, stroke, and diabetes is independent of the cost of statin used’. The question is important because it is not known whether achievement of cholesterol targets at the population level is dependent on the choice and cost of statin; statins are effective in reducing mortality in selected patients; there are significant differences in the costs of statins; and there is a significant variation in both the costs and quality of statin prescribing in primary care.7,8 The study objective was to investigate the practice-level relationship in England between the achievement of cholesterol quality indicators in patients with heart disease, stroke, and diabetes and the prescribing of low-cost statins.
How this fits in
There has been conflicting evidence whether achievement of cholesterol targets at the population level is dependent on the choice and cost of statin. This study suggests that practices that use a higher proportion of low-cost statins (simvastatin and pravastatin) have lower achievement of quality indicators of cholesterol control in patients with heart disease, stroke, and diabetes. For an average practice, increasing the proportion of high-cost statins prescribed from 50% to 60% would be expected to increase the proportion achieving the cholesterol target from 73.7% to 74.2%.
METHOD
A cross-sectional study was performed, with analysis at the practice level. The study population included all general practices in England with data available in 2008/2009, and for each practice, all patients who had a Read Code for diabetes, stroke, or heart disease were included.
Quality and Outcomes Framework data
QOF data for each practice were obtained from the Information Centre for Health and Social Care, collected on 1 April 2009. These data contained information for each practice on the achievement of cholesterol targets of a total cholesterol ≤5 mmol/l in the past 15 months for the three diseases included in the study. Data were available for the numerator population (numbers of patients below the target cholesterol level ≤5 mmol/l, N), the denominator population (total numbers of patients with each disease condition of diabetes, stroke or heart disease, (D), and the numbers of patients who had been excluded by the practice from the denominator populations by the process of ‘exception reporting’ (E).
Prescribing data
Prescribing data were obtained from the Prescription and Pricings Division of the NHS Business Authority. These data are calculated from each prescription issued in primary care and dispensed by a pharmacist or dispensing surgery, and the term ‘prescribing data’ is used in this paper to describe such data. These data consisted of the number of ‘defined daily doses’ (DDDs) for each of the five statin drugs dispensed for each practice in England in the year 2008/2009 ending on the last day of March 2009. The DDD is a tool developed by the World Health Organization (WHO) and used to standardise prescribing volume, and is the assumed average maintenance dose per day (Table 1).15 DDDs are similar to the UK’s standardised measure, which is the ‘average daily quantity’ (ADQ), the only difference being the doses for fluvastatin.16 A standardised measure for the volume of statin prescribing in each practice was derived, adjusted for the population profile of the practice in the following way: the total number of DDDs prescribed in each practice was divided by the number of ‘statin-specific therapeutic group age–sex-weightings-related prescribing units’ (statin STAR-PUs) allocated for that practice. Statin STAR-PUs are measures of the registered patient list in each practice, standardised according to national statin prescribing patterns in different age and sex groupings.17,18
World Health Organization definitions for ‘defined daily doses’
Practice and population characteristics
A detailed summary of practice characteristics known to influence prescribing patterns, including practice list size, rural or urban status, the age/sex breakdown of the registered population, the number of full-time equivalent GPs, and practice training status were obtained from the general medical services database.19 Demographic data on social deprivation (Indices of Multiple Deprivation [IMD] 2010) were obtained for lower layer super output areas (LSOAs), which consist of an average of 1500 residents.20 Pooled demographic data from these localities were used as a proxy for the characteristics of the registered population of each practice.
Construction of ‘cholesterol quality indicator’ and ‘low-cost statin ratio’ scores
To construct a cholesterol quality indicator score for each practice, the total number of patients who achieved the target for cholesterol reduction (≤5 mmol/l) in stroke, diabetes, and heart disease was divided by the total number of patients on those disease registers including exception-reported patients. This calculation is:
N * 100/(D + E).21
To construct a low-cost statin ratio for each practice, the number of DDDs prescribed for simvastatin and pravastatin was divided by the total number of DDDs prescribed for all five statins. This calculation for each practice is:
(DDDs simvastatin + pravastatin) * 100/total statin DDDs.
Both the cholesterol quality indicator score and the low-cost statin ratio scores were expressed as a percentage.
Statistical tests
Correlations and linear regression modelling of retrospective cross-sectional data were conducted, and the data were computed in SPSS (version 16). The dependent variable was achievement of cholesterol quality indicators for each practice. The independent variables were: the practice measures for the low-cost statin ratio score; the volume of prescribing measured as the numbers of DDDs divided by the statin STAR-PUs allocated to that practice; the practice list size including all patients; the IMD rank; the rural/urban mix of the practice population; whether the practice had training status; and the average age of the patients.
Three sensitivity analyses were conducted. First, the combination treatment of simvastatin with ezetimibe as a high-cost statin was included, as this is the most expensive treatment for cholesterol reduction. Secondly, a low-cost statin ratio was used, calculated with ‘items’ of statins instead of DDDs. An item is one prescription for a particular drug and is independent of the amount or dose of drug prescribed; the usual length of prescription in English primary care is typically for 1–3 months.17,22 It is the traditional unstandardised measure of volume used by the Department of Health in the UK when calculating the low-cost statin index performance indicator.12,17 Thirdly, the primary outcome was reanalysed, using the UK’s standardised measure for prescribing volumes, ADQs.16
RESULTS
QOF data were available for all of the 8198 general practices in England. Of these, 40 were excluded from the analysis on the basis of their list size (<1000 registered patients), since practices with such small list sizes are likely to be atypical. A further 249 practices were omitted because of incomplete primary outcome data. This left a total of 7909 practices (96.4%) with full sets of data for multivariate analysis.
Table 2 displays the descriptive data. Data both for the cholesterol quality indicator and for achievement of the low-cost statin ratio were normally distributed. Mean practice achievement of the cholesterol quality indicator was 73.7% (standard deviation [SD] = 6.0%). Mean practice achievement of the low-cost statin ratio using DDDs was 41.5% (SD = 16.8%), whereas mean practice achievement of the low-cost statin ratio using items was 74.7% (SD = 10.8%). Using DDDs as the measure of prescribing volume, simvastatin accounted for 83.3% (SD = 15.7%) of low-cost statin prescribing, and atorvastatin accounted for 85.7% (SD = 14.8%) of high-cost statin prescribing. The most commonly used statin was atorvastatin (52.3% of all statins prescribed), followed by simvastatin (33% of all statins prescribed). Together, these two drugs accounted for over 85% of all statins prescribed (Table 1). The mean practice size was 6643 (SD = 4052), the mean age of patients was 39.2 years (SD = 3.9 years), and 28% of practices were training practices.
Descriptive statistics
Predicting the cholesterol quality indicator score using the low-cost statin ratio
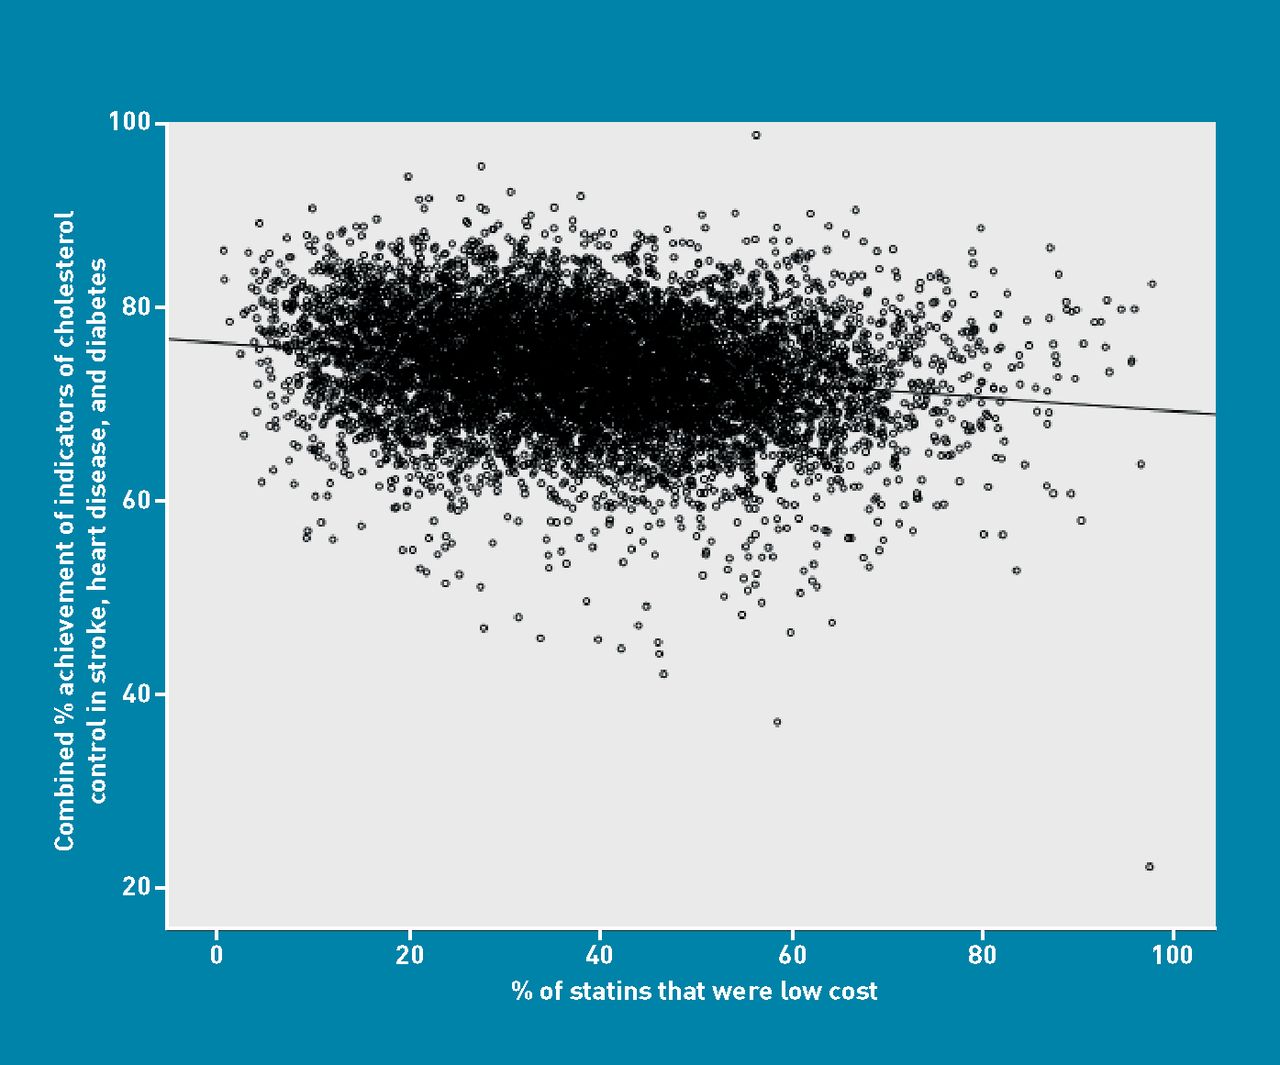
There was a significant (though small) negative correlation between the achievement of the cholesterol quality indicator and the low-cost statin ratio (Pearson correlation coefficient = –0.180, 95% confidence interval [CI] = –0.20 to –0.159, P<0.001). These data are displayed as a scatter plot in Figure 1. In the final linear regression model displayed in Table 3, the association between achievement of the cholesterol quality indicator and the low-cost statin ratio remained negative (adjusted β coefficient = –0.046, 95% CI = –0.054 to –0.038). There were significant positive associations between achievement of the cholesterol quality indicator and the volume of statins prescribed, training practices, and the average age of patients. There was a small positive association with IMD rank, and a small negative association between increasing list size and achievement of the cholesterol quality indicator. The final model explained 7.3% of the overall variation in quality indicator scores. Variance inflation factor tests indicated that there was no significant collinearity between the predictor variables.

Scatter plot of cholesterol indicator achievement and percentage of low-cost statins prescribed.
Relation between cholesterol quality indicators, low-cost prescribing measured in defined daily doses and GP/practice characteristics (adjusted coefficients, final model)a
Relationship between the low-cost statin ratio using DDDs and the low-cost statin ratio using items
There was a significant and positive correlation between the low-cost statin index measured by items and the low-cost statin index measured by DDDs (Pearson correlation coefficient = 0.67, 95% CI = 0.66 to 0.68, P<0.001). This relationship appears linear and is displayed in Figure 2.

Scatter plot of low cost statin ratio using items and using DDDs.
Sensitivity analysis
In sensitivity analysis, the conclusions were similar when including the combination treatment of simvastatin with ezetimibe, when using items of statins prescribed rather than DDDs and when using ADQs in place of DDDs as the measure of volume.
DISCUSSION
Summary
There are three principal findings. First, there is a significant but small negative association between cholesterol quality indicator scores and the prescribing of cheaper statins (mainly simvastatin) as a proportion of overall statin prescribing. This does, however, contain two factors that are under the control of the physician, namely choice of drug and volume of prescribing. Prescribing of more expensive statins explained only 7.3% of the variation in achievement of cholesterol targets, so the choice of statin is only a minor factor in the achievement of quality indicator scores.
Secondly, the low-cost statin ratio when calculated using DDDs was low (mean 41.5%, SD = 16.8). This contrasts with the low-cost statin ratio used as the performance indicator recommended by the Department of Health using ‘items’, which has a mean value of 74.7% (SD = 10.8%). This indicates that when more expensive statins are prescribed, they are prescribed either at a higher dose or for a longer duration compared to low-cost statins. The Department of Health’s preferred method of describing the volume of low-cost statins used may overestimate low-cost statin prescribing.
The third important finding is that atorvastatin is now the most common statin used in England when measured using either DDDs or ADQs. This contrasts with national data, which use items to estimate volumes, and, at the time of this study, simvastatin was the most common item prescribed when calculated using items (approximately 70% of all statin items).23
Strengths and limitations
This study uses national datasets and measures prescribing volume using DDDs, the preferred method recommended by WHO. The QOF indicators include the secondary prevention indications for statins, and beyond primary prevention there are no other indications for prescribing statins that could confound the results. The findings of the study are, however, constrained by several limitations. Proxy measures for the role of social deprivation were used, which may underestimate health inequalities24 and DDDs do not exactly match the average maintenance dose for England, although they are very similar.16 There could be inaccuracies in the data that were sourced on QOF and prescribing and prescribing data measure only those prescriptions that have been both prescribed and dispensed. It is currently not possible to accurately measure the proportion of statins used for primary prevention and there will be a small number of patients with comorbidities in stroke, diabetes, and heart disease who will have been counted more than once for achieving cholesterol targets. Finally, this is an observational study and as such it does not demonstrate causation, and as an ecological study, associations at the practice level may not apply to individuals.
Comparison with existing literature
A smaller-scale study examined this relationship in 70 practices in one county in England in 2006/2007 and reported a significant negative correlation between achievement of cholesterol targets and low-cost statin prescribing.14 In contrast, a further study examined this relationship at the primary care trust (PCT) level in England in 2005/2006 and reported no significant association between achievement of cholesterol targets and low-cost statin prescribing.13 Both studies used items rather than ADQs or DDDs, and the second study may be liable to the risk of a type 2 error as the analysis was at the PCT level. The present study concurs with previous work, which has shown that use of the number of items (prescriptions) of statins is an imprecise measure of the overall volume of statin prescribing.25
Implications for practice and research
The use of items in the current Department of Health’s performance indicator for calculating the low-cost statin ratio does not represent an accurate reflection of volumes of statins prescribed and should be reviewed. As the use of higher-cost statins (mainly atorvastatin in this study) is associated with higher performance in cholesterol quality indicator achievement when compared with use of low-cost statins (mainly simvastatin), the continuing use of this ratio as an indicator in the NHS Better Care, Better Value Indicators set12 should also be re-evaluated in terms of cost effectiveness. As drug patents expire, the price of high-cost statins is likely to fall with time, making it more likely that those statins will become more cost effective.
More research is needed into factors that influence the quality of primary care prescribing. This includes a patient-level study to disentangle the prescribing of statins for primary and secondary prevention and then to derive a ‘cholesterol quality indicator’ for both primary and secondary prevention.
Acknowledgments
We are grateful to Jane Gidney and Mary Weatherstone from NHS Norfolk for their help with combining the datasets. Practice-level data were obtained from the Information Centre for Health and Social Care, ‘Copyright© 2012, re-used with the permission of The Health and Social Care Information Centre. All rights reserved.
Notes
Funding
None.
Ethical approval
Ethics approval was granted from University of East Anglia Faculty of Health Ethics Committee, ref 2009/2010-066.
Provenance
Freely submitted; externally peer reviewed.
Competing interests
The authors have declared no competing interests.
Discuss this article
Contribute and read comments about this article on the Discussion Forum: http://www.rcgp.org.uk/bjgp-discuss
- Received May 31, 2012.
- Revision received July 10, 2012.
- Accepted August 31, 2012.
- © British Journal of General Practice 2012
In this issue


Jump to section
More in this TOC Section
Related Articles
Cited By...

