


Abstract
Background General practices in the UK receive incentive payments for managing patients with selected chronic conditions under the Quality and Outcomes Framework (QOF) scheme. Payments are made when a negotiated threshold percentage of patients receive the appropriate intervention.
Aim From 2013–2014 in England the Department of Health has proposed that this negotiated threshold is replaced with a value equal to the 75th percentile of national performance to attract maximum payments. This is an investigation of the potential impact of this change on practice income and workload.
Design and setting Analysis of 2011–2012 QOF dataset (the latest available) which covers 8123 GP practices and 55.5 million patients in England.
Method The 75th percentile of performance was calculated for 52 clinical indicators and applied to 2011–2012 performance. Estimations were made of financial and workload impacts on practices, and whether practices with different characteristics would be disproportionately affected.
Results The proposed changes will result in an increase in the upper payment threshold of each clinical indicator by a mean of 7.47% (range 2.16–38.87%). If performance remains static practices would lose a mean of 47.68 (0–108.33) QOF points, equivalent to a mean financial change of −£279.60 (−£35 352.50 to +£19 957.78) per practice for these 52 indicators.
Conclusion Increasing the QOF upper payment threshold to the 75th percentile of national performance will, if clinical performance remains static, substantially reduce the mean number of QOF points achieved per practice. However, this translates into only a small mean loss of income per practice.
INTRODUCTION
In the UK general practices have received incentive payments for performance against clinical, organisational, patient experience, and additional services indicators under the Quality and Outcomes Framework (QOF) scheme since 2004–2005.1 Clinical performance indicators are the largest category of indicators and source of payment. The clinical performance of practices is expressed as the percentage of patients on a disease register meeting a certain criteria, for example percentage of patients with hypertension with a blood pressure less than 150/90 mmHg. Practices start to receive payments when a lower payment threshold is achieved, up to the maximum possible payment when an upper payment threshold is achieved. Performance between these two thresholds results in a payment proportionate to the level of performance achieved. Payment thresholds differ for each indicator and up until now have been negotiated nationally. Across England in 2011–2012 practices achieved the upper payment thresholds for 86.6% of all clinical indicators (that is, received maximum payments).2
The Department of Health in England has recently proposed increasing the upper payment threshold for each clinical indicator in the QOF in England up to the 75th percentile of the previous year’s national performance for that indicator. This would result in an across the board rise of payment thresholds. The government’s rationale for this is to both ‘implement all the NICE (National Institute of Health and Care Excellence) recommendations for changes to QOF’ and to ‘ensure more patients receive evidence-based care that will save more lives’.3 The British Medical Association’s General Practitioners’ Committee (GPC) expressed concern that the new indicators could ‘significantly skew workload towards patients with specified conditions at the expense of other patient care or services’ and ‘lead to more ‘box ticking’ at the expense of holistic care of patients.’4 The Department of Health did not accept these arguments although it did make some concessions in terms of phasing of introduction of new indicators over 2 years.
The overall evidence for the effectiveness of incentive payments on clinical performance is not strong. Few robust studies have been carried out and the observed effects tend to be small or short-lived.4,5 Nevertheless, there is some evidence that quality of clinical care improved after introduction of the QOF scheme.6 There have also been specific improvements in relation to recorded quality of care for diabetes and preventive care.7,8 Both clinical staff and the public have expressed concerns about unintended consequences of incentive payments.9,10 There have also been concerns that practices might game the system through exception reporting.11
This paper examines the potential impact of applying the proposed 75th percentile upper payment threshold to QOF clinical performance indicators in terms of the estimated impact on clinical workload and the estimated financial impact to practices if performance remained static, and whether practices with particular characteristics are more likely to be adversely affected by these proposals.
How this fits in
Financial incentives for improving clinical outcomes have been shown to improve performance in different clinical settings. However, these improvements are not always achieved through actual improvements in clinical care. The proposed increases in the upper payment threshold to 75% of national performance will, on average, have only a small negative financial impact on practices but for some practices will result in significant increases in clinical workload if these thresholds are to be achieved. Unrealistically large increases in workload, without sufficient remuneration may result in practices either deciding not to deploy resources to achieve these thresholds or to increase the use of exception reporting.
METHOD
The 2011–2012 QOF dataset was used, the latest available, which covers 8123 GP practices and 55.5 million patients in England. Focus was exclusively on the 87 indicators in the clinical domain. The indicators included in the 2011–2012 QOF dataset differ somewhat compared with those proposed for 2013–2014. Indicators were therefore excluded that had been retired or where the indicator had changed substantially between these 2 years (14 indicators) or where the QOF points available for an indicator had changed between the 2 years (3 indicators: BP5, SMOKING3, SMOKING4) to allow direct comparisons between the years. Indicators were also excluded that did not have a numerical performance threshold (1 indicator: PC2) or were for maintaining disease registers (17 indicators) as they do not allow a calculation of the 75th percentile of performance. Indicators that were the same or judged to have undergone only minor changes were included. After exclusions, 52 clinical indicators were included that are present in both the 2011–2012 and 2013–2014 QOF schemes. A complete list of all the indicators included in the analysis is available from the authors on request.
For clarity when a ‘patient’ is referred to, this means an individual who may have one or more health conditions, an ‘indicator’ is the QOF indicator that refers to a specific condition, ‘thresholds’ are the values for upper or lower payments and relate to a specific indicator, and a ‘metric’ refers to an individual patient’s clinical measurements, for example blood pressure or cholesterol level. Several different indicators and metrics may be applicable to one patient. For example, the 11 indicators for diabetes may be applicable to a patient with diabetes. Some patients will also be on several different disease registers if they suffer from multiple conditions. This detail is not identified within the QOF dataset so it is not possible to say precisely how many patients will be affected by a change in the threshold of an indicator. Therefore, reference is made to the number of metrics (for example blood pressures) that will need to be improved for a practice to reach the new upper payment threshold.
The 75th percentile of performance was calculated for each clinical indicator and rounded to the nearest whole number. This was then used as the proposed upper payment threshold. Lower payment thresholds were set at 40% below the upper payment threshold as is suggested in the government response to the consultation.11
The currently used method of calculating QOF points and the 2013–2014 QOF points allocation for each indicator were then applied to calculate the number of QOF points a practice would achieve in 2013–2014 if current performance were maintained and the 75th percentile of performance set as the upper payment threshold. Practices achieving performance equal to or above the upper payment threshold were awarded all available points, practices achieving performance below the lower payment threshold were awarded no points, and practices between these thresholds were awarded a proportion of the available points using the standard calculation.12 The value to each practice of the QOF points in both 2011–2012 and 2013–2014 was then calculated using the standard remuneration formula:13
 where QOF points = the total number of QOF points for an indicator, value = the negotiated financial value of a QOF point (£133.76 for 2011–2012 and £156.92 for 2013–14),13 APDF = Adjusted Practice Disease Factor (calculated by dividing the raw practice disease prevalence by national English mean prevalence), and CPI = Contractor Population Index (calculated by dividing the practice’s registered population by the English average, quoted as 5891). It was assumed that disease register sizes, performance, disease prevalence, and the rate of exception reporting remain static between 2011–2012 and 2013–2014 for the sake of clarity and the difficulties in predicting year to year changes and the impact of policy changes. The strengths and weaknesses of this approach are explored in the discussion.
In 2013–2014 the CPI calculation will change and will be calculated by dividing a practice’s most recently established registered population by the national average for England ‘on the 1st Jan in the year immediately before the commencement of the financial year to which the achievement payment relates’.13 However, as these data (that is the list registered population as of 1 January 2013) are not available at present, the same calculation was used for CPI in both years.
The impact of raising the payment threshold was examined in terms of the change to clinical activity if all practices were to achieve the upper payment threshold. Where the practice’s current performance was lower than the 75th percentile, the additional number of metrics that would be required to be treated to the required threshold by each practice for each indicator was calculated using the following formula:
 where p = the 75th percentile value for a specific indicator, expressed as a proportion, den = the quoted denominator for the specific indicator in a practice, equivalent to number of patients for whom the indicator is considered appropriate (that is meet age range specifications) indicator specification and not exception reported, and num = the quoted numerator for the specific indicator in a practice, equivalent to number of patients in the denominator population currently meeting the performance threshold.
A multiple regression model was used to explore the association between different variables and the estimated absolute change to practice income. The independent variables in the models included practice list size, practice deprivation score (index of multiple deprivation 2010, Public Health England14), percentage of patients aged <15 years, percentage of practice list size aged >65 years (the age group most affected by the chronic diseases covered by QOF), full-time equivalent GPs per 10 000 patients, percentage of GPs aged ≥55 years, percentage of practice GPs who are female, and percentage of practice GPs trained in the UK. Practice deprivation score was calculated by applying the lower super output area deprivation data proportionately to the registered practice populations. Twenty-five practices (0.3% of total) were excluded from the models because deprivation scores were not available for them.
RESULTS
Applying the 75th percentile as the upper payment threshold to the 52 clinical indicators will result in an increase in the threshold of each clinical indicator by a mean of 7.47% (range 2.16–38.87%).
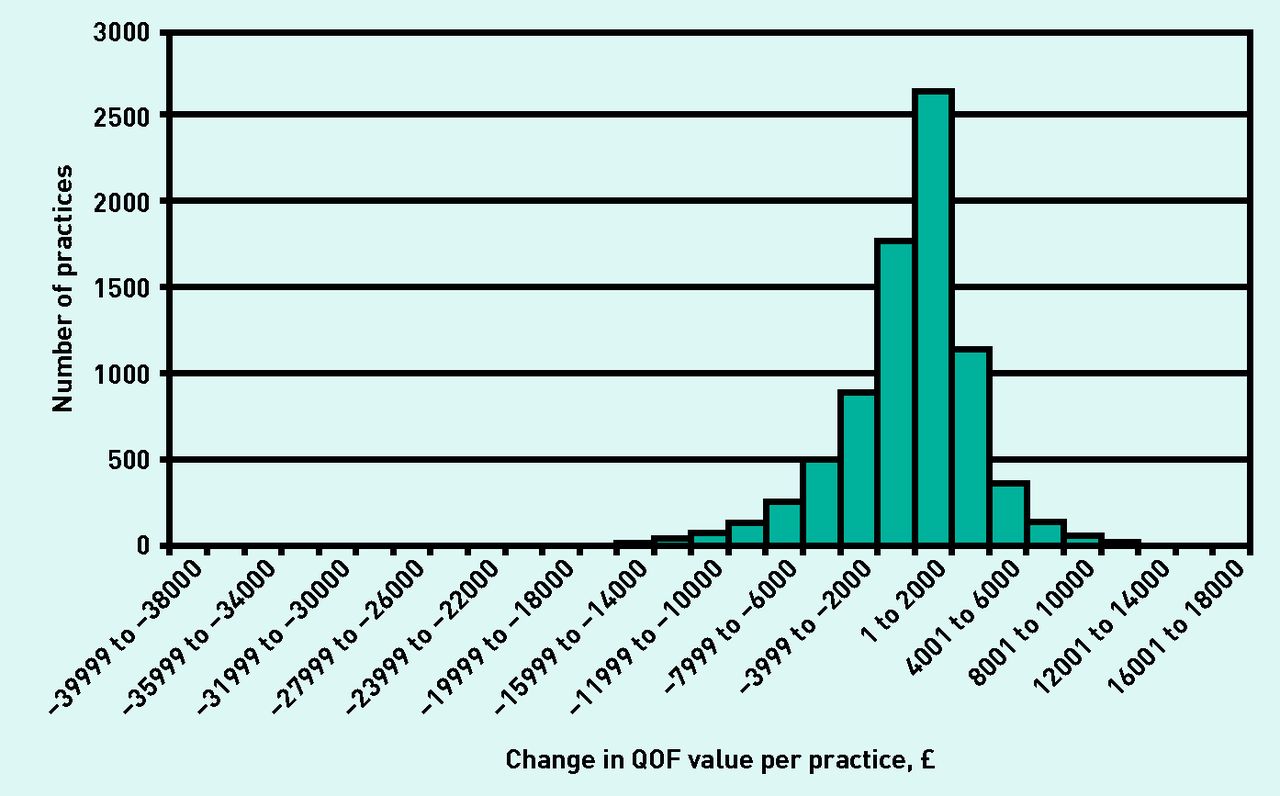
Table 1 shows that if the 75th percentile upper and lower payment thresholds and the 2013 to 2014 QOF points values were applied to 2011 to 2012 performance, assuming no improvement in performance, practices would lose a mean of 47.68 QOF points (range 0–108.33) equivalent to a mean financial change of −£279.60 (range −£35 352.50 to +£19 957.78) per practice. The distribution of the change in payments shows a significant clustering of results around the mean with over 95% of practices estimated to have a change in payment of between −£8000 and +£8000. Of all practices, 4397 (54%) are estimated to benefit financially (Figure 1). In total the reduction in payments overall to practices in England would be £2 271 173.
Implications to an average practice if the 75th percentile of performance was introduced for all clinical indicators in 2013–2014

Distribution of estimated change in Quality and Outcomes Framework (QOF) value if the 75th percentile of performance was introduced for all clinical indicators in 2013–2014.
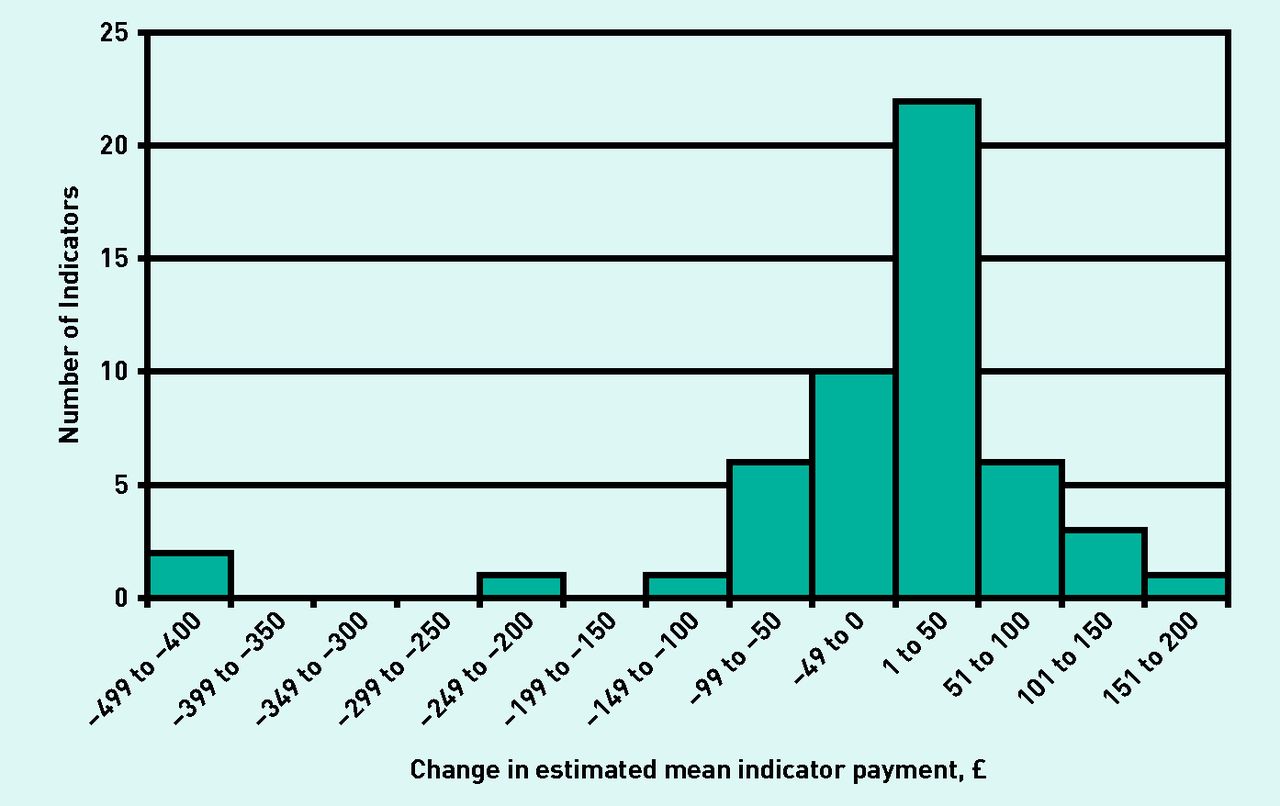
Although it is estimated that all indicators will demonstrate an overall reduction in QOF point achievement (mean −0.92, range −0.04 to −3.98), this does not translate into consistent reductions in payment. It is estimated that there will be a mean change in payment per QOF indicator of −£5.38 per practice (range −£434.45 to +£176.30). Thirty-two of the 52 indicators (61.53%) have an estimated mean increase in value; the distribution is shown in Figure 2. This is caused by the increase in the value of a QOF point between 2011–2012 and 2013–2014 from £133.76 to £156.92, which offsets many of the negative financial consequences of raising the upper payment threshold and thus a reduction in QOF point achievement. The estimated increases in the payment threshold, QOF points, and values for individual clinical indicators are available from the authors on request.

Distribution of the change in the estimated mean payment per clinical indicator between 2011–2012 and 2013–2014.
Across the whole of England, it was calculated that an additional 2 756 874 clinical metrics will need to be improved if all practices were to reach the 75th percentile upper payment threshold on all indicators. This is equivalent to each practice having to improve performance by a mean of 339 (range 0–4057) metrics to reach the upper payment threshold on all indicators.
The multivariate regression model explores the relationship between the change in practice income and several variables (Table 2). There is a statistically significant negative association between practice list size, practice deprivation score, percentage of practice population aged <15 years and percentage of practice population aged >65 years, and the estimated absolute change in income. There is also a significant positive association between the percentage of female GPs in a practice and change in income, although the effect size is much smaller than the other variables that have a significant association.
Multiple regression model of estimated absolute change in QOF payments for 52 clinical indicators between 2011–2012 and 2013–2014 and the association between different variables
DISCUSSION
Summary
Increasing the QOF upper payment threshold for clinical indicators to the 75th percentile of national performance will substantially increase the upper payment threshold for most clinical indicators compared with the 2011–2012 thresholds. If clinical performance remains static this is estimated to result in a mean loss of 47.68 QOF points per practice. However, this does not necessarily translate into a large reduction in payments to most practices; with mean change in income of a practice for these clinical indicators being a loss of only £279.60 per year. Larger practices are estimated to lose relatively more income than smaller practices. For most indicators, mean payment change from 2011–2012 to 2013–2014 is positive. This counterintuitive finding is primarily a result of the rise in payment thresholds being offset by the increase in the nominal value of a QOF point from £133.76 in 2011–2012 to £156.92 in 2013–2014. These findings do not include any additional potential changes of income from the abolition of payment for maintaining disease registers or retirement, amendments to, or introduction of, new indicators, or the impact of the non-clinical domains of the QOF scheme. These may be significant and the response of practices to these other changes is difficult to predict.
The relatively large rises in the upper payment threshold for some indicators reflects the fact that national performance for these indicators is already far above the current negotiated upper payment threshold. Therefore, for many practices the actual number of metrics that require improvement to reach the 75th percentile upper payment threshold is relatively small as a proportion of total disease registers. On average, each practice needs to improve performance on 339 metrics, but because multiple indicators relate to the same disease area and because of comorbidity between disease areas, this translates to an improvement in treatment for a much smaller number of patients. The authors have been unable to find estimates of the number of metrics that apply to the average patient on disease registers. However, a relatively common example could be a patient who is a smoker and suffers from cardiovascular disease, hypertension, and diabetes. This one patient may qualify for up to 19 of the included indicators.
Strengths and limitations
Using 2011–2012 QOF data uses the latest publicly available data, which includes indicators that are well evidence-based and is both complete and consistent across a large population. It was assumed that practice list size, disease register size, prevalence, and the rate of expectation reporting remain the same between 2011–2012 and 2013–2014. It is acknowledged that the most likely scenario, given the known demographic changes in the English population, is an average growth in practice list size, disease register size, and disease prevalence. An increase in exception reporting is also likely.15 However, these potential changes have not been modelled both for the sake of clarity and lack of confidence about the degree of change and how the changes to thresholds and policy overall will affect practice behaviour.
Comparison with existing literature
Experience and evidence from the UK and abroad shows that payment for performance incentives do impact on performance and that performance tends towards the level set for payment.16–18 However, although some studies show that increasing the performance threshold does make clinical metric and outcome differences for patients,15,19 there is other evidence that shows this is not always achieved through improved clinical care. Increases in the rate of exception reporting can be used to artificially increase the headline performance figure of a practice and have been demonstrated to occur within the QOF system.20,21 This allows practices to achieve higher payment thresholds without necessarily improving the clinical metrics of patients as practices struggle to meet increasingly demanding targets. This was one of the concerns raised by the GPC in the consultation on the government proposals. Another concern of the GPC is a potential skewing of care towards patient groups identified in QOF indicators. This has been shown to occur in the QOF scheme with metrics for conditions included in QOF increasing at a significantly faster rate than conditions that have not been included.17
Implications for research and practice
Payment for performance in health care is increasingly used to drive up performance. Although there is evidence that payment incentives increase the clinical management and outcomes of patients, there is an increasing body of evidence that demonstrates the unintended consequences of this approach with the increases in the rate of exception reporting being the most widely reported. Further research is required to examine both the positive and negative effects of payment incentives for performance within health care, especially the unintended consequences on patient groups with conditions not included in pay for performance schemes. The implementation of these proposed changes to the QOF payment thresholds may provide one such opportunity.
Acknowledgments
We acknowledge Rachel Foskett-Tharby for advising us on the methodology of remuneration within the QOF scheme.
Notes
Funding
Part of the analysis in this study was supported by the EPSRC Multidisciplinary Assessment of Technology Centre for Healthcare (MATCH) programme (EPSRC Grant GR/S29874/01).
Ethical approval
None required.
Provenance
Freely submitted; externally peer reviewed.
Competing interests
The authors have declared no competing interests.
Discuss this article
Contribute and read comments about this article: www.bjgp.org/letters
- Received June 10, 2013.
- Revision received July 23, 2013.
- Accepted August 29, 2013.
- © British Journal of General Practice 2014
REFERENCES
In this issue


Jump to section
More in this TOC Section
Related Articles
Cited By...

