


Abstract
Background The magnitude of the ‘white coat effect’, the alerting rise in blood pressure, is greater for doctors than nurses. This could bias interpretation of studies on nurse-led care in hypertension, and risks overestimating or overtreating high blood pressure by doctors in clinical practice.
Aim To quantify differences between blood pressure measurements made by doctors and nurses.
Design and setting Systematic review and meta-analysis using searches of MEDLINE, CENTRAL, CINAHL, Embase, journal collections, and conference abstracts.
Method Studies in adults reporting mean blood pressures measured by doctors and nurses at the same visit were selected, and mean blood pressures extracted, by two reviewers. Study risk of bias was assessed using modified Cochrane criteria. Outcomes were pooled across studies using random effects meta-analysis.
Results In total, 15 studies (11 hypertensive; four mixed hypertensive and normotensive populations) were included from 1899 unique citations. Compared with doctors’ measurements, nurse-measured blood pressures were lower (weighted mean differences: systolic −7.0 [95% confidence interval {CI} = −4.7 to −9.2] mmHg, diastolic −3.8 [95% CI = −2.2 to −5.4] mmHg). For studies at low risk of bias, differences were lower: systolic −4.6 (95% CI = −1.9 to −7.3) mmHg; diastolic −1.7 (95% CI = −0.1 to −3.2) mmHg. White coat hypertension was diagnosed more frequently based on doctors’ than on nurses’ readings: relative risk 1.6 (95% CI =1.2 to 2.1).
Conclusions The white coat effect is smaller for blood pressure measurements made by nurses than by doctors. This systematic difference has implications for hypertension diagnosis and management. Caution is required in pooling data from studies using both nurse- and doctor-measured blood pressures.
INTRODUCTION
The ‘white coat effect, or syndrome’ describes an elevation in blood pressure above a patient’s normal levels in association with a clinic or surgery visit. It occurs in up to 75% of patients with hypertension in tertiary care settings1,2 and may be universal, being also observed in normotension.3,4 It is distinct from ‘white coat hypertension’, which defines the subset of patients with blood pressures above hypertensive thresholds in the clinic but not in other settings.4,5 The white coat effect is more prevalent with older age, female sex, and is associated with anxiety and dementia.6,7 A large white coat effect (>30 mmHg systolic rise) has been associated with metabolic risk factors and independently predicts total and cardiovascular mortality;8 however all-cause mortality is lower for white coat than for sustained hypertension.9,10
The white coat effect for inpatients is higher when a doctor measures their blood pressure than when a nurse does.2 Systematic reviews have suggested that nurse-led care in hypertension appears to achieve lower outcome blood pressures compared with doctor-led or usual care.11–13 Half of the studies contributing to this finding in a previous review reported outcome blood pressures measured by the doctors or nurses themselves.12 These findings could be biased if the white coat effect is larger for doctors than the nurses. Nurse-led care of hypertension is becoming the predominant model in primary care, despite a limited evidence base.14,15 If blood pressures measured by nurses are indeed systematically lower than doctors’ readings, then that evidence base could be challenged as simply presenting evidence of the white coat effect in action. In clinical practice the risks of overdiagnosis and inappropriately treating hypertension based on such elevated doctors’ measurements must also be considered.16,17 As part of a continuing review of allied health professional-led hypertension care, this review was undertaken to quantify the magnitude of any difference in white coat effect between doctors and nurses.18
METHOD
This systematic review was conducted and reported in accordance with the MOOSE (Meta-analysis Of Observational Studies in Epidemiology) statement.19
Data sources and selection criteria
MEDLINE, CINAHL, Embase, and the Cochrane Central Register of Controlled Trials (CENTRAL) were searched from their respective start dates to 1 September 2011 using the text words ‘white coat’. Additional citations were identified from reference lists of full texts included in the review. Searches of individual journal collections (American Journal of Hypertension, Blood Pressure Monitoring, Hypertension, Journal of Human Hypertension, Journal of Hypertension), conference abstracts, and personal reference archives were also undertaken. No language restrictions were applied. Search updates for new publications were run until 30 September 2013.
How this fits in
Blood pressure measurements are elevated in the presence of a health professional — the ‘white coat effect’ — and this appears to be greater for doctors than for nurses. There is evidence for lower blood pressure outcomes in nurse-led clinics for hypertension compared with usual care by doctors, but the white coat effect is not taken into account in many such studies. This is the first systematic review to compare blood pressure measurements made by doctors and nurses; there is evidence that blood pressures recorded by doctors are systematically higher than those recorded by nurses within the same setting. The findings suggest that studies comparing doctor and nurse interventions require independent outcome measures to avoid bias, and that doctor-measured blood pressures may introduce bias into clinical decision making in hypertension.
Studies were sought reporting blood pressures measured by doctors and nurses during the same clinic visit, for adults aged ≥18 years with or without hypertension. Primary outcome measures were mean systolic and diastolic blood pressures measured by nurses and by doctors or differences between them, and proportions of patients diagnosed with white coat hypertension (defined as clinic blood pressure >20/10 mmHg higher than ambulatory or home-measured blood pressure), according to blood pressure measurements by doctors and nurses.
One author screened retrieved citations and abstracts for potentially relevant studies and a second author checked the selections. Studies assessed as definite or uncertain for inclusion were retrieved in full.
Data extraction and risk of bias assessment
Data were extracted independently by two reviewers using a standardised electronic form (available from the authors on request); treating hypertensive and normotensive subgroups as separate cohorts. Given the observational nature of studies, Cochrane risk of bias criteria20 were modified to assess study risk of bias on the basis of three relevant criteria: random order of doctor and nurse measurement, blinding of doctors and nurses to measurements made by each other, and blinding of outcome assessment by use of automated or random-zero sphygmomanometers. Level of risk of bias was scored as: high (2 points), unclear (1 point), or low (0 points), then summarised as a dichotomous overall risk of bias judgment of ‘high’ (total ≥3 points) or ‘low’ (<3 points).
Statistical analysis
Data were pooled and analysed using RevMan version 5.1 (The Cochrane Collaboration, Copenhagen, 2011). Analyses were undertaken for differences in mean systolic and diastolic blood pressure measurements between doctors and nurses. Because of the paired nature of the data (doctors and nurses measuring the same individuals), the standard errors of the mean differences between doctors’ and nurses’ blood pressure measurements were adjusted for within person correlations using published coefficients (that is, 0.771 for systolic blood pressure and 0.748 for diastolic blood pressure) in accordance with Cochrane Handbook methods.20,21,22 For dichotomous outcome measures effects, relative risks (RR) with 95% confidence intervals (CIs) were calculated. Heterogeneity between study populations was anticipated, therefore a decision was made to pool studies using random effects meta-analysis. A fixed effect model was included as a sensitivity analysis. Where required, standard deviations were calculated from standard errors or CIs presented within papers, and for one study imputed missing standard deviations from matching studies were used according to Cochrane Handbook methods.20 Heterogeneity was quantified using the I2 statistic and the χ2 test of heterogeneity. Heterogeneity was formally explored in stratified analysis by overall risk of bias assessment and by study population. Where possible, study results were pooled separately by subject age and sex subgroups. Small study bias was assessed by visual inspection of Funnel plots, and tested using the method of Egger et al.23,24
RESULTS
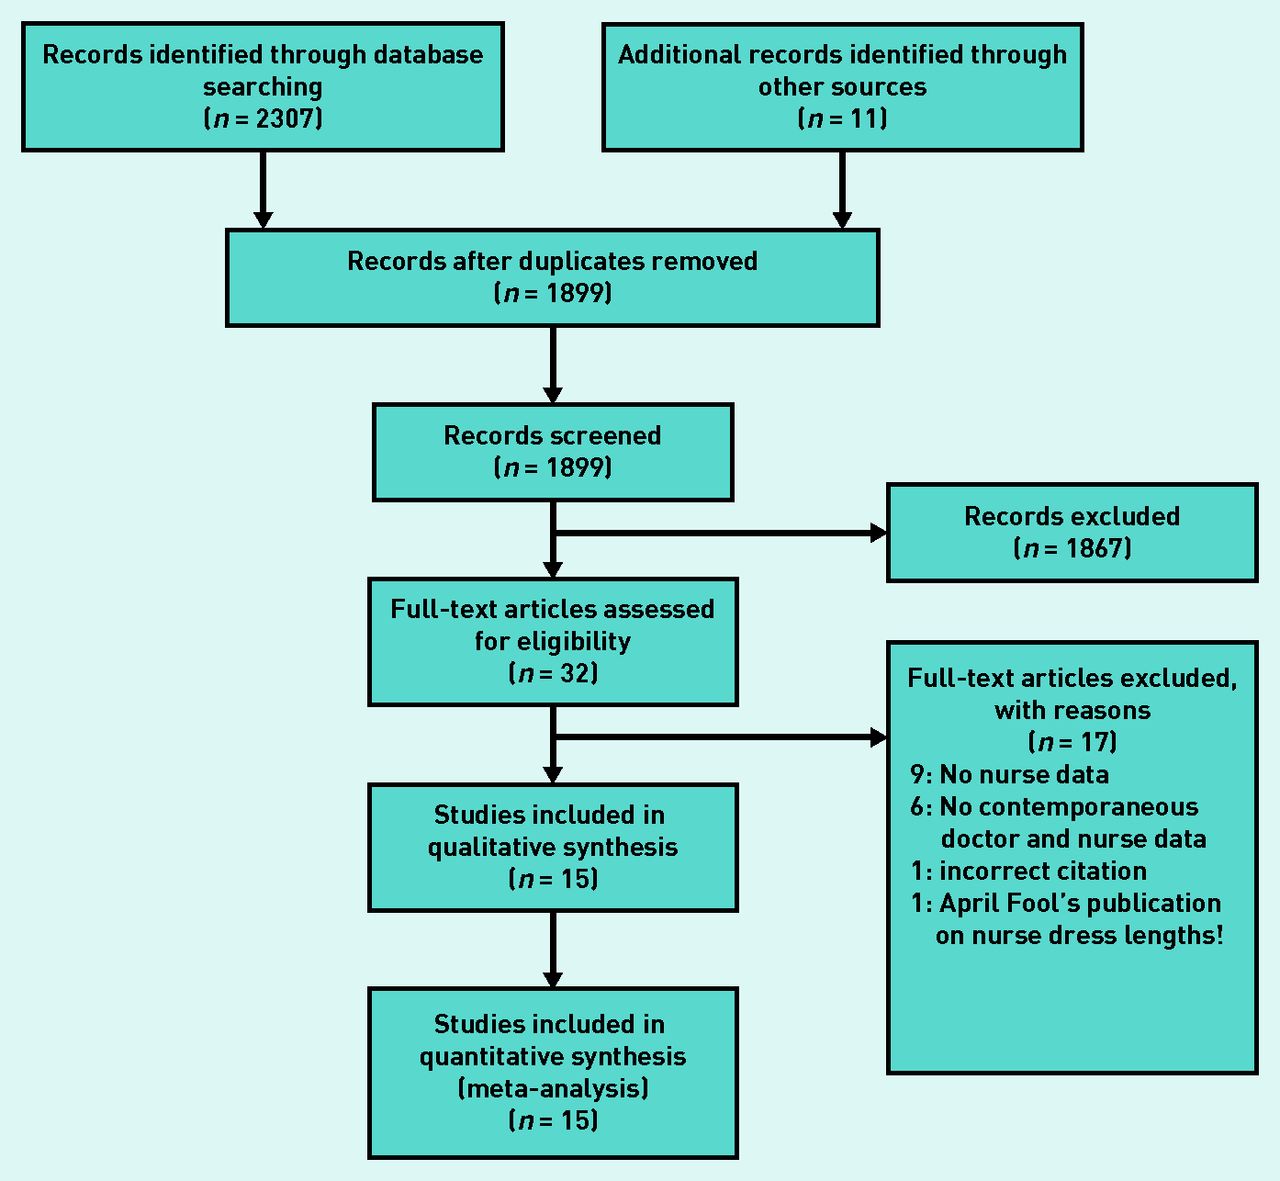
Searches identified 1899 unique potential citations and 11 were identified through other sources, 32 were selected for full text assessment, and 15 contributed data to meta-analyses (Figure 1).

Flow chart of review.
Included studies
Characteristics of included studies are described in Table 1. Eleven studies recruited hypertensive subjects from primary health care25,26 or secondary care clinic settings;27–35 others recruited a combination of normotensive and hypertensive subjects.36–39 Studies excluded after assessment are available from the authors on request.
Characteristics of included studies
Risk of bias in included studies
Most studies used mercury sphygmomanometers;26,27,28–31,33,37–40 three used random zero machines;27,30,31 three used automated sphygmomanometers;32,34,35 and one study averaged mercury and automated readings.25 Methods were not stated for one study,36 and two adopted different measurement methods for doctors and nurses.32,35 Lack of clear blinding of doctors and nurses to readings by each other was a concern for all but three studies.29,32,33 Summary risk of bias judgments were low for seven studies,25–27,30,31,33,34 and high for the remainder (Table 1).28,29,32,35–39
Differences in blood pressure measurements
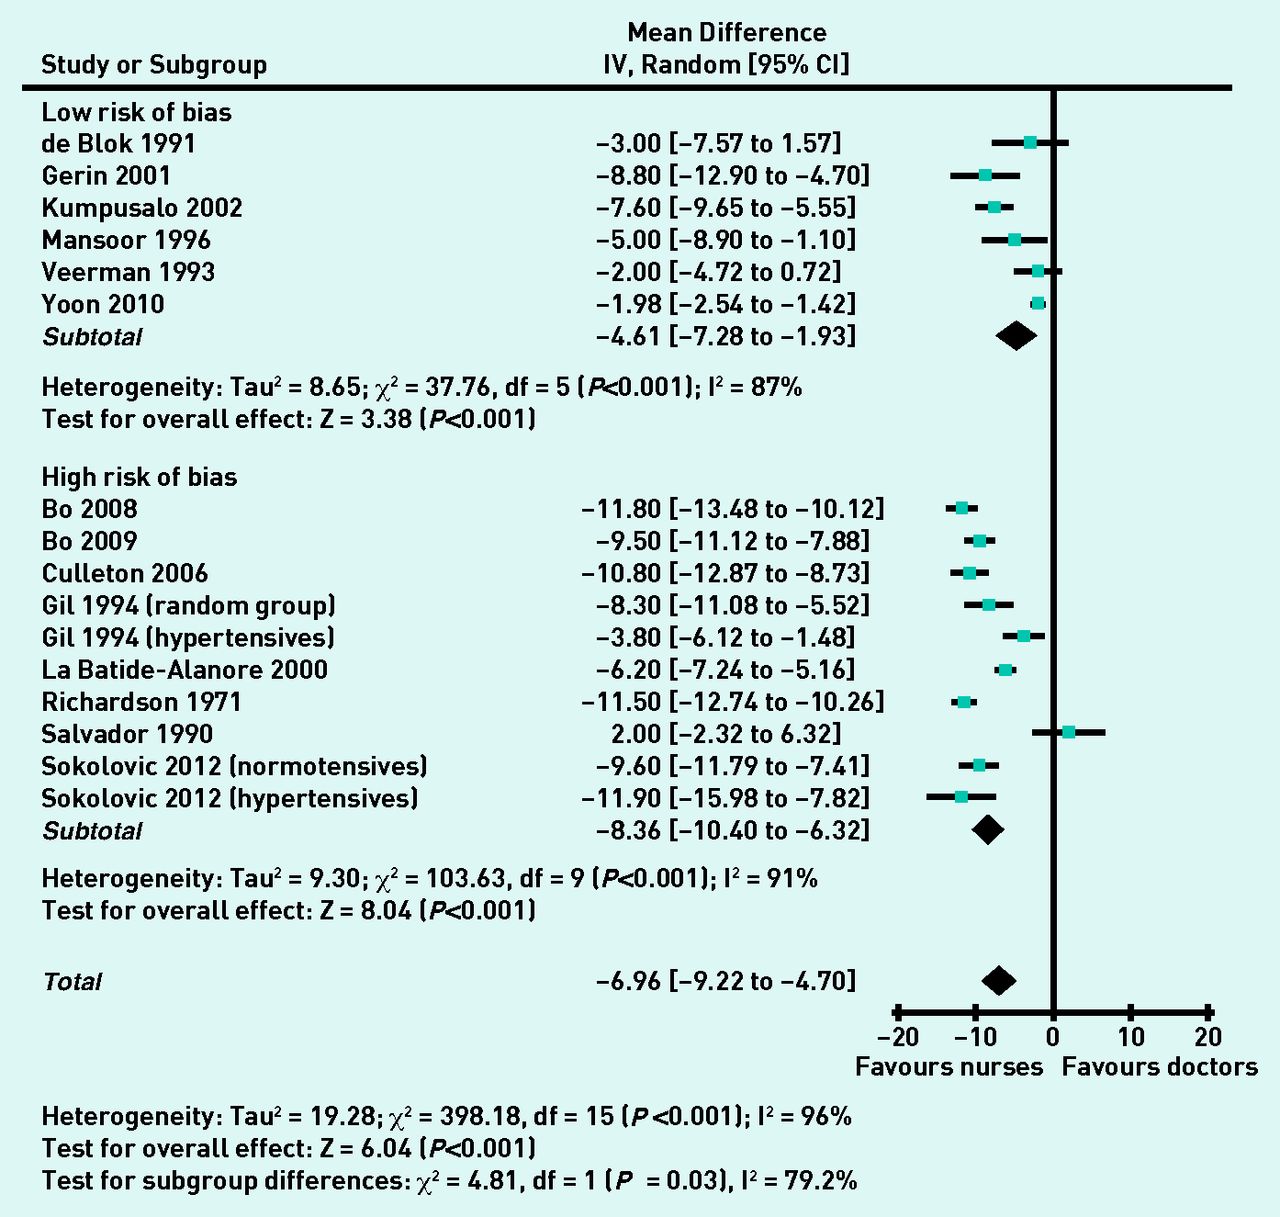
Differences in blood pressures measured by doctors and nurses could be pooled for 16 cohorts from 14 studies. Overall systolic measurements by nurses were −7.0 (95% CI = −4.7 to −9.2) mmHg lower than those by doctors; diastolic measurements were −3.8 (95% CI = −2.2 to −5.4) mmHg lower. Pooled differences for studies at low risk of bias25,27,30,31,33,34 were significantly lower than for studies at high risk of bias28,29,32,35–39 for systolic readings: −4.6 (95% CI = −1.9 to −7.3) versus −8.4 (95% CI = −6.3 to −10.4; P = 0.03; Figure 2), and for diastolic readings: −1.7 (95% CI = −0.1 to −3.2) versus −5.0 (95% CI = −3.4 to −6.5; P = 0.003; Figure 3). Considerable heterogeneity existed between studies (I2 statistic >50%) that was not explained by individual outlying studies. However, directions of differences across studies were uniform, and inferences from re-analysis using fixed effect meta-analysis were unchanged (Table 2).

Differences in systolic pressure (mmHg) measurements for doctors and nurses.

Differences in diastolic pressure (mmHg) measurements for doctors and nurses.
Comparison of random effects and fixed effect findings for primary outcomes
Prevalence of white coat hypertension
Four studies reported prevalence of white coat hypertension.26,29,38,39 Pooled prevalences for doctors’ and nurses’ clinic measurements suggested a relative risk of 1.6 (95% CI = 1.2 to 2.1) for diagnosis of white coat hypertension based on doctors’ clinic measurements compared with those of nurses. Heterogeneity between studies was explained by the one small study (n = 65) at low risk of bias,27 which did not demonstrate a significant difference (RR 0.8 [95% CI = 0.4 to 1.4]) in contrast with the studies at high risk of bias (RR 1.7 [95% CI =1.5 to 2.0]; P = 0.04).38,39,41
Stratification by overall risk of bias and hypertension/normotension
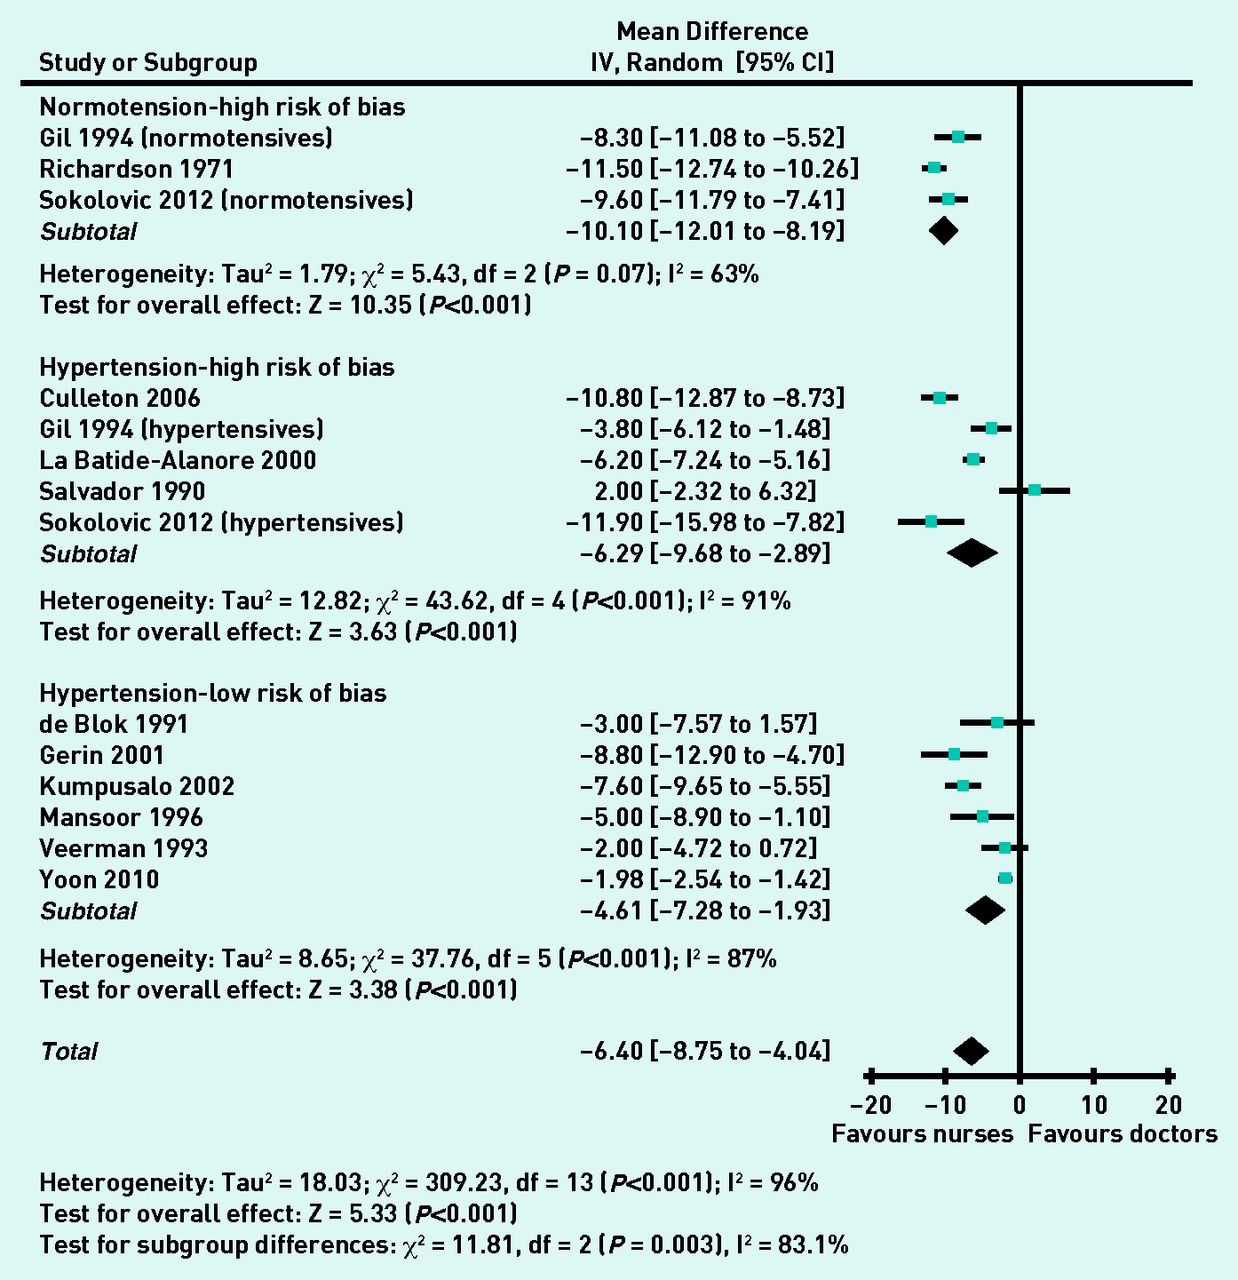
Three studies, all at high risk of bias, included normotensive cohorts.28,36,37 Pooled systolic blood pressures were −10.1 (95% CI = −8.2 to −12.0) mmHg lower for nurses compared with doctors. Eleven cohorts (nine studies)25,27,29–35 recruited hypertensive cohorts and pooled systolic blood pressure differences were −5.4 (95% CI = −3.2 to −7.6) mmHg lower for nurses compared with doctors, with no difference between the high and low risk of bias subgroups. The difference for the normotensive subgroup was greater than for the hypertensive subgroups; sensitivity analysis according to risk of bias did not alter this finding (Figure 4). For diastolic differences the comparable values were normotensive: −3.8 (95% CI = −2.4 to −5.2) mmHg lower and hypertensive: −3.8 (95% CI = −1.3 to −6.3) mmHg lower overall for nurses and −1.7 (95% CI = −0.1 to −3.2) for studies at low risk of bias. Two studies were judged as being at high risk of bias because of different blood pressure measurement protocols for doctors and nurses.32,35 Sensitivity analyses showed no effect on the above findings on excluding these two studies from the analyses.

Systolic BP differences (mmHg) for normotensive and hypertensive cohorts.
Subgroup analyses
Data for three cohorts (two studies) were broken down by sex. Doctor-recorded systolic and diastolic pressures were 2.9 (95% CI = 1.3 to 4.6) mmHg and 1.4 (95% CI = 0.1 to 2.8) mmHg higher than nurse-recorded pressures for female subjects compared with males. There was no significant heterogeneity between the studies, one of which was at high risk of bias,32 the other at low risk.25 Mean age of participants for individual studies ranged from 43 to 73 years.30,39 Sensitivity analysis did not demonstrate any age-related influence on the magnitude of difference in white coat effect.
One study reported lower white coat effects in African–American patients when assessed by African–American doctors than by white doctors; no comparative data was found on ethnicity for doctors and nurses.29
Small study bias
No substantive funnel plot asymmetry was observed (available from the authors on request) and Egger’s tests were not significant for either systolic (P = 0.083) or diastolic (P = 0.332) differences in blood pressure measurements between doctors and nurses, suggesting no strong evidence of small study effects or publication bias.
DISCUSSION
Summary
This review shows that systolic and diastolic blood pressure measurements made by nurses are systematically lower compared with doctors’ measurements. A difference is seen with or without hypertension, but is smaller when risk of study bias is accounted for. Differences in these measurements appear to be greater for female than for male study participants. Rates of diagnosis for white coat hypertension based on readings made by doctors are higher compared with nurses.
Strengths and limitations
This is the first systematic review to assess the different effects of doctors and nurses on blood pressure measurement. The aim was to minimise bias and confounding caused by blood pressure variation by excluding studies where doctors’ and nurses’ measurements were not collected contemporaneously.2,8,42–45 The text word search strategy was deliberately simple and designed to be inclusive; however, ‘white coat’ has other clinical connotations such as physician attire or infection control, thus large numbers of citations had to be excluded on initial screening of titles and abstracts. The strategy risked omitting studies employing synonyms for white coat hypertension or effects, therefore extensive hand searching was undertaken to explore this. The small number of additional citations identified through this process (11 out of 1899) suggests that the searches were adequate. Relevant other data from baseline analyses of longitudinal studies not designed to study white coat effects may exist; however, none have been identified in the numerous (almost 200) studies assessed for previous and current intervention reviews of nurse and allied health professional-led hypertension care.12,13,18 Searches for unpublished data were not undertaken; however, no substantive evidence was found of small study or publication bias.23,24,46 No language restrictions applied; included studies reported a range of clinic settings in 10 countries, therefore it is believed that these results can be generalised to any healthcare setting where adult blood pressures are measured. Study selections were checked and agreed by a second author; independent selection by both authors is preferable but was precluded by available resources.
A conservative selection approach was used to minimise erroneous exclusion of potentially relevant studies. Heterogeneity observed between studies for the primary outcomes was not fully explained within the sensitivity analyses. Residual heterogeneity is not uncommon in meta-analyses of observational studies;46 and may reflect the diversity of study populations and settings. Only one study reported lower blood pressures measured by doctors than nurses for each outcome,33,35 Re-analysis using a fixed effect model did not alter the inference of the present findings.
Comparison with existing literature
Different effects of doctors and nurses on the alerting rise in blood pressure have been previously reported,2,47 but not acknowledged as a confounding variable in studies of nurse-led care.11–13,48 The magnitude of difference in blood pressure readings demonstrated here is similar to the improvements in blood pressure that this and other research groups have previously attributed to nurse-led care.11–13 Therefore, it is believed that some caution is needed in interpretation of previous studies reporting outcome blood pressure measurements made by doctors and nurses, as opposed to independently assessed blood pressure outcomes.
Previous studies have associated an increased prevalence of white coat hypertension with female sex,4,49,50 particularly when measured by a male.6,51 This review also associated larger white coat effects with female than with male subjects, although the data did not allow unravelling of the interplay between sex of clinician and patient. Recent work on the physiology of alerting response has demonstrated reduced pressor and tachycardic responses to nurses’ blood pressure measurements in comparison with doctors and attenuated adrenergic responses for nurses.52
Older age has also been associated with an increased prevalence of white coat hypertension;4,6,50 however, essential hypertension is also a condition of older age.53 White coat effect is correlated with higher systolic clinic blood pressures and declining renal function; both also features of ageing.54 No significant trend was found towards higher differences of white coat effect with older age groups. White ethnicity may also be associated with white coat effects;54 however, this review did not identify sufficient data from different ethnic backgrounds to answer this question.
Greater differences were observed between doctors’ and nurses’ readings where study risk of bias was high. Inaccuracies in blood pressure measurement technique are associated with overestimation of white coat effect,29 and adequate randomisation and blinding in blood pressure studies is important in minimising overestimation of effect sizes.55,56
Implications for research and practice
These results suggest that future studies comparing doctor and nurse-led care require an independent outcome assessment to avoid bias caused by a differential white coat effect; this aspect of methodology must be assessed when considering risk of bias.18 Thorough reporting of the protocol for blood pressure measurement for all future publications on hypertension would facilitate this. It is believed that recent guidance regarding the use of ambulatory and automated measurement of blood pressure is likely to improve reliability and consistency of diagnosis of hypertension.57 Further studies are required to fully assess the effects and interaction of clinician and patient sex and ethnic group, and to clarify the independent effect of age on white coat effects.
Nurses’ blood pressure readings are better predictors of early target organ damage in hypertension than doctors’ readings,58 but they do not eliminate the white coat effect compared with home or ambulatory readings.27,31,38,39,42,43 Automated office blood pressure readings may yield readings lower than those obtained in the presence of health professionals by reducing (but not abolishing) white coat effects.59–61 The setting for blood pressure measurement also contributes to the effect,13 as observed in other community settings such as pharmacies.62
Most modern studies on treating hypertension use nurses or ‘trained observers’ to measure blood pressure, and guidelines are based on evidence from such studies.16 Careful use of protocols by trained research staff results in manual blood pressure measurements that correlate much better with ambulatory readings than doctors’measurements.63 Therefore, the relevance of doctors’ measurements to evidence- or guideline-based treatment decisions has been questioned,16,64 and their value debated.16,57,65 Nevertheless, current UK guidelines advocate clinic measurements (by doctors or other healthcare professionals) for monitoring of hypertension, unless white coat hypertension is diagnosed,66 introducing an inherent risk of bias in the light of these findings.
New 2013 European guidelines also still regard office blood pressure measurement as the ‘gold standard’ for screening, diagnosis, and managing hypertension.67 Although the UK 2011 guidelines promote use of home or ambulatory blood pressure readings for diagnosis, entry to the diagnostic pathway for hypertension relies initially on surgery-based readings, thus the risk of misclassification and inappropriate treatment with inaccurate initial blood pressure readings45 remains a clinical concern if doctors are systematically recording higher blood pressures than nurses.68 Little proposed a decade ago that ‘It is time to stop using high blood pressure readings documented by GPs to make treatment decisions’;69 the present findings support this statement.
Acknowledgments
We wish to thank Mrs Joy Choules, and the staff of Exeter Medical Library, for their assistance in obtaining the full text papers for this review. The protocol for this review is registered with the PROSPERO database; record no: CRD42012002677: http://www.crd.york.ac.uk/PROSPERO/display_record.asp?ID=CRD42012002677.
Notes
Funding
We acknowledge funding from the National Institute for Health Research Peninsula Collaboration for Leadership in Applied Health Research and Care (PenCLAHRC), NHS Cambridgeshire (research capability funding), and the South West General Practice Trust. The views and opinions expressed in this paper are those of the authors and not necessarily those of the NHS, the NIHR or the Department of Health.
Ethical approval
Not applicable.
Provenance
Freely submitted; externally peer reviewed.
Competing interests
The authors have declared no competing interests.
Discuss this article
Contribute and read comments about this article: www.bjgp.org/letters
- Received October 17, 2013.
- Revision received November 11, 2013.
- Accepted December 20, 2013.
- © British Journal of General Practice 2014
REFERENCES
In this issue


Jump to section
More in this TOC Section
Related Articles
Cited By...

