


Article Figures & Data
Figures
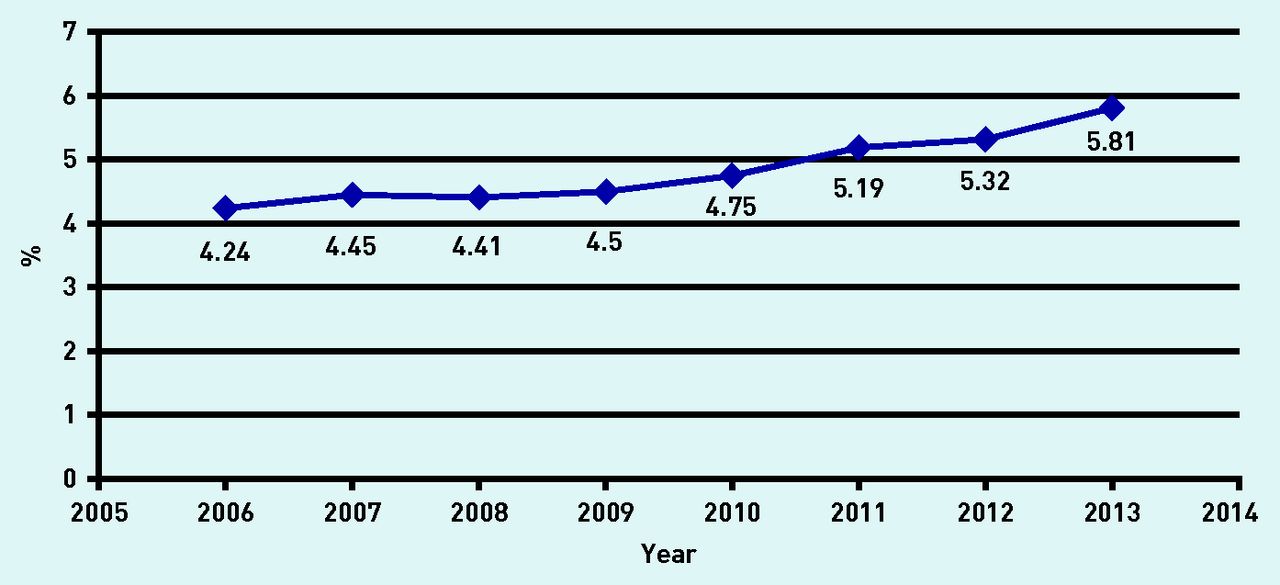
- Figure 1.
Patients aged 15–70 years who underwent a screening test for HIV between 2006 and 2013: unadjusted HIV screening rates.
- Figure 2.
Trends for HIV screening between 2006 and 2013. HIV screening rates stratified by sex.
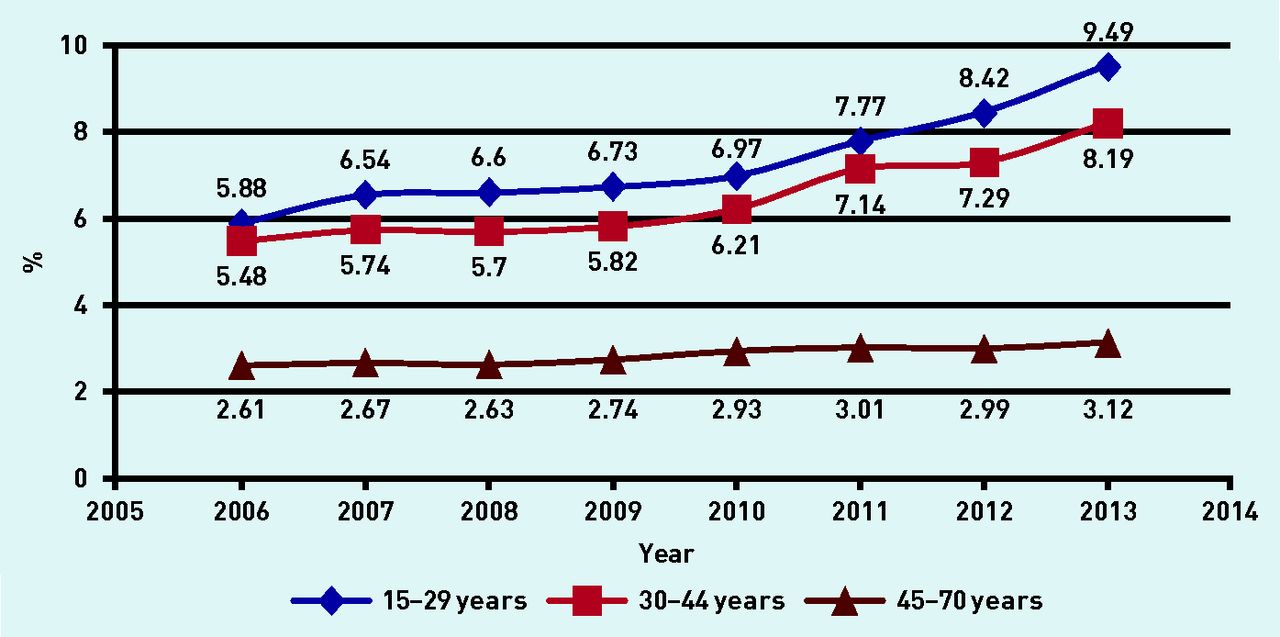
- Figure 3.
Trends for HIV screening between 2006 and 2013. HIV screening rates stratified by age.
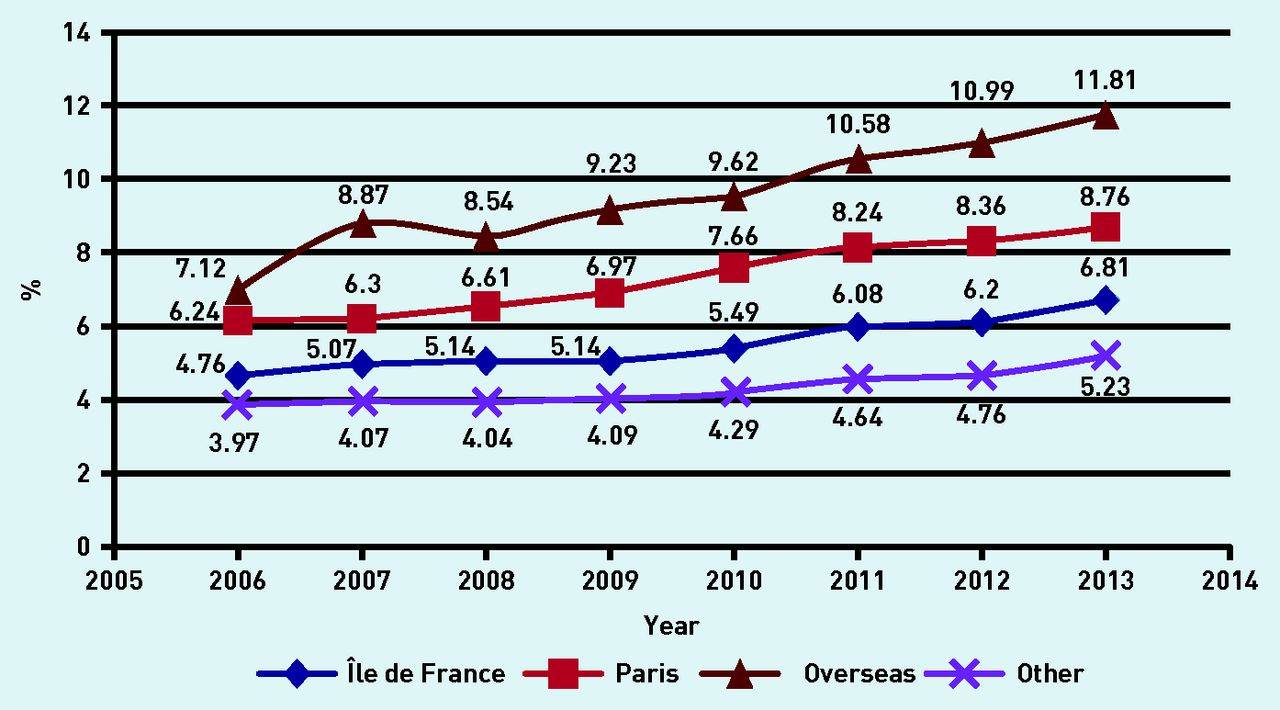
- Figure 4.
Trends for HIV screening between 2006 and 2013. HIV screening rates stratified by region.
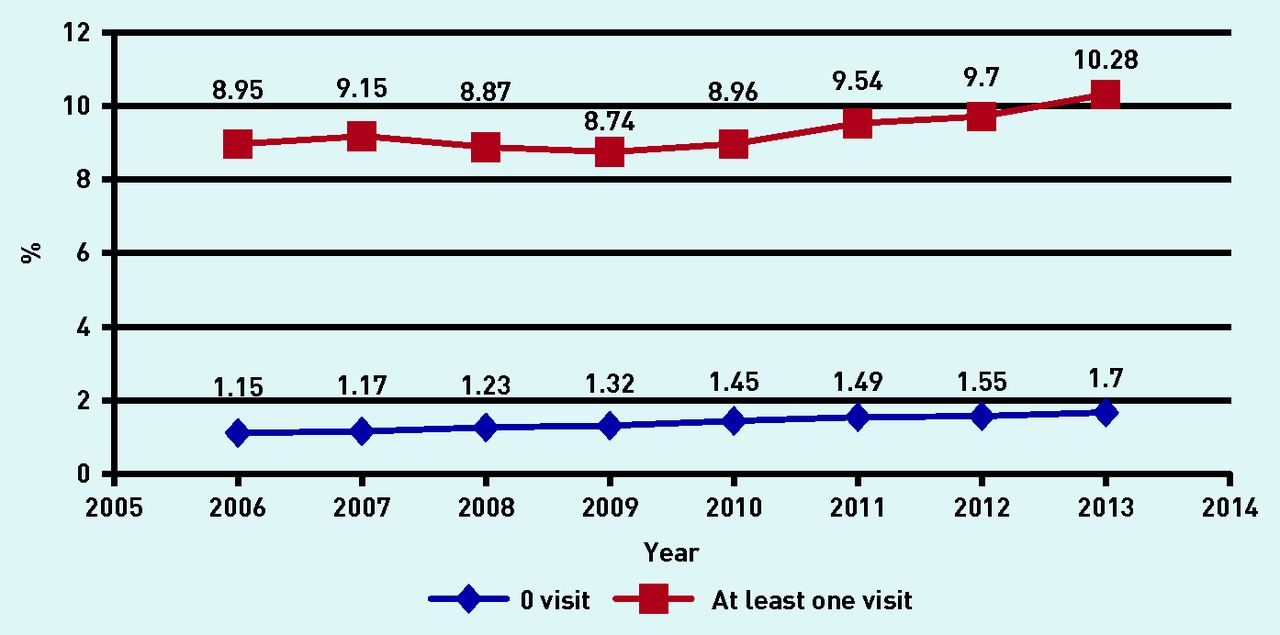
- Figure 5.
Trends for HIV screening between 2006 and 2013. HIV screening rates stratified by number of GP visits.
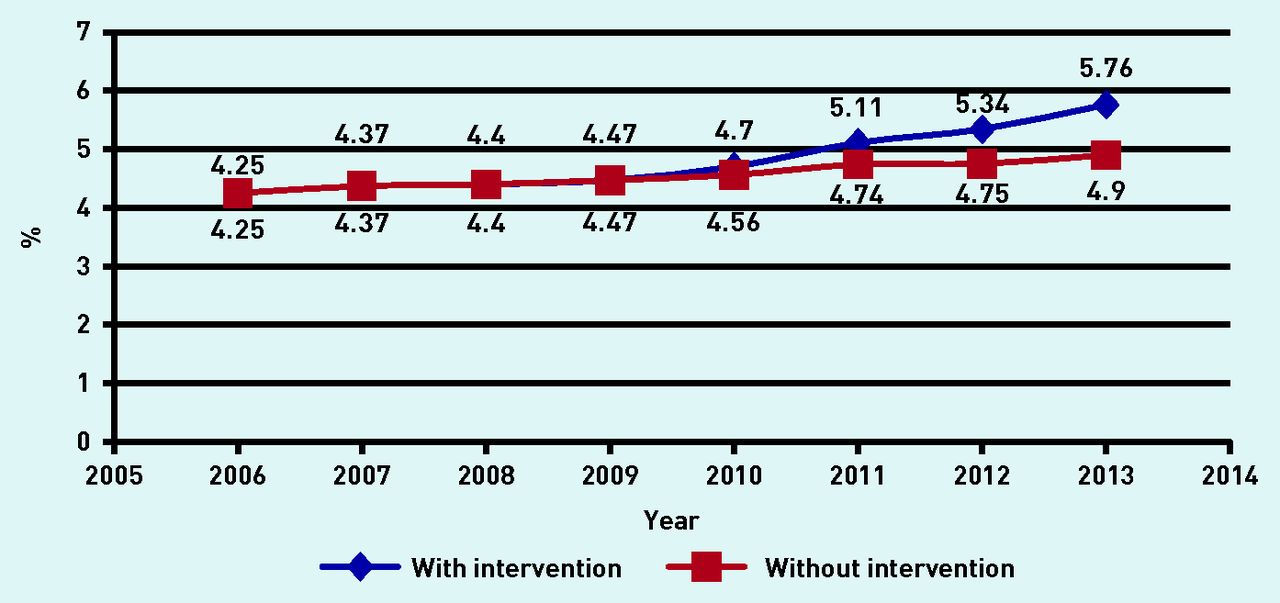
- Figure 6.
Simulated probabilities of HIV screening between 2006 and 2013, with and without policy intervention. Simulated probabilities of HIV screening overall.
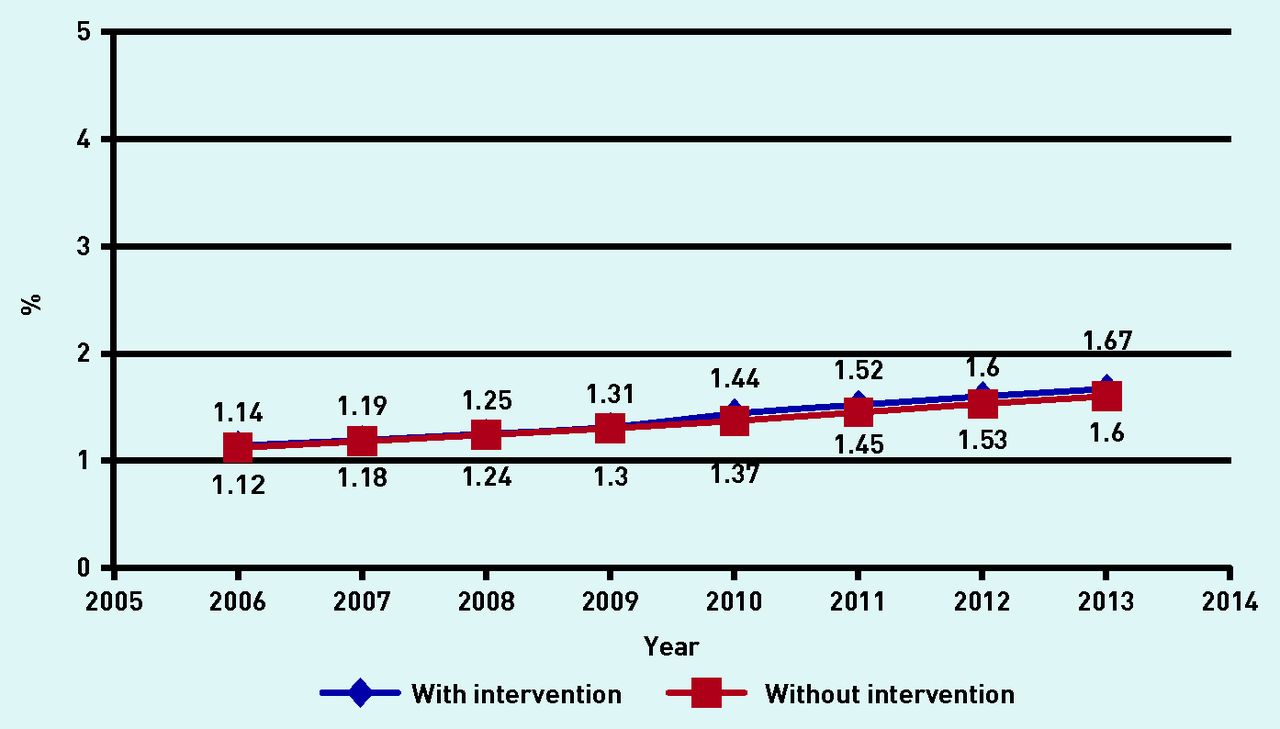
- Figure 7.
Simulated probabilities of HIV screening between 2006 and 2013, with and without policy intervention. Simulated probabilities of HIV screening when GP visits = 0.
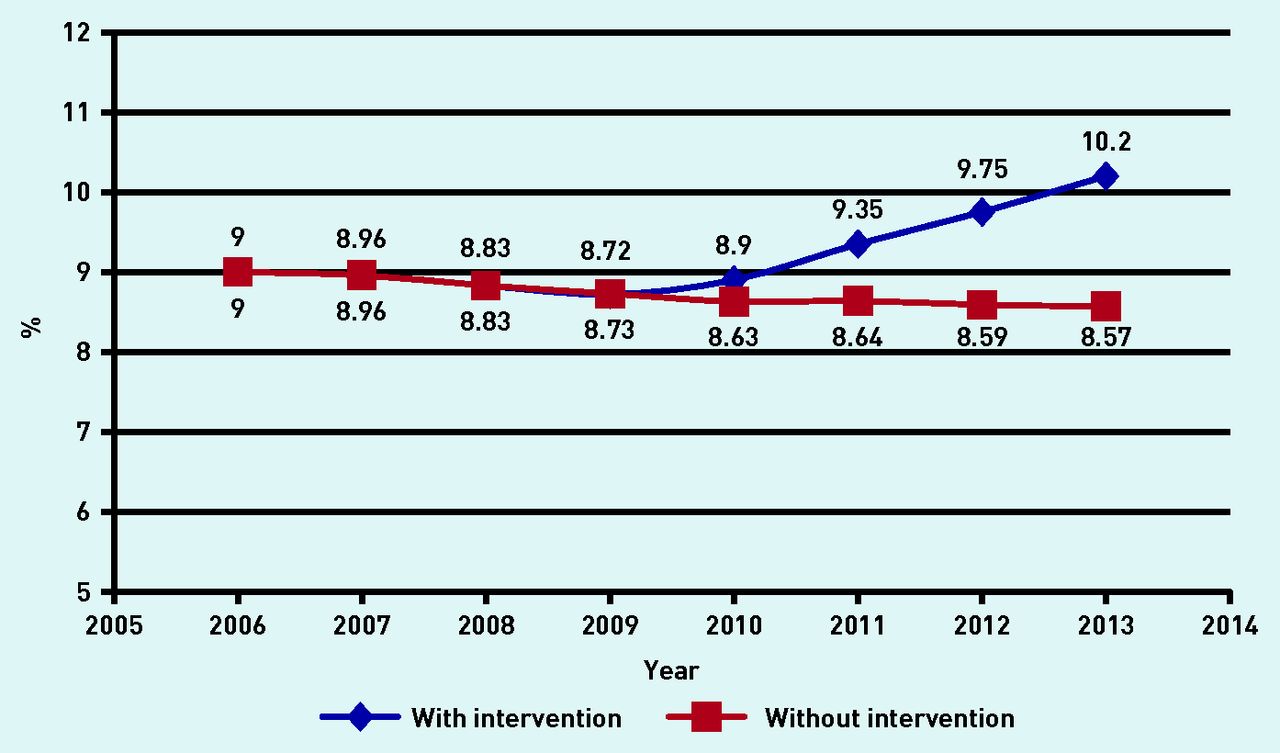
- Figure 8.
Simulated probabilities of HIV screening between 2006 and 2013, with and without policy intervention. Simulated probabilities of HIV screening when GP visits ≥1.


Tables
Year 2006 2007 2008 2009 2010 2011 2012 2013 2006–2013 N % N % N % N % N % N % N % N % N % Sex Male 131 596 49.5 130 940 49.6 132 818 49.7 133 633 49.6 137 567 49.4 135 458 49.0 135 614 48.9 135 178 48.8 1 072 804 49.3 Female 134 513 50.6 132 868 50.4 134 710 50.4 135 826 50.4 141 096 50.6 140 849 51.0 141 948 51.1 142 027 51.2 1 103 837 50.7 Age group, years 15–29 55 072 20.7 54 507 20.7 56 319 21.1 56 792 21.1 61 170 22.0 61 268 22.2 61 097 22.0 60 199 21.7 466 424 21.4 30–44 88 007 33.1 84 320 32.0 82 337 30.8 79 956 29.7 79 266 28.4 75 145 27.2 73 388 26.4 71 229 25.7 633 648 29.1 45–70 123 030 46.2 124 981 47.4 128 873 48.2 132 712 49.3 138 229 49.6 139 896 50.6 143 077 51.6 145 777 52.6 1 076 575 49.5 Region Île de France 37 997 14.3 38 073 14.4 38 762 14.5 39 246 14.6 40 838 14.7 41 300 15.0 42 097 15.2 42 652 15.4 320 965 14.8 Paris 8809 3.3 8779 3.3 9019 3.4 9067 3.4 9525 3.4 9712 3.5 9931 3.6 10 089 3.6 74 931 3.4 Overseas 7342 2.8 7347 2.8 7421 2.8 7516 2.8 7813 2.8 7958 2.9 8100 2.9 8193 3.0 61 690 2.8 Other 196 218 73.7 195 898 74.3 198 222 74.1 199 619 74.1 206 708 74.2 207 779 75.2 210 353 75.8 212 380 76.6 1 627 177 74.8 Unknown 15 743 5.9 13 711 5.2 14 105 5.3 14 012 5.2 13 781 5.0 9560 3.5 7081 2.6 3891 1.4 91 884 4.2 GP visit No visits 160 899 60.5 155 427 58.9 156 130 58.4 154 143 57.2 156 444 56.1 149 392 54.1 148 975 53.7 144 569 52.1 1 225 979 56.3 At least one visit 105 210 39.5 108 381 41.1 111 399 41.6 115 317 42.8 122 221 43.9 126 917 45.9 128 597 46.3 132 636 47.9 950 668 43.7 Total 266 109 100 263 808 100 267 529 100 269 460 100 278 665 100 276 309 100 277 572 100 277 205 100 2 176 657 100 ↵a Some of the figures do not add up because of missing data.
Pooled model GP visit = 0 GP visit ≥1 Estimate P-value Estimate P-value Estimate P-value Baseline level (β0) −5.5469 <0.0001 −4.6668 <0.0001 −3.3051 <0.0001 Trend before intervention (β1) 0.0034 0.4200 0.0548 <0.0001 −0.0074 0.1100 Level change after intervention (β2) −0.0138 0.2900 0.0380 0.2200 −0.0207 0.1500 Trend after intervention (β3) 0.0486 <0.0001 −0.0011 0.9300 0.0563 <0.0001 Sex ref = female Male 0.0699 <0.0001 −0.6809 <0.0001 0.2212 <0.0001 Age group, years ref =≥45 15–29 1.6104 <0.0001 0.4975 <0.0001 1.7718 <0.0001 30–44 1.2493 <0.0001 0.6606 <0.0001 1.2887 <0.0001 Geographical location ref = other Île de France 0.2906 <0.0001 0.3785 <0.0001 0.274 <0.0001 Paris 0.6601 <0.0001 0.6922 <0.0001 0.6455 <0.0001 Overseas 0.8226 <0.0001 0.3235 <0.0001 0.9084 <0.0001 GP visit At least one 2.3337 <0.0001 – – – – Year Pooled model GP visit = 0 GP visit ≥1 % 95% CI % 95% CI % 95% CI 2010 3.2 2.9 to 3.6 4.8 4.8 to 4.8 3.3 2.8 to 3.8 2011 8.3 7.3 to 9.4 4.7 4.6 to 4.8 8.7 7.4 to 10.1 2012 13.7 11.8 to 15.5 4.6 4.5 to 4.7 14.4 12.1 to 16.7 2013 19.2 16.5 to 22.0 4.5 4.4 to 4.5 20.4 17.0 to 23.8
In this issue


Jump to section
Keywords
More in this TOC Section
Related Articles
Cited By...

