


Abstract
Background Outcomes of diabetes care are unequal and the NHS has a duty to consider reducing inequality in healthcare outcomes.
Aim To quantify trends in socioeconomic inequality and diabetes outcomes.
Design and setting Whole-population longitudinal study of 32 482 neighbourhoods (Lower Layer Super Output Areas [LSOAs]) in England between 2004/2005 and 2011/2012.
Method Slope indices of inequality (SIIs) between neighbourhoods of great and little deprivation were measured annually for: glycated haemoglobin control in people with diabetes; emergency hospitalisation for diabetes; and amenable mortality from diabetes.
Results From 2004/2005 to 2011/2012 glycaemic control improved in all social groups, regardless of deprivation level, although inequality was unchanged as measured by the SII (0.04, 95% confidence interval [CI] = −0.43 to 0.52). Diabetes-related amenable mortality improved in all social groups, but decreased at a faster rate in neighbourhoods of greater deprivation. Inequality in diabetes-related amenable mortality improved, with the SII falling by 2.68 (95% CI = 1.93 to 3.43), resulting in 594 (95% CI = 420 to 767) fewer deaths. In contrast, emergency hospitalisations for diabetes increased in all social groups, with faster growth in neighbourhoods of greater deprivation. The socioeconomic gradient increased with the SII widening by 19.59 admissions for diabetes per 100 000 (95% CI = 16.00 to 23.17), resulting in an increase of 5991 (95% CI = 5084 to 6899) excess admissions associated with socioeconomic inequality during the study period.
Conclusion In diabetes, mortality declined faster, but emergency hospitalisation grew faster in more deprived neighbourhoods. Unequal growth in emergency hospitalisation for diabetes is likely to be partly due to increased diabetes prevalence and patients living longer, but may also be due to overuse of glycaemic control medication.
- diabetes mellitus
- emergency medicine
- mortality
- patient admission
- quality of health care
- socioeconomic factors
INTRODUCTION
In 2013, 2.7 million adults aged >17 years were diagnosed with diabetes in the UK.1 Of these, 10% had type 1 diabetes;2 90% had type 2 diabetes, which is more likely to be influenced by lifestyle factors.3 Type 2 diabetes is socially patterned, with prevalence approximately 50% higher in the quintile group with the greatest deprivation, compared with that with the least deprivation.4 Both types of diabetes have potentially serious complications, decreasing both quality and length of life.3
In 2009–2010, the NHS in England spent £3.9 billion on diabetes services — approximately 4% of the NHS budget.5 One important aspect of diabetes management is the control of glycated haemoglobin (HbA1c) levels, which reduces the risk of complications, hospitalisation, and mortality, and thereby the costs of care.6
In 2003, the UK government made reducing health inequality a key priority of national health policy.7,8 This was supported by major investments:
the Quality and Outcomes Framework (QOF) pay-for-performance programme was introduced in 2004.9 This contains financial incentives for achieving clinical targets in controlling glycaemia, cholesterol levels, and blood pressure, and for recording retinal screening, foot examination, neuropathy testing, and urine examination for microalbuminuria.
the Equitable Access to Primary Medical Care programme, rolled out in 2008, invested £250 million in the 25% most under-doctored primary care trusts (PCTs), providing more than 100 new general practices and an additional GP-led health centre in each PCT.10,11
targeted support was developed for effective primary care interventions for chronic conditions, including diabetes, in disadvantaged adults from 2007 until 2009.12
In 2012, the Health and Social Care Act gave the NHS an explicit duty to consider reducing inequalities in healthcare outcomes. In this study, NHS equity performance at tackling inequalities in diabetes outcomes during this key period was examined.
METHOD
Three indicators to track socioeconomic inequality in relation to diabetes outcomes along the patient pathway were developed using an iterative process involving the general public, public health experts, and NHS experts, including those from primary and secondary care:8
the achievement of good glycaemic control;
preventable emergency hospitalisation for diabetes; and
amenable mortality from diabetes-related causes.
Glycaemic control
The number of people achieving the lower HbA1c target threshold from the QOF was compared with the number of people registered as having diabetes at GP practice level. The threshold has changed on various occasions since the inception of the QOF in 2004/2005 (Table 1), so the relevant threshold for each period was used.
Quality and Outcomes Framework thresholds for glycated haemoglobin (HbA1c) level9
How this fits in
More than 2.7 million adults in the UK had a diagnosis of diabetes in 2013; 90% of these diagnoses were for type 2 diabetes. Type 2 diabetes is socially patterned, with prevalence being 50% higher in the quintile of the population with the greatest levels of deprivation compared with the quintile of least deprivation. The research presented here found that diabetes-related amenable mortality rates decreased at a faster rate in neighbourhoods of greatest deprivation than in areas of least deprivation between 2004/2005 and 2011/2012; in these areas, however, inequalities in emergency hospitalisations for diabetes complications increased at a faster rate. Inequalities in glycaemic control were unchanged.
QOF achievement data, which were available at GP practice level, formed the starting point. The NHS Attribution Data Set of GP-registered populations was then used to attribute glycaemic control data from practice to neighbourhood level using Lower Layer Super Output Areas (LSOAs). Where LSOAs were attributed to more than one practice, a population-weighted average of glycaemic control scores from the relevant practices was used; there was an assumption that the same level of glycaemic control was achieved across all patients within each practice, independent of their LSOA of residence. There are 32 482 LSOAs in England, each comprising 1000–3000 people (minimum 1000, maximum 3000). The Index of Multiple Deprivation 2010 was used to assign deprivation ranks to the LSOAs. Each indicator was calculated at LSOA level for each period (1 April until 31 March the following year) between 2004/2005 and 2011/2012 inclusive.
Emergency hospitalisation
The Hospital Episodes Statistics (HES) dataset provided by the Health and Social Care Information Centre (now NHS Digital) was used, and the number of people per 100 000 population who had ≥1 emergency hospitalisation for diabetes complications that are defined as preventable by the QOF was counted.13 The codes for these complications, as specified in the International Statistical Classification of Diseases and Related Health Problems (10th Revision) (ICD-10), are listed in Box 1. This outcome is available at LSOA level and was indirectly standardised for age and sex at small-area level.
Classification codes for preventable diabetes admissions and deaths considered amenable by the Office for National Statistics
| Complication | ICD-10 code |
|---|---|
| Preventable admissions | E100, E101, E107, E108, E109, E110, E111 E117,E118, E119, E120, E121, E127, E128, E129, E130,E131, E137, E138, E139, E140, E141, E147, E148,E149, E162 |
| Amenable mortality | E10–E14 |
| Code type | Definition |
| ICD-10 codes | E10: Insulin-dependent diabetes mellitus |
| E11: Non-insulin-dependent diabetes mellitus | |
| E12 Malnutrition-related diabetes mellitus | |
| E13: Other specified diabetes mellitus | |
| E14: Unspecified diabetes mellitus | |
| ICD-10 extension | 0: With coma |
| 1: With ketoacidosis | |
| 7: With multiple complications | |
| 8: With unspecified complications | |
| 9: Without complications | |
Amenable mortality
Amenable mortality was defined as the number of deaths in a given year, per 100 000 population aged <75 years, from diabetes-related causes considered amenable to health care by the Office for National Statistics (ONS) (primary cause of death ICD-10 codes E10–E14, Box 1).14 This outcome is available at LSOA level and was indirectly standardised for age and sex at small-area level.
Inequality
Absolute and relative inequality for these indicators was measured using the slope index of inequality (SII) and relative index of inequality (RII) respectively. The SII was computed for each year by estimating an ordinary least squares regression of the LSOA-level indicator value against the LSOA-level deprivation fractional rank (measured on a 0–1 scale, in which 0 is the neighbourhood of least deprivation and 1 is the neighbourhood of greatest deprivation). The RII was calculated by expressing the SII as a proportion of the national mean level of the indicator.
The SII can be interpreted as the modelled difference in event count between the LSOAs of least and greatest deprivation in the country, taking into account the distribution of event counts across the deprivation range. The RII can be interpreted as the proportional gap between the areas of greatest and least deprivation. For emergency hospitalisation and amenable mortality — for which ‘more is worse’ — a positive association implies pro-rich inequality while a negative association implies pro-poor inequality. To facilitate a comparison with the glycaemic control indicator — for which ‘more is better’ — the SII was multiplied by −1 so that a positive sign also indicates pro-rich inequality. The area under the SII line was used to estimate the excess number of people experiencing the outcome measured by the indicator associated with socioeconomic inequality — the real inequality gap. The assumption was that the level of the outcome observed in the area of least deprivation was the optimal level for that outcome — anything above this level for negative outcomes and below it for positive outcomes represented the excess associated with socioeconomic inequality.
Linear regression models were computed using pooled data for the first and last years, including interaction terms between year and deprivation, to determine the magnitude and statistical significance of changes in inequality between the beginning and end of the analysis period. All statistical analysis was carried out using R (version 3.2.3).
RESULTS
In 2004/2005 there were substantial socioeconomic gradients in both amenable mortality (Figure 1) and preventable hospitalisation for diabetes (Figure 2), and a smaller socioeconomic gradient in glycaemic control (Figure 3), with outcomes less favourable in neighbourhoods of greater deprivation.

Mortality rates, 2004/2005, by level of deprivation.
The black dots show deprivation decile groups of neighbourhoods (approximately 3200 neighbourhoods per dot); the solid black line shows a linear regression through all 32 482 neighbourhoods; the shaded area shows the inequality gap; and the dashed red line shows the national average level for the indicator. Inverted axis on primary care quality to ease comparisons with other indicators, where decreasing implies improvement.
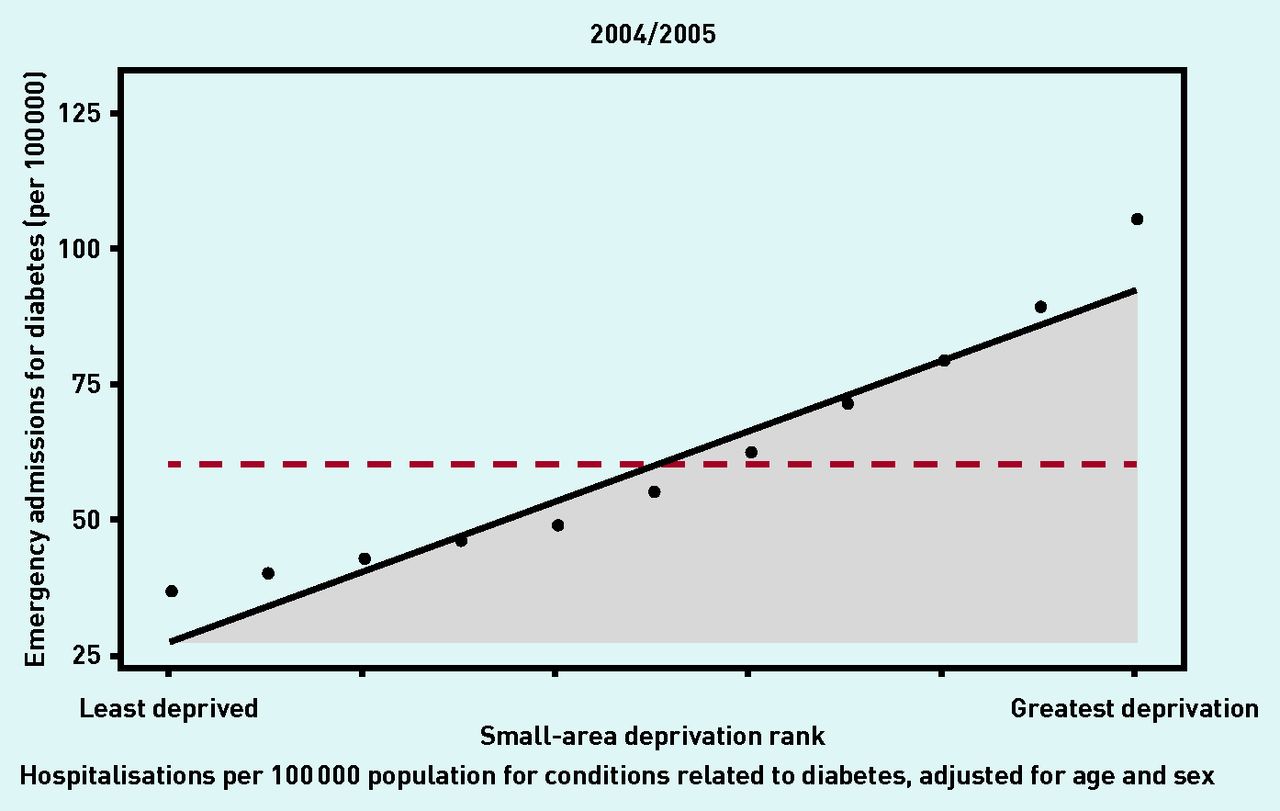
Emergency hospitalisation rates, 2004/2005, by level of deprivation.
Inverted axis on primary care quality to ease comparisons with other indicators, where decreasing implies improvement (IMD, Index of Multiple Deprivation).
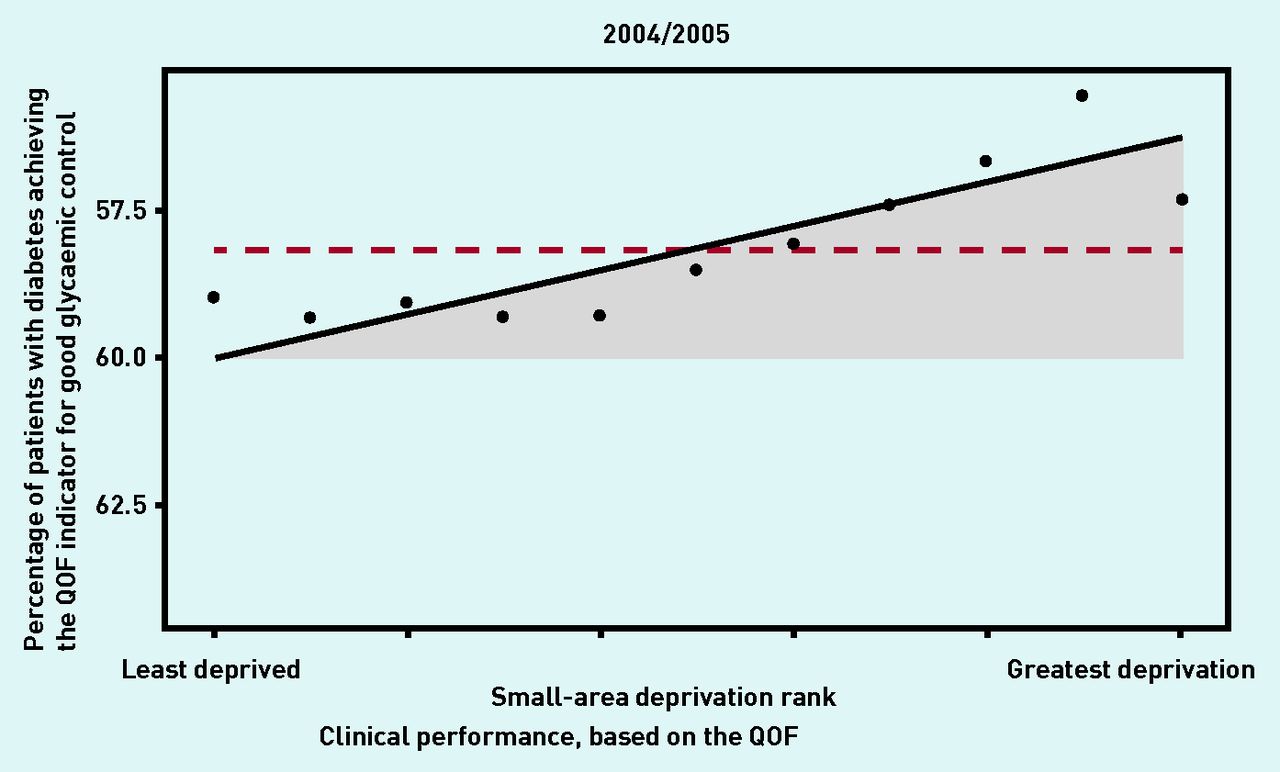
Care quality, 2004/2005, by level of deprivation.
Care quality is represented by achievement of good glycaemic control in patients with diabetes. Inverted axis on primary care quality to ease comparisons with other indicators, where decreasing implies improvement. QOF = Quality and Outcomes Framework.
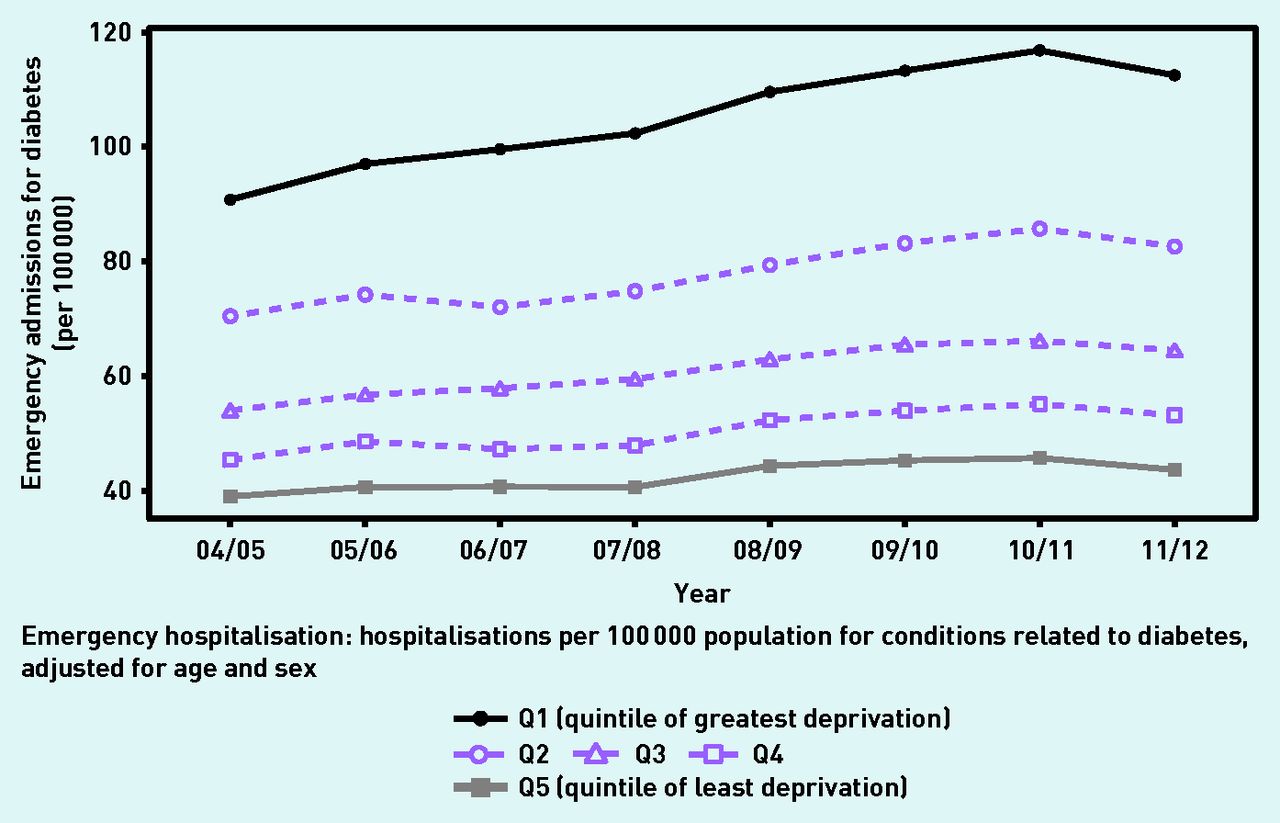
Figures 4⇓–6 display the trends from 2004/2005 to 2011/2012, comparing the quintile groups of greatest deprivation (Q1) and least deprivation (Q5) of LSOAs in England. By 2011/2012, substantial inequalities still remained and were associated with a deficit of 1.90 percentage points (95% confidence interval [CI] = 1.74 to 2.06) in diabetes-related primary care quality, 22 189 (95% CI = 21 498 to 22 881) excess preventable hospitalisations for diabetes-related causes, and 582 (95% CI = 478 to 687) excess avoidable deaths due to diabetes-related causes (Table 2).

Emergency hospitalisation 2004/2005 to 2011/2012, by level of deprivation.
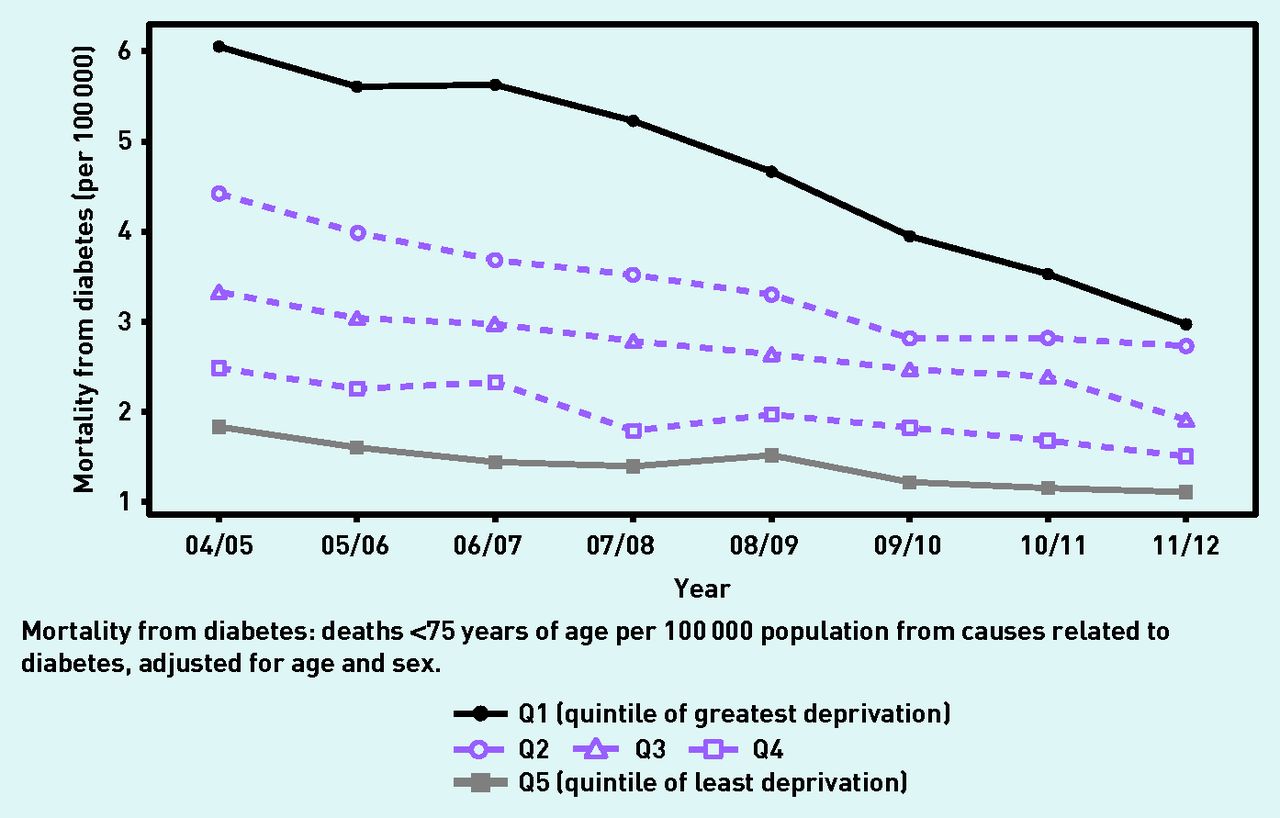
Mortality rates 2004/2005 to 2011/2012, by level of deprivation.

Quality of diabetes-related primary care, 2004/05 to 2011/12, by level of deprivation. Inverted axis on diabetes primary care quality to ease comparisons with other indicators, where decreasing implies improvement. QOF = Quality and Outcomes Framework.
Socioeconomic healthcare inequalities in England, comparing 2004/2005 with 2011/2012a
In 2004/2005, mean glycaemic control performance in England was 58.64% (95% CI = 58.63 to 68.64). The SII was 3.76 (95% CI = 3.40 to 4.11), indicating that patients living in areas of greatest deprivation are nearly four percentage points less likely to achieve good glycaemic control than patients living in areas of least deprivation (Table 2). Between 2004/2005 and 2011/2012 there was an improvement in mean glycaemic control performance of 3.72 percentage points (95% CI = 3.72 to 3.72) (Table 2). However, inequality in glycaemic control was unchanged over the period according to both absolute and relative indices of inequality (SII difference 0.04, 95% CI = −0.43 to 0.52) (Table 2).
There was an improvement in primary care quality between 2010/2011 and 2011/2012 (Figure 6); this could be the result of that year’s change in the HbA1C target from <7 to <7.5%.
In 2004/2005 the mean rate of preventable hospitalisation for diabetes was 59.84 (95% CI = 59.83 to 59.85) admissions per 100 000 population; between 2004/2005 and 2011/2012 this increased by 11.4 (95% CI = 11.38 to 11.41) per 100 000 population (Table 2). The SII was 64.66 (95% CI = 62.22 to 67.11), and socioeconomic inequality was associated with an excess of 16 199 (95% CI = 15 587 to 16 810) admissions (Table 2). The socioeconomic gradient also widened in both absolute and relative terms, with the SII widening by 19.59 admissions for diabetes per 100 000 (95% CI = 16.00 to 23.17); this resulted in an increase in excess admissions associated with socioeconomic inequality of 5991 (95% CI = 5084 to 6899) when compared with rates for 2004/2005. There was a fall in admissions between 2010/2011 and 2011/2012 (Figure 4), which may be the result of change in the HbA1C target from <7 to <7.5% that year, leading to fewer cases of hypoglycaemia.
The largest increases in numbers of admissions between 2004/2005 and 2011/2012 were for unspecified hypoglycaemia (from 7476 to 11 564), type 2 diabetes without complications (from 6662 to 8401), type 1 diabetes with ketoacidosis without coma (from 6271 to 8841), and type 2 diabetes with ketoacidosis (from 1342 to 2278) (Table 3).
Preventable emergency hospitalisation for diabetes
In 2004/2005 the mean rate of amenable mortality from diabetes-related causes was 3.62 (95% CI = 3.57 to 3.67) deaths per 100 000 population (Table 2). The SII was 5.10 (95% CI = 4.49 to 5.71) and socioeconomic inequality was associated with an excess of 1176 (95% CI = 1036 to 1316) deaths (Table 2). The most common causes of preventable mortality in 2004/2005 were unspecified diabetes without complications and unspecified type 2 diabetes with peripheral circulatory complications (Table 4).
Amenable deaths from diabetes
Between 2004/2005 and 2011/2012, average preventable mortality fell by 1.57 (95% CI = 1.49 to 1.65) deaths per 100 000 population (Table 2). Inequality in diabetes mortality, as measured by the SII, also improved, falling by 2.68 (95% CI = 1.93 to 3.43), resulting in 594 (95% CI = 420 to 767) fewer deaths (Table 2). The main sub-categories of preventable mortality reduction were unspecified diabetes without complications, which fell from 810 to 320 deaths, and unspecified diabetes mellitus with peripheral circulatory complications, which fell from 257 to 139 deaths (Table 4). In contrast, there was a rise in deaths in unspecified diabetes with ketoacidosis from 84 to 155 deaths (Table 4).
DISCUSSION
Summary
This is the first study to examine how the NHS performed in reducing socioeconomic inequalities in diabetes outcomes from 2004/2005 to 2011/2012. During this period, healthcare outcomes improved in all social groups for glycaemic control and amenable mortality from diabetes, with larger and faster mortality reductions in areas of greatest deprivation. By contrast, both mean outcomes and inequalities deteriorated in relation to preventable emergency hospitalisation for diabetes-related complications. The fall in diabetes-related amenable mortality is a remarkable achievement, given that diabetes prevalence is rising and the targeting of NHS resources often does not promote health equity.15 This finding is a sign of the NHS’s success in improving the quality of diabetes health care and, more importantly, improving the quality of health care for coronary heart disease and other comorbidities that contribute to diabetes-related mortality.16
In contrast, the growth in emergency admissions for diabetes is worrying. This is explained, in part, by improved disease detection with the recent addition of the HbA1c test to diagnose diabetes, and increasing prevalence of diabetes — prevalence in England rose from 3.3% in 2004/2005 to 5.8% in 2011/2012.17–19 There may also be an ‘unhealthy survivor’ effect, whereby people with diabetes no longer die prematurely but, instead, survive long enough to have additional admissions to hospital for diabetes complications.20
Strengths and limitations
This study used 8 years of data, including outcome data on virtually all individuals with diabetes in England, although the findings are limited to the period of this study. Three important outcomes of diabetes care were examined at different stages of the patient pathway. The study also used both absolute and relative inequality measures based on the entire socioeconomic gradient of all 32 482 LSOAs in England.
There were changes in the definition of the indicator of good glycaemic control over time, especially for the 2 years 2009/2010 and 2010/2011, which complicate the interpretation of trends in this indicator. However, as there is no particular reason to think this would impact on the relative differences between areas of deprivation and affluent neighbourhoods, the RII remains a fairly robust indicator of inequality trends in glycaemic control.
Comparison with existing literature
The findings presented here that show an increase in preventable hospitalisations for diabetes complications concur with, and extend, those of Dusheiko et al who reported an increasing trend in all English GP practices from 2004/2005 to 2006/2007.21 Calderón-Larrañaga et al however, reported a fall in diabetes-related preventable hospitalisation in the years 2004–2009.22 These differences may be explained by the fact that Calderón-Larrañaga et al adjusted the rate of preventable hospitalisation for the prevalence of diabetes, whereas Dusheiko et al adjusted the rate of preventable hospitalisation by population count, age, and sex alone — as has been done in the analysis presented here. Both approaches have their merits as, although diabetes is becoming more common, the increase in prevalence may be overestimated due to better case finding.17
The findings of this study showing an increase in the proportion of patients meeting HbA1c targets are similar to findings from Australia, but contrast with those from the US, where no significant change occurred between 2007 and 2012.23,24 The findings presented here indicating a decrease in diabetes-related amenable mortality are similar to those from the US, but contrast with those from Australia, where mortality rates remained unchanged between 1997 and 2012.24,25 The findings presented here of increased admissions are similar to those from both Australia and the US.24,26
The finding that diabetes-related mortality has fallen is consistent with other UK literature.16 Decreasing mortality rates may be partly due to the increased prescribing of statins in patients with diabetes and more aggressive control of blood pressure, lipid levels, and hyperglycaemia, which has been shown to reduce morbidity and mortality.27
Implications for research and practice
Reducing inequalities in diabetes is likely to require complex interventions to improve the coordination of care between multiple providers both within, and outside of, the healthcare system such as social care. GPs need to be aware of the significant socioeconomic inequalities that exist in diabetes care, and to aim to deliver high-quality care to all patients. The increasing admissions for diabetic ketoacidosis in type 2 diabetes may be a side effect of newer drugs for diabetes.28
It is also possible that overuse of glucose control medication may be leading to an increased number of preventable hospitalisations resulting from hypoglycaemic attacks, which increased by 50% between 2004/2005 and 2011/2012 (Table 3). Data from randomised clinical trials report that intensive glycaemic control immediately increases the risk of severe hypoglycaemia from 1.5-fold to threefold.29
Financial incentives in primary care for reaching HbA1c targets have also increased — from 27 points in 2004/2005 to 35 points in 2011/2012, the target for one indicator has been lowered from HbA1C <10 to HbA1C <9%, and an additional indicator has been introduced with a target of HbA1c <8%. This may increase the risk of hypoglycaemia by overtreatment with medication to achieve these targets.
The causes of the increase in preventable admissions for hypoglycaemia and ketoacidosis in both type 1 and type 2 diabetes, along with increasing inequalities, need further research.30 The National Institute for Health and Care Excellence (NICE) should review the current HbA1C target of 7.0% in light of increasing emergency admissions with hypoglycaemia. In addition, GPs should follow NICE recommendations for patients who have experienced hypoglycaemia and ensure they have an individualised HbA1C target.2 GPs should also be alert to the risk of diabetic ketoacidosis in patients taking sodium-glucose cotransporter-2 inhibitors.28
Acknowledgments
NHS Attribution Data Set data on GP-registered populations were obtained under licence from the Department of Health. General Medical Services statistics data on GP supply and Hospital Episode Statistics data were obtained under licence from the Health and Social Care Information Centre (now called NHS Digital). Mortality data were obtained under licence from the Office for National Statistics.
Notes
Funding
Richard Cookson is supported by the National Institute for Health Research (SRF-2013-06-015). All authors received funding from the NIHR HS&DR — 11/2004/39: Health Equity Indicators for the English NHS: a longitudinal whole-population study at the small-area level
Ethical approval
Ethical approval was not required for this study.
Provenance
Freely submitted; externally peer reviewed.
Competing interests
The authors have declared no competing interests.
Discuss this article
Contribute and read comments about this article: bjgp.org/letters
- Received April 10, 2016.
- Revision requested July 4, 2016.
- Accepted August 26, 2016.
- © British Journal of General Practice 2017
REFERENCES
In this issue


Jump to section
Keywords
More in this TOC Section
Related Articles
Cited By...

