


Article Figures & Data
Figures
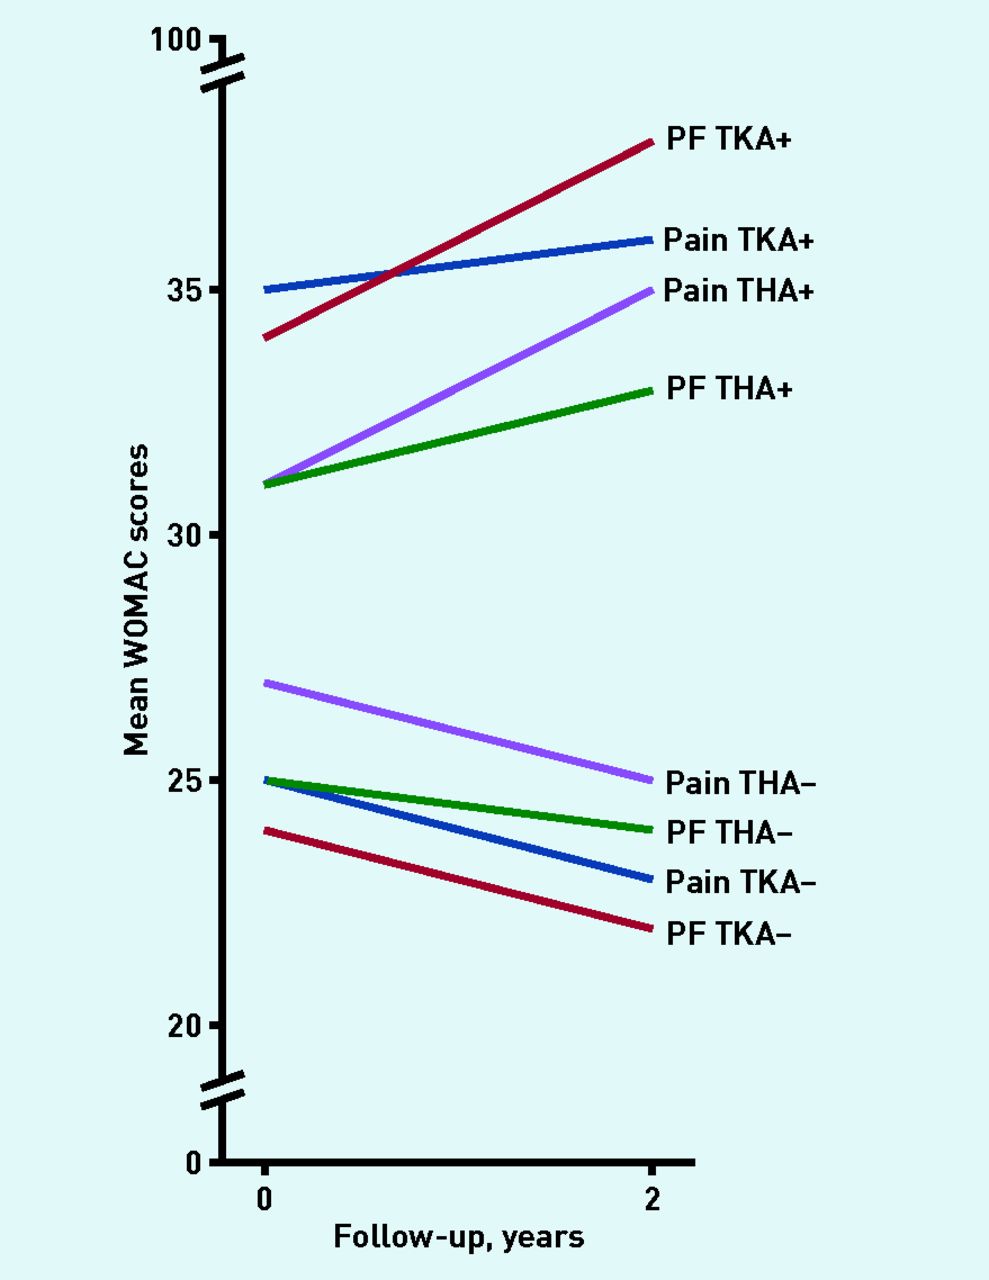
- Figure 1.
Depiction of the mean change in WOMAC scores from baseline to 2-year follow-up (T2). PF = physical functioning. THA = total hip arthroplasty. TKA = total knee arthroplasty. WOMAC = Western Ontario and McMaster osteoarthritis index.
Tables
- Table 1.
Baseline characteristics of the participants with a completed follow-up of 6 yearsa
Baseline characteristics Total cohort Knee pain subgroup Hip pain subgroup N= 908 TKA− n= 732 TKA+ n= 19 P -value THA− n= 485 THA+ n= 53 P-value Age, years; mean ± SD 55.8 ± 0.2 55.8 ± 0.2 58.0 ± 1.1 0.07 55.4 ± 0.2 58.0 ± 0.6 <0.01b Sex: female, % 79 79 95 0.10 82% 68% 0.01b Body mass index, kg/m2; mean ± SD 26.2 ± 0.1 26.3 ± 0.2 29.1 ± 1.0 <0.01b 26.3 ± 0.2 25.9 ± 0.5 0.60 Ethnic group (white versus other), % 98 97 100 0.47 98 100% 0.32 Education level % ≤ high school graduate, % 73 73 84 73 77 % college or university degree, % 27 27 16 0.29 27 23 0.55 Participants (%) with >1 comorbidity, % 45 46 47 0.91 52 40 0.13 NRS of the past week, mean (IQR) 3.5 (2.0–5.0) 3.5 (2.0–5.0) 4.5 (3.0–6.0) 0.04b 3.6 (2.0–5.0) 4.3 (2.0–6.0) 0.03b WOMAC pain, mean (IQR) 25 (10–35) 25 (10–35) 35 (20–40) 0.02b 27 (15–40) 31 (15–45) 0.07 WOMAC physical function, mean (IQR) 23 (10–34) 24 (10–34) 34 (20–44) <0.01b 25 (10–35) 31 (18–40) 0.02b WOMAC joint stiffness, mean (IQR) 33 (25–50) 33 (25–50) 47 (38–63) <0.01b 34 (25–50) 38 (25–50) 0.30 Pain coping strategies, mean (IQR) Pain transformation 2.1 (1.8–2.5) 2.2 (1.8–2.8) 2.2 (1.8–2.5) 0.67 2.2 (1.8–2.8) 2.2 (1.8–2.7) 0.67 Distracting 2.2 (1.8–2.6) 2.2 (1.8–2.6) 2.3 (1.8–2.8) 0.69 2.2 (1.8–2.6) 2.2 (1.8–2.8) 0.55 Reducing demands 2.0 (1.7–2.3) 2.0 (1.7–2.3) 2.0 (1.3–2.7) 0.83 2.0 (1.7–2.3) 1.9 (1.7–2.3) 0.16 Resting/avoidance 1.8 (1.4–2.2) 1.8 (1.4–2.2) 2.0 (1.6–2.4) 0.09 1.8 (1.4–2.2) 1.8 (1.5–2.0) 0.93 Worrying 1.6 (1.2–1.8) 1.6 (1.2–1.8) 1.6 (1.2–2.0) 0.87 1.6 (1.2–1.8) 1.6 (1.2–1.9) 0.79 Retreating 1.5 (1.1–1.9) 1.6 (1.1–1.9) 1.5 (1.1–1.7) 0.56 1.5 (1.1–1.9) 1.5 (1.0–1.7) 0.34 Smoker or previous smoker, % 14 15 0 0.07 15 6 0.07 Alcohol consumption, % 78 77 65 0.23 79 71 0.18 Use of pain medication, % 38 38 21 0.13 39 34 0.45 Morning stiffness knees <30 minutes, % 53 62 83 0.06 – – – Morning stiffness hips <60 minutes, % 36 – – – 55 64 0.20 Heberden nodes hands, % 48 48 56 0.53 50 59 0.22 Bouchard swellings hands, % 19 19 21 0.81 22 17 0.42 ESR, mm/hour ± SD 9.8 ± 0.3 10.1 ± 0.3 10.7 ± 1.7 0.77 9.9 ± 0.4 12.9 ± 1.4 0.05b TKA− 1480 knees TKA+ 22 knees P1-value THA− 1014 hips THA+ 62 hips P1-value Palpable warmth of the knee joint, % – 3 18 <0.01b – – – Joint space tenderness of the knee, % – 12 18 0.59 – – – Bony enlargements of the knee, % – 2 0 0.51 – – – Crepitus during knee flexion, % – 10 23 <0.01b – – – Positive knee refill test (effusion), % – 4 14 0.02b – – – Painful active knee flexion, % – 13 36 <0.01b – – – Painful active knee extension, % – 8 23% 0.04b – – – ROM knee flexion, mean ± SD – 135° ± 0.2° 127° ± 2.6° <0.01b – – – ROM knee extension, mean ± SD – 3° ± 0.1° 3° ± 0.8° 0.94 – – – JSN knee score >0, % – 55 86 0.03b – – – Femoral or tibial OP score >0, % – 45 91 <0.01b – – – Tibial attrition, % – 0 10 <0.01b – – – Femoral or tibial sclerosis, % – 1 10 <0.01b – – – Tibial spiking, % – 32 63 0.03b – – – K/L score 1 (versus K/L score 0), % – 39 86 <0.01b 26 72 <0.01b ROM hip flexion ≤ 115°, % – – – – 41 68 <0.01b ROM hip internal rotation ≤ 15°, % – – – – 4 26 <0.01b Painful active hip flexion, % – – – – 17 48 <0.01b Painful active hip internal rotation, % – – – – 16 46 <0.01b JSN hip score>0 (AP), % – – – – 31 79 <0.01b JSN hip score>0 (FP), % – – – – 11 60 <0.01b Acetabular or femoral OP score >0, % – – – – 35 78 <0.01b Femoral subchondral sclerosis, % – – – – 1 26 <0.01b Cam-type deformity (α angle >60°),c % – – – – 11 38 <0.01b Dysplasia (Wiberg angle <25°),b % – – – – 5 17 <0.01b ↵a Subgroups are participants who did (+) or did not (−) undergo arthroplasty during the 6-year follow-up. P-values obtained with Student’s t-test or Pearson’s χ2 when appropriate. P1-values obtained with generalised estimating equations (GEE).
↵b P-value <0.05.
↵c Lower-quality radiographs mean that these angles were determined in fewer hips (THA+: 781 hips, THA−: 45 hips). AP = anteroposterior pelvic view radiograph. ESR = erythrocyte sedimentation rate. FP = faux profile radiograph. JSN = joint space narrowing. K/L = Kellgren and Lawrence. NRS = Numeric Rating Scale. OP = osteophyte. ROM = range of motion. THA = total hip arthroplasty. TKA = total knee arthroplasty. WOMAC = Western Ontario and McMaster osteoarthritis index.
- Table 2.
Multivariable model of the knee pain subgroup for the association with total knee arthroplasty (TKA)a
β OR (95% CI) P-value BMI, kg/m2 0.10 1.1 (1.0 to 1.2) <0.01 Painful active knee flexion 1.35 3.8 (1.6 to 9.5) <0.01 K/L score 1 (versus K/L score 0) 1.86 6.4 (1.7 to 23.4) <0.01 ↵a Model obtained with generalised estimating equations (GEE). The obtained OR are unadjusted for age and sex; however, all three variables do remain significant after adjustment (data not presented). An OR >1 indicates an increased risk for undergoing TKA. β = regression coefficient (beta). BMI = body mass index. K/L = Kellgren and Lawrence. OR = odds ratio.
- Table 3.
Multivariable model of the hip pain subgroup for the association with total hip arthroplasty (THA)a
β OR (95% CI)b P-value Painful active hip internal rotation 1.65 5.2 (2.3 to 11.8) <0.01 ROM hip flexion ≤115° 0.99 2.7 (1.2 to 6.2) 0.02 K/L score 1 (vs. 0) 1.22 3.4 (1.2 to 9.4) 0.02 JSN on faux profile radiograph 2.53 12.6 (4.8 to 33.2) <0.01 Dysplasia (Wiberg angle <25°) 2.10 8.2 (2.6 to 25.5) <0.01 Femoral subchondral sclerosis 2.18 8.8 (2.9 to 26.7) <0.01 ↵a Model obtained with generalised estimating equations (GEE). An OR >1 indicates an increased risk for undergoing TKA (total knee arthroplasty).
↵b OR adjusted for age and sex. β = regression coefficient (beta). JSN = joint space narrowing. K/L = Kellgren and Lawrence. OR = odds ratio. ROM = range of motion.
- Table 4.
Mean change in WOMAC score and change in K/L distribution between baseline (T0) and 2-year follow up (T2)a
Knee pain at baseline Hip pain at baseline TKA− TKA+ THA− THA+ Variable T0–T2 (n= 732) T0–T2 (n= 18) P-value mean Δ T0–T2 (n= 485) T0–T2 (n= 40) P-value mean Δ WOMAC pain −1.7 (0.6) 4.4 (3.5) 0.12b −1.2 (0.8) 4.7 (2.7) 0.04b WOMAC physical function −1.3 (0.5) 4.9 (4.8) 0.07b −1.1 (0.7) 3.0 (2.1) 0.10b Distribution of K/L score 0/1/2/3/4 (%) T0
T21479 knees
61/39/0/0/0
50/36/13/1/021 knees
14/86/0/0/0
5/15/55/20/5<0.01c 1002 hips
74/26/0/0/0
68/30/2/0/048 hips
28/72/0/0/0
23/23/35/14/5<0.01c ↵a Values are mean change between T0 and T2 (standard error), or percentages %. P-values obtained with
↵b Student’s t-test or
↵c generalised estimating equations (GEE) and indicate whether the change in mean values (Δ) or in distribution of K/L score differ significantly. Progression of K/L score adjusted for baseline K/L score. K/L = Kellgren and Lawrence. T0 = baseline. T2 = 2-year follow-up. THA = total hip arthroplasty. TKA = total knee arthroplasty. WOMAC = Western Ontario and McMaster osteoarthritis index.
In this issue


Jump to section
More in this TOC Section
Related Articles
Cited By...

