


Abstract
Background: In 2002 the Department of Health published a list of 20 indicators to judge the performance of the 302 primary care organisations (PCOs) in England during 2001–2002. General practitioners (GPs) have expressed doubts about the relevance, applicability and evidence base of these indicators for actual practice.
Aims: To fashion NHS performance indicators to be acceptable and relevant to practicing GPs.
Design of study: A Delphi technique followed by simple mathematical modelling.
Methods: We asked a group of 24 senior GP educators to place the Department of Health performance indicators in rank order as markers of quality in general practice. We found just seven indicators comprised 73% of the markers chosen and all seven were chosen by over three-quarters of the responders. Using a simple ‘sign test’ system, we then calculated a composite points score for all 302 PCOs.
Results: We found that there were almost twice as many PCOs at the upper and lower ends of performance and fewer in the middle than we predicted theoretically. The results suggest that pan-PCO or practice factors account for the low performance scores of 16 of 35 PCOs with extremely poor performance and for the high scores of 17 of the 36 PCOs with extremely high performance.
Conclusion: We have developed a method that shows how numerous Department of Health performance indicators can be merged into a single composite performance score. We show that this composite performance score is easy to derive, simple to interpret, is acceptable to GPs, and has face validity.
Introduction
IN 1999, the Department of Health for England set up a system to monitor the performance of primary care organisations (PCOs). The system comprised of 20 measures that were intended to reflect the progress of primary care in implementing the government's National Health Service (NHS) modernisation agenda. The 20 measures are shown in Box 1.
Box 1. NHS performance indicators for 2001–2002 for primary care organisations.
Access to quality services
The number of patients waiting over 18 months for inpatient treatment
The number of patients waiting over 15 months for inpatient treatment
The number of patients waiting more than 26 weeks for an outpatient appointment
Surgery to remove cataracts
Surgery for coronary heart disease
Surgery to replace joints including hips and knees
Service provision
Percentage of patients able to see a GP within 48 hours
Patient satisfaction with the services available from GP survey as measured by the GP survey
The number of GPs who have access to the Internet
Deaths caused by an accident
Emergency admissions for people suffering from chronic conditions such as asthma and diabetes
Prescribing levels of generic drugs
Prescribing levels of antibacterial drugs
Prescribing levels of ulcer healing drugs
Improving health
Deaths from circulatory diseases
People who have quit smoking after 4 weeks
Teenage pregnancy measured as conceptions under the age of 18 years
People screened for cervical cancer
Children immunised against measles, mumps and rubella and diphtheria
People vaccinated against influenza
In August 2002, the results of the first annual assessment of PCO performance using these indicators was published.1 Since these measures are intended to reflect the progress of primary care in implementing the government's NHS modernisation agenda, we discussed the performance indicator scores obtained by Birmingham PCOs with local health professionals and general practitioners (GPs).
The overwhelming response was that there were far too many indicators, and that many were clearly of no relevance to general practice. We therefore decided the following:
To ascertain whether we could identify a subgroup out of these 20 indicators that GPs would consider valid indicators of their performance within the PCO.
To develop a single composite score from these ‘GP validated’ indicators.
To establish whether this composite indicator was likely to be a valid tool for measuring and comparing the combined performance of GPs in PCOs.
Methods and results
We listed the 20 NHS indicators in random order and approached 25 GPs who were both in active practice and recognised leaders of general practice education across the West Midlands Deanery. These doctors included the Deputy Postgraduate Dean, the Regional Director of GP Education, area directors, educational advisors, course organisers, GP tutors and GP trainers, coming from a region with a larger population than Scotland and encompassing the rurality of Herefordshire, the urban deprivation of the Black Country and the affluence of Sutton Coldfield and Solihull. We asked them individually to identify all those indicators that, in their opinion, were most likely to reflect high quality GP practice, particularly those for which GPs could have personal control of the service that the indicator sought to measure. We then asked them, again without any conferring, to place eight of these indicators in rank order and return their results to us anonymously. A pilot of this methodology had previously ascertained that participants were unable to rank order more than eight choices.
HOW THIS FITS IN
What do we know?
Governments like to use performance indicators. General practitioners (GPs) and other professionals tend to find externally imposed measurements irrelevant and threatening.
What does this paper add?
We have identified a subgroup of National Health Service performance indicators that practicing GPs consider acceptable and relevant. Using a simple scoring system, we were able to merge the scores from these indicators into a single composite performance score and compare the performance of all 302 primary care organisations in England in 2001–2002.
We found that just seven indicators comprised 73% of the indicator choices selected and these were chosen by three-quarters of all responders (Table 1). Five indicators were not selected by any of the 24 participating GPs: 26–week outpatient waits, 18–month and 15–month in-patient waits, surgery rates for cataract removal, and accidental deaths.
Indicators listed according to frequency of selection by responders.
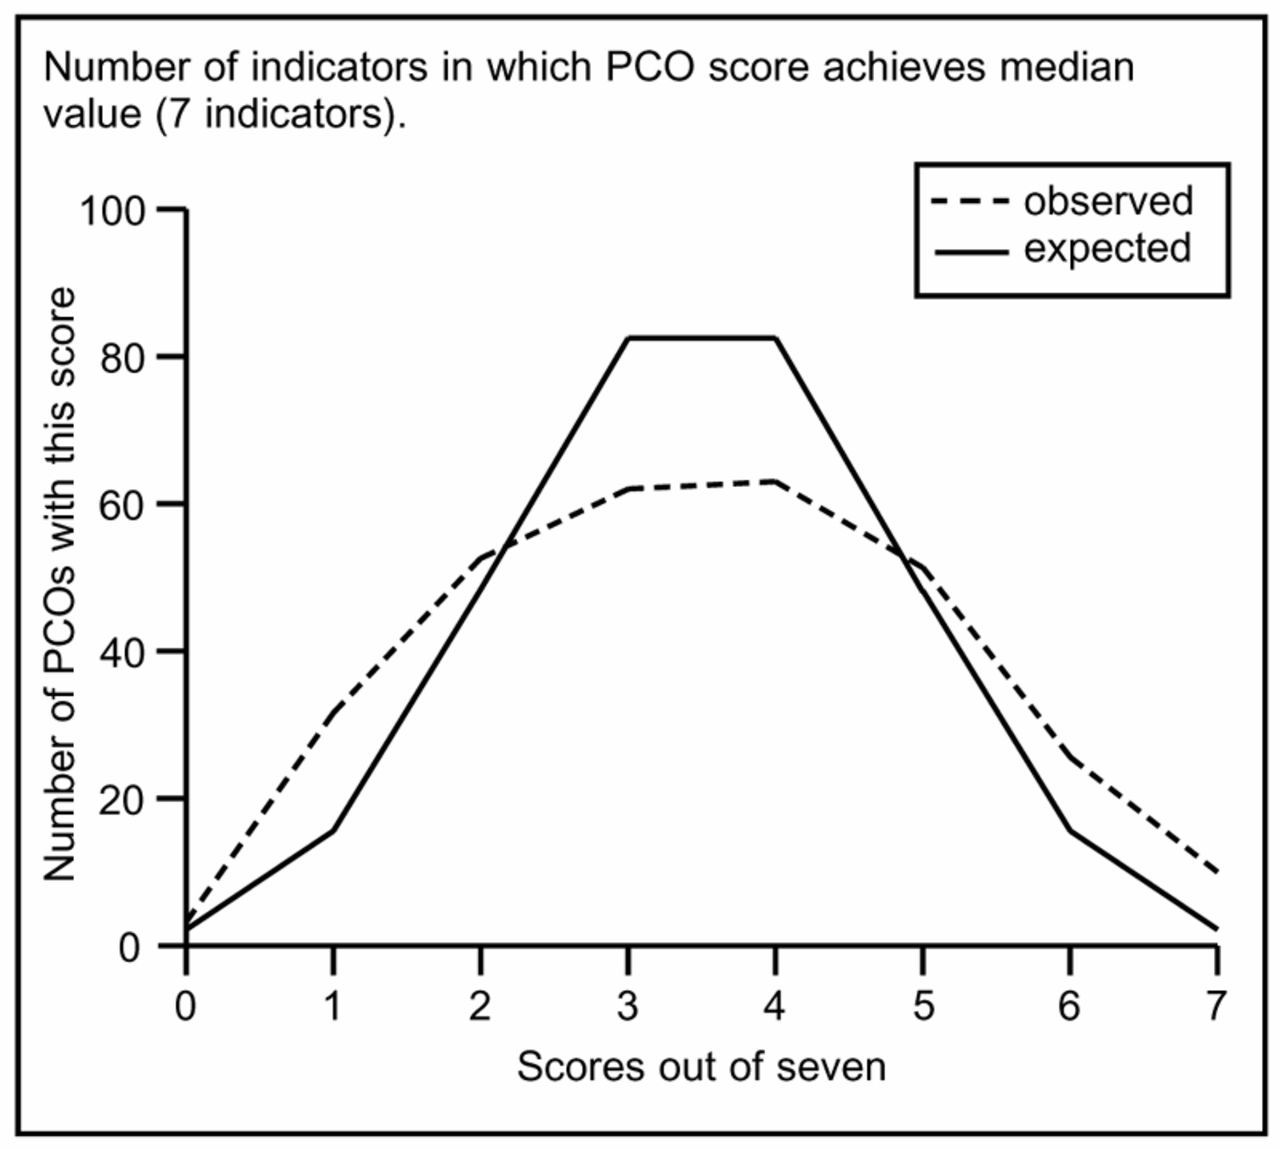
Using these seven indicators we calculated a ‘composite GP performance indicator score’ for each PCO. The composite GP performance indicator score was derived in the following way. We used the Department of Health 2001–2002 data to obtain the median score of the 302 PCOs in England for each of these seven indicators. If a PCO's score was better than the national median value for an indicator we assigned the PCO one point. We repeated this point allocation process for each of the seven GP performance indicators. (See Table 2 for national median scores and examples of high and low scoring PCOs.) For each PCO, we added these individual scores to produce a composite score, which would have to lie between 0 and 7. We then plotted a graph which showed the number of PCOs observed with composite indicator score (Figure 1). Thirty-six PCOs achieved high scores of either 6 or 7, 35 had low scores of 0 or 1, and 231 had middling scores of 2, 3, 4, or 5.

Expected and observed composite indicator scores for 302 primary care organisations.
Composite indicator scores calculated for anonymised actual examples of high and low scoring PCOs.
We also plotted the graph that we would expect if the performance of all PCOs was equal, and differences in their performances were owing to chance or sampling variation. Put simply, common sense (and binomial theory) suggests that:
The average composite score for any PCO must be 3.5.
The majority (165) of PCOs should have composite scores of 3 or 4.
Fewer (49) PCOs should have to have a composite score of either 2 or 5.
Even fewer (19) PCOs should have low composite scores of 0 or 1, and a similar number have high composite scores of 6 or 7.
Figure 1 shows that only 126 PCOs — 39 fewer than expected — had scores of 3 and 4. More interestingly, about twice as many PCOs had scores of 0 and 1 (35), and of 6 or 7 (36) than expected theoretically. These results suggest that:
The performance of about half of the 71 PCOs with very high or low scores can be attributed to chance and should therefore not attract criticism or praise.
The performance of the other — approximately 35 — PCOs are likely to be related to specific PCO related factors. The implication must be that the performance of these PCOs can justifiably be criticised or praised.
Unfortunately, using this data alone we have no way of deciding which PCOs have low or high scores owing to ‘luck’ and which have low or high scores owing to practice-related factors.
Discussion
Nobody likes composite performance scores (‘It is like mixing apples and oranges’). Nevertheless, governments have shown an increasing desire to collect indices of performance to justify organisational and funding changes. These are of little value if they are not easily understood and credible to those whose performance they purport to measure. We believe that our method, a 7-indicator composite score, meets these criteria. Furthermore these scores are:
Simple. Calculating a composite score for a PCO by using the criteria of whether each indicator value is above the median is an easy statistical ‘sign test’ technique.2
Easily interpreted. We found that GPs and other health professionals could follow the simple steps of our method without feeling that they had been blinded by abstruse statistical or mathematical theory. We presented these results to the West Midlands area directors of general practice and there was unanimous agreement on the simplicity of the method.
Relevant. Practitioners have doubted the value, relevance and the evidence base of government inspired performance indicators.3-6 First sight of the 2001–2002 list, with its emphasis on hospital waits as markers for primary care quality, did little to dispel this attitude. We believe that by allowing GPs to select the indicators that they feel able to control, they have given professional credibility to the composite indicator score. Even the few GPs evaluating the study who were not totally convinced of the fairness of the indicators, requested that we use the methodology to calculate the composite scores of the practices selected to train GP registrars in the Deanery. It is important to remember that these composite scores are not based on arbitrary ‘thresholds’ or ‘targets’, but a real score derived from the median performance of all PCOs. They could be used to put PCOs in bands, comparable to the government's star rating system, but they are internal comparisons rather than the basis of league tables, which practitioners find neither helpful nor acceptable.
Face validity. In its drive to improve recruitment into general practice, the government has introduced a ‘golden hello’ inducement payment to new GP principals.7 This is paid either at ‘normal’ or ‘enhanced’ rates, depending on the recruitment need of each PCO, as judged by the Department of Health. Only eight of the 35 (23%) PCOs with high composite scores offer the enhanced payment, compared with 33 out of the 36 (92%) low scoring PCOs. Furthermore, several of the indicators chosen by our group of clinicians have been used in the formulation of the General Medical Services contract in the determination of the global sum, additional services and quality payments.8 The Department of Health has announced a new set of indicators for primary care and removed two — Internet access and the results of the National Patient Survey — from the previous list, neither of which reached the shortlist chosen by our Delphi group of GP educators.
We noted that none of the low scoring PCOs registered a score for cervical cytology, in contrast with all but three of the high scorers. All of the high scorers except one were above the mean for influenza immunisation, whereas only one of the low scorers was above the mean. Initial analysis suggests that low scoring PCOs tend to be in conurbations and reflect socioeconomic deprivation; this is in line with previous research into family health services authorities performance indicators where morbidity, socioeconomic characteristics, and secondary care supply were identified as confounding factors, explaining between a third and a half of the variation in admission rates across health authority areas.9 Although Roland and his colleagues at the National Primary Care Research and Development Centre, University of Manchester, have been researching into quality markers in individual practices,10 we feel that, especially with increasing central emphasis on managed primary care, scores like ours can be used to encourage joint PCO and practice endeavours to demonstrate improving quality of care.
Acknowledgments
We would like to thank the GP educators who participated as our expert Delphi group.
- Received April 23, 2003.
- Revision received July 9, 2003.
- Accepted November 26, 2003.
- © British Journal of General Practice, 2004.
In this issue


Jump to section
More in this TOC Section
Related Articles
Cited By...

