


Article Figures & Data
Figures
- Figure 1a
Risk estimation by the GP.
- Figure 1b
Örebro questionnaire.
- Figure 1c
Low Back Pain Perception Scale.
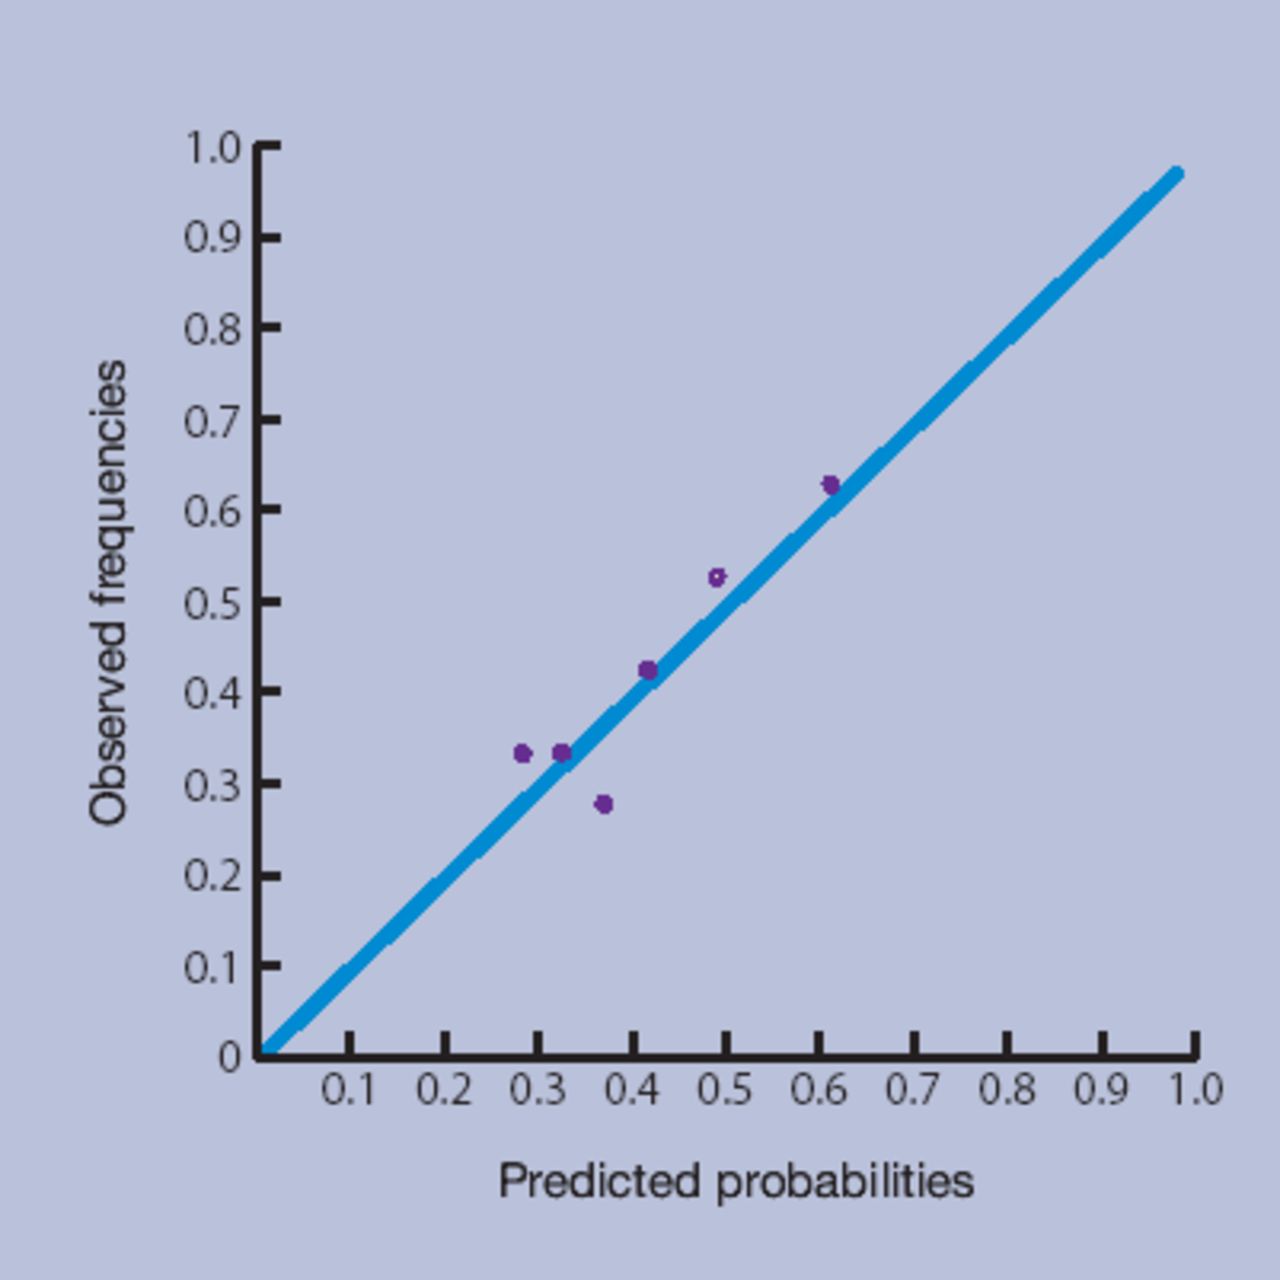
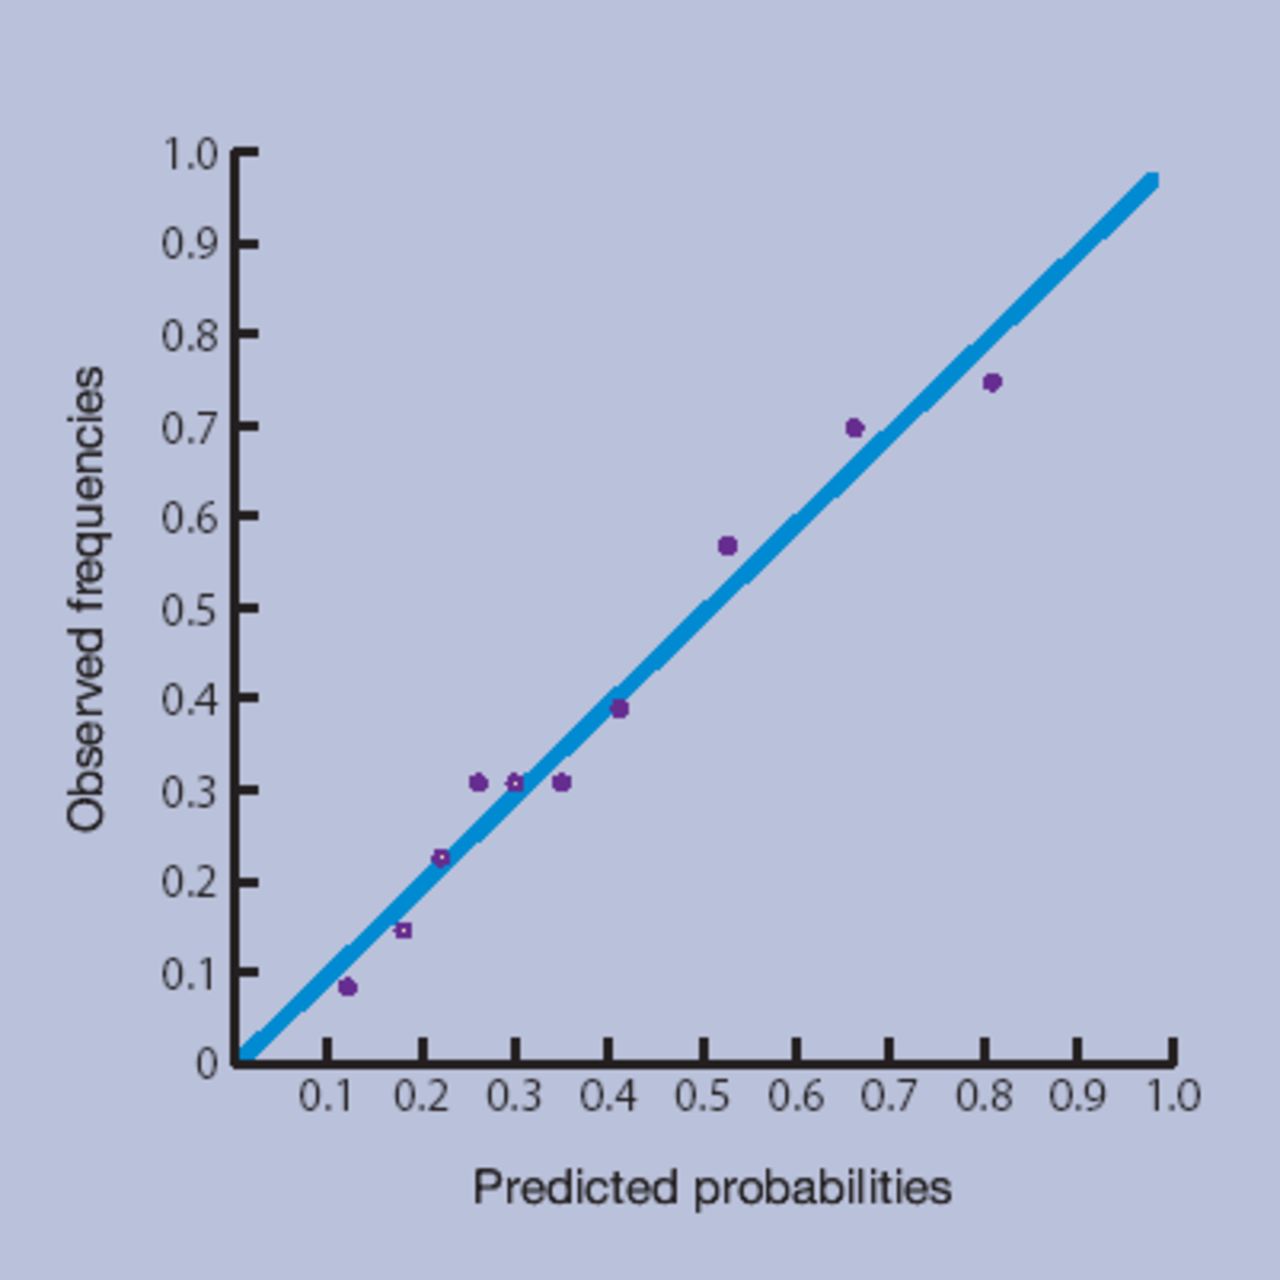
- Figure 1d
Prediction rule.


Tables
Characteristic Patients Demographic characteristics Mean age (SD)a 42.7 (11.6) Female sex, % 47.5 Dutch nationality, % 97.5 Public health insurance, % 69.1 Educational level and work status Educational level (%)a ≤Primary 34.0 Secondary 49.7 College, university 16.3 Employed (%) 81.5 Sick leave because of low back paina(among the working population, %) 38.2 Characteristics of low back pain Duration of current episode (days, median [IQR]) 12 (6–21) Frequency of back pain episodes in last year (%) 1 or 2 episodes 59.6 3 or more episodes 19.1 Exacerbation 21.3 Pain intensity during the day (0–10)b (mean [SD]) 4.9 (2.0) Pain radiating below knee (%)a 13.8 - Table 2
Associations of potential predictors with an unfavourable course of low back pain.
Univariable OR (95% CI) P-value Multivariable OR (95% CI) P-value Intervention group12 New intervention versus usual care 1.13 (0.71 to 1.81) 0.61 Sociodemographic variables Age, years 0.44 30–50 versus 18–30 0.77 (0.40 to 1.49) 50–65 versus 18–30 0.61 (0.29 to 1.30) Sex 0.93 Male versus female 1.02 (0.64 to 1.64) Educational level 0.53 Secondary versus primary 0.77 (0.46 to 1.31) College/university versus primary 1.04 (0.52 to 2.08) Employed 0.76 Yes versus no 1.12 (0.54 to 2.30) Health insurance 0.43 Private versus public 0.82 (0.49 to 1.35) Characteristics of low back pain Pain intensity during day (0–10)16 0.34 4–6 versus 0–3 0.75 (0.43 to 1.31) 7–10 versus 0–3 1.12 (0.58 to 2.17) Radiation of pain 0.09a Yes versus no 1.50 (0.93 to 2.42) Radiation of pain below knee 0.03a Yes versus no 2.17 (1.10 to 4.27) Duration of current back pain episode (days) 0.13a 8–30 versus 0–7 1.47 (0.87 to 2.49) 31–90 versus 0–7 2.04 (0.98 to 4.24) Frequency of back pain episodes in previous year <0.001a <0.001 ≥3 versus 1 or 2 3.92 (2.39 to 6.44) 2.89 (1.61 to 5.16) Pain sites other than back 0.50 Yes versus no 1.18 (0.72 to 1.93) Functional disability (RDQ; 0–24)17 0.85 >13 versus ≤13 (median split) 0.96 (0.60 to 1.53) Severity of main complaint (0–10)18 0.45 >7 versus ≤7 (median split) 1.20 (0.75 to 1.93) Physical workload Sitting19 0.24 Sometimes versus never/seldom 1.55 (0.79 to 3.03) Often/always versus never/seldom 0.94 (0.52 to 1.70) Standing19 0.13a Per point (1–5)b 1.19 (0.95 to 1.49) Walking19 0.02a 0.04 Per point (1–5)b 1.38 (1.05 to 1.82) 1.38 (1.01 to 1.89) Lifting19 0.70 Sometimes versus never/seldom 1.23 (0.69 to 2.19) Often/always versus never/seldom 0.95 (0.52 to 1.73) Tiredness19 0.001a Per point (1–5)b 1.55 (1.21 to 2.00) Sweating19 0.70 Sometimes versus never/seldom 1.24 (0.71 to 2.17) Often/always versus never/seldom 0.98 (0.51 to 1.87) Psychosocial factors Fear avoidance (FABQ; 0–24)20 0.63 >15 versus ≤15 (median split) 1.12 (0.70 to 1.79) Pain catastrophising (CSQ; 0–36)21 <0.001a 0.09 Per point 1.08 (1.04 to 1.12) 1.04 (0.99 to 1.09) Distress (4DSQ; 0–32)22 0.02a Per point 1.04 (1.01 to 1.08) Somatisation (4DSQ; 0–32)22 <0.001a Per point 1.10 (1.04 to 1.16) Influence on health (1–4)23 0.01a Much influence/reasonable versus no influence/hardly any 0.51 (0.30 to 0.86) Perceived general health (SF-36; 1–5)24 0.001a Per point 0.56 (0.40 to 0.78) Responses of a significant other as perceived by patient (MPI; 0–6)25 Punishing responses 0.36 >0 versus 0 (median split) 1.25 (0.77 to 2.03) 0.02 Solicitous responses 0.06a Per point 0.84 (0.70 to 1.01) 0.76(0.61 to 0.95) Distracting responses 0.81 >2.3 versus ≤2.3 (median split) 1.06 (0.66 to 1.72) Patient estimation of the risk (0–10) to develop chronic low back pain6 ≤0.001a 0.01 4–6 versus 0–3 1.59 (0.89 to 2.83) 1.19 (0.61 to 2.32) 7–10 versus 0–3 5.34 (2.80 to 10.18) 3.10 (1.44 to 6.69) ↵a P<0.20. These variables were selected as potential predictors for multivariable analysis. RDQ = Roland-Morris Disability Questionnaire.
↵a P<0.20. These variables were selected as potential predictors for multivariable analysis.
↵b Higher score indicates that the activity is more frequently performed. 4DSQ = 16-item subscales of the 4-Dimensional Symptom Questionnaire; CSQ = 6-item subscale of the Coping Strategies Questionnaire; FABQ = 4-item physical activity subscale of the Fear Avoidance and Beliefs Questionnaire; MPI = part two of the Multidimensional Pain Inventor; OR = odds ratio. SF-36= first question of the subscale ‘general health perceptions’ of the Short Form Health Survey. The higher the score, the higher functional disability, fear avoidance beliefs, pain catastrophising, distress, somatisation, and the perception of positive health, the more punishing, solicitous, and distracting were the responses.
Positive predictive values, % (n) AUC-I ‘original’ AUC-II ‘3 categories’ Cut-offs (n), sensitivity (%), and specificity (%) Low risk Medium risk High risk Risk estimation by GP (n = 283a) 0.59 (0.52 to 0.66) 0.58 (0.51 to 0.65) Cut-off ≥1 Sensitivity = 86 Specificity = 17 Cut-off ≥4 Sensitivity = 28 Specificity = 87 33.3 (45) 33.0 (185) 56.6 (53) Örebro questionnaire (n = 296a) 0.61 (0.54 to 0.67) 0.58 (0.51 to 0.65) Cut-off >68 Sensitivity = 79 Specificity = 26 Cut-off >99 Sensitivity = 35 Specificity = 81 32.4 (71) 32.7 (150) 52.0 (75) Linton (2002)b 0.61 (0.54 to 0.68) Cut-off ≥90b Sensitivity = 52 Specificity = 66 Cut-off >105b Sensitivity = 28 Specificity = 89 30.3 (175) 39.1 (69) 59.6 (52) Low Back Pain Perception Scale (n = 298a) 0.59 (0.52 to 0.66) 0.57 (0.50 to 0.64) Cut-off ≥2 Sensitivity = 80 Specificity = 27 Cut-off ≥4 Sensitivity = 30 Specificity = 81 30.1 (73) 36.1 (155) 48.6 (70) Prediction rule (n = 267a) 0.75 (0.69 to 0.81) 0.72 (0.66 to 0.79) Cut-off ≥0.28 Sensitivity = 79 Specificity = 55 Cut-off ≥0.41 Sensitivity = 57 Specificity = 81 18.6 (113) 33.3 (66) 63.6 (88)
In this issue


Jump to section
More in this TOC Section
Related Articles
Cited By...

