


Abstract
Background Earlier diagnosis of renal tract cancer could help improve survival so better tools are needed to help this.
Aim To derive and validate an algorithm to estimate the absolute risk of renal tract cancer in patients with and without symptoms in primary care.
Design Cohort study using data from 375 UK QResearch® general practices for development and 189 for validation.
Method Included patients were aged 30–84 years free at baseline of a diagnosis of renal tract cancer (bladder, kidney, ureter, or urethra) and without haematuria, abdominal pain, appetite loss, or weight loss in previous 12 months. The primary outcome was incident diagnosis of renal tract cancer recorded in the next 2 years. Risk factors examined were age, body mass index, smoking, alcohol, deprivation, treated hypertension, renal stones, structural kidney problems, diabetes, previous diagnosis of cancer apart from renal tract cancer, haematuria, abdominal pain, appetite loss, weight loss, diarrhoea, constipation, tiredness, and anaemia. Cox proportional hazards models were used to develop separate risk equations in males and females. Measures of calibration and discrimination assessed performance in the validation cohort.
Results There were 2878 incident cases of renal tract cancer from 4.1 million person-years in the derivation cohort. Independent predictors in both males and females were age, smoking status, haematuria, abdominal pain, weight loss, and anaemia. A history of prior cancer other than renal tract cancer, and appetite loss were predictors for females only. On validation, the algorithms explained 75% of the variation in females and 76% in males. The receiver operating curve statistics were 0.91 (females) and 0.95 (males). The D statistic was 3.53 (females) and 3.60 (males). The 10% of patients with the highest predicted risks contained 87% of all renal tract cancers diagnosed over the next 2 years.
Conclusion The algorithm has good discrimination and calibration and could potentially be used to identify those at highest risk of renal tract cancer, to facilitate more timely referral and investigation.
INTRODUCTION
Renal tract cancer, comprising cancer of the bladder, kidney, ureter, or urethra, is one of the top 10 most common cancers in the UK. In 2008, there were 19 000 new diagnoses of cancer and 8850 deaths due to bladder or kidney cancer,1,2 It is unlikely that there will be a national screening programme for renal tract cancer in the foreseeable future, since there are few established risk factors and currently no reliable screening test. Hence, it is likely that most renal tract cancers will be diagnosed in symptomatic patients presenting to primary care. The challenge then becomes helping GPs to make earlier diagnoses and referral, with the aim of improving treatment options (for example, the possibility of surgery) and prognosis. While earlier diagnosis could be improved by increased public and professional awareness of symptoms, reliance on individual symptoms alone (such as haematuria) is unlikely to be satisfactory, since single symptoms are poor predictors of cancer and could result in half of all renal tract cancers being missed.3 In the UK, GPs will soon have better direct access to diagnostic investigations, such as intravenous urogram, ultrasound, computerised tomography (CT) scanning, and magnetic resonance imaging (MRI). GPs need better assessment tools to quantify a patient's risk of renal tract cancer, so that the right patients are sent for the right investigations, making efficient use of scarce resources.
It was decided to develop and validate a risk-prediction algorithm to estimate an individual's absolute risk of currently having renal tract cancer, incorporating both symptoms and baseline risk factors such as age and smoking status. The QResearch® primary care database was used to develop the risk prediction models since it contains robust data on many of the relevant exposures and outcomes. It is also representative of the population where such a model is likely to be used and has been used successfully to develop and validate a range of prediction models for use in primary care,4–7 including cancer.8–12 Once validated, the models could be integrated into clinical computer systems to help systematically identify those at high risk and alert clinicians to those who might benefit most from further assessment or interventions.4–7 It could also be made available on the internet as a simple calculator for use by the general population to help support the National Early Diagnosis and Awareness Initiative.13 This initiative aims to raise public awareness of the signs and symptoms of cancer, and encourage those who may have symptoms to seek advice earlier.
METHOD
Study design and data source
A prospective cohort study was carried out in a large population of primary care patients from an open cohort study, using the QResearch database (version 30). All practices in England and Wales that had been using their Egton Medical Information Systems (EMIS) computer system for at least a year were included. Two-thirds of practices were randomly allocated to the derivation dataset and the remaining one-third to a validation dataset. An open cohort of patients aged 30–84 years was identified, drawn from patients registered with practices between 1 January 2000 and 30 September 2010. The following were excluded: patients without a postcode-related Townsend score, patients with a history of renal tract cancer at baseline, and as in previous studies,8–12 those with a recorded ‘red-flag’ symptom in the 12 months prior to the study entry date. For this study, a ‘red-flag’ symptom was defined as a symptom that might alarm the patient and also indicate the presence of renal tract cancer; that is, symptoms of haematuria, loss of appetite, weight loss, or abdominal pain.
How this fits in
There is no reliable screening test for renal tract cancer, so most diagnoses are likely to be made in symptomatic patients. There needs to be an increased awareness of symptoms among patients and earlier investigation of symptomatic patients by GPs to make more timely diagnoses. This study has developed a new algorithm that predicts the absolute risk of having renal tract cancer, based on a combination of symptoms and baseline risk factors such as age and smoking status. The algorithm performed well in a separate sample in terms of both discrimination and calibration. The sensitivity was high; for example, if the 10% of patients with the highest risk are selected, then this group will account for 87% of all cases of renal tract cancers diagnosed within the subsequent 2 years. This study could raise awareness of symptoms that are predictive of renal tract cancer, which could help inform future clinical practice and guidelines. Use of the tool in clinical practice has the potential to lead to earlier investigation of symptomatic patients, with the aim of then making a more timely diagnosis.
Entry to the cohort was defined as the latest of the study start date (1 January 2000) and 12 months after the patient registered with the practice, so that all patients had a minimum of 12 months' registration prior to study entry. For patients with incident haematuria, appetite loss, weight loss, or abdominal pain, the entry date was the date of the first consultation with the symptom within the study period.
Clinical outcome definition
The study outcome was renal tract cancer, which was defined as incident diagnosis of cancer of the bladder, kidney, ureter, or urethra during the 2 years after study entry, recorded either on the patient's GP record using the relevant UK diagnostic Read Codes, or their linked Office for National Statistics (ONS) cause-of-death record, using the relevant International Classification of Disease (ICD)-9 codes (188 or 189) or ICD-10 diagnostic codes (C64–67).
A 2-year period was used, since this represents the period of time during which existing cancers are likely to become clinically manifest.3 Patients were censored at the earliest of the date of diagnosis of renal tract cancer, date of death, date of leaving the practice, or 2 years after their study entry date.
Predictor variables
Established predictor variables were examined, focusing on those that are likely to be recorded in the patient's electronic record and that the patient is likely to know.14,15 Symptoms that might herald a diagnosis of renal tract cancer were also included.16,17 Separate analyses were carried out in males and females. The predictor variables were:
currently consulting GP with first onset of macroscopic haematuria (yes/no)
currently consulting GP with first onset of loss of appetite (yes/no)
currently consulting GP with first onset of weight-loss symptom (yes/no)
currently consulting GP with first onset of abdominal pain (yes/no)
recently consulted GP with constipation in the past 12 months (yes/no)
recently consulted GP with diarrhoea in the past 12 months (yes/no)
recently consulted GP with tiredness in the past 12 months (yes/no)
age at baseline (continuous, ranging from 30 to 84 years)1,2
body mass index (continuous)18
smoking status (non-smoker; ex-smoker; light smoker (1–9 cigarettes/day); moderate smoker (10–19 cigarettes/day); heavy smoker (≥20 cigarettes/day)1,2,19
alcohol use (none, trivial (<1 unit/day); light (1–2 units/day); moderate or heavy (≥3 units/day))20
Townsend deprivation score, derived from patients' postcodes (continuous)
treated hypertension (yes/no)21
renal stones (yes/no)1
structural kidney problems (yes/no)
diabetes (type 1/type 2/no diabetes) at study entry22
previous diagnosis of cancer apart from renal tract cancer at study entry23,24
anaemia, defined as recorded haemoglobin <11 g/dl in the 12 months before study entry or the 60 days after (yes/no).
Some risk factors for bladder cancer were not included,2 since they are not likely to be recorded on the database (such as exposure to hair dyes, occupational exposures, or coffee use) or are not relevant to the UK (for example, schistomsomiasis), and their overall contribution is thought to be small.1,2
Derivation and validation of the models
The risk-prediction algorithm was developed and validated using established methods.4–7,25–27 Multiple imputation was used to replace missing values for body mass index, and alcohol and smoking status in the derivation and validation datasets, and these values were used in the main analyses, to develop and then validate the algorithm.28–31 Five imputations were carried out. Cox's proportional hazards models were used to estimate the coefficients for each risk factor for males and females separately, using robust variance estimates to allow for the clustering of patients within general practices. Rubin's rules were used to combine the results across the imputed datasets.32 Fractional polynomials were used to model non-linear risk relationships with continuous variables.33 A full model was fitted initially and variables were retained if they had a hazard ratio of <0.80 or >1.20 (for binary variables) and were statistically significant at the 0.01 level. Interactions between predictor variables and age were examined and included in the final models if they were statistically significant at the 0.01 level.
The regression coefficients for each variable from the final model were used as weights, which were combined with the baseline survivor function evaluated at 2 years, to derive risk equations for 2 years' follow-up.34 The baseline survivor function was estimated, based on zero values of centred continuous variables, with all binary predictor values set to zero, using the methods implemented in STATA.
The risk equations for males and females obtained from the derivation cohort were then applied to the validation cohort and measures of discrimination were calculated. R2 (estimated variation explained by the risk equation in time to diagnosis of renal tract cancer),35 the D-statistic (a measure of discrimination suitable for use with survival data where higher values indicate better discrimination),36 and the area under the receiver operating characteristic (ROC) curve at 2 years were calculated. Calibration was assessed (comparing the mean predicted risks at 2 years with the observed risks by tenth of predicted risk). The observed risks were obtained using the Kaplan–Meier estimates evaluated at 2 years.
The validation cohort was used to define the thresholds for the 0.1%, 0.5%, 1%, 5%, and 10% of patients at highest estimated risk of renal tract cancer at 2 years. Sensitivity, specificity, and positive and negative predictive values were calculated using these thresholds, restricting the analyses to patients who had the outcome within 2 years or had at least 2 years of follow-up. All the available data on the database were used, to maximise the power and also the generalisability of the results. STATA (version 11) was used for all analyses.
RESULTS
Overall study population
Overall, 564 QResearch practices in England and Wales met the inclusion criteria, of which 375 were randomly assigned to the derivation dataset, with the remainder assigned to a validation cohort. A total of 2 538 615 patients aged 30–84 years were identified in the derivation cohort. The following were excluded: 124 458 patients (4.9%) without a recorded Townsend deprivation score, 2911 (0.1 %) patients with a history of renal tract cancer, and 52 078 (2.1%) patients with at least one ‘red-flag’ symptom recorded in the 12 months prior to entry to the study, leaving 2 359 168 patients for analysis
A total of 1 342 329 patients aged 30–84 years were identified in the validation cohort. The following were excluded: 70 847 patients (5.3%) without a recorded Townsend score, 1506 (0.1%) with a history of renal tract cancer, and 29 254 (2.2%) with at least one ‘red flag’ symptom recorded in the 12 months prior to study entry, leaving 1 240 722 patients for analysis.
The baseline characteristics of each cohort were very similar, as shown in Table 1. As in a previous study,5 the patterns of missing data supported the use of multiple imputation to replace missing values for smoking status, alcohol, and body mass index (not shown, available from the authors).
Baseline characteristics of patients in the derivation and validation cohortsa
Incidence rates for ‘red-flag’ symptoms
Overall in the derivation cohort, 25 553 patients with haematuria were identified, 128 721 with abdominal pain, 5531 with appetite loss, and 14 464 with weight loss. Figure 1 shows the age–sex incidence rates of each symptom. The incidence rates for appetite loss and weight loss were similar in males and females and increased steeply with age. Haematuria was more common in males, with a crude incidence rate of 410 per 100 000 person-years, compared with 280 per 100 000 person-years in females. Abdominal pain was more common in females than males. Rates of abdominal pain tended to decrease with age in females and increase with age in males.
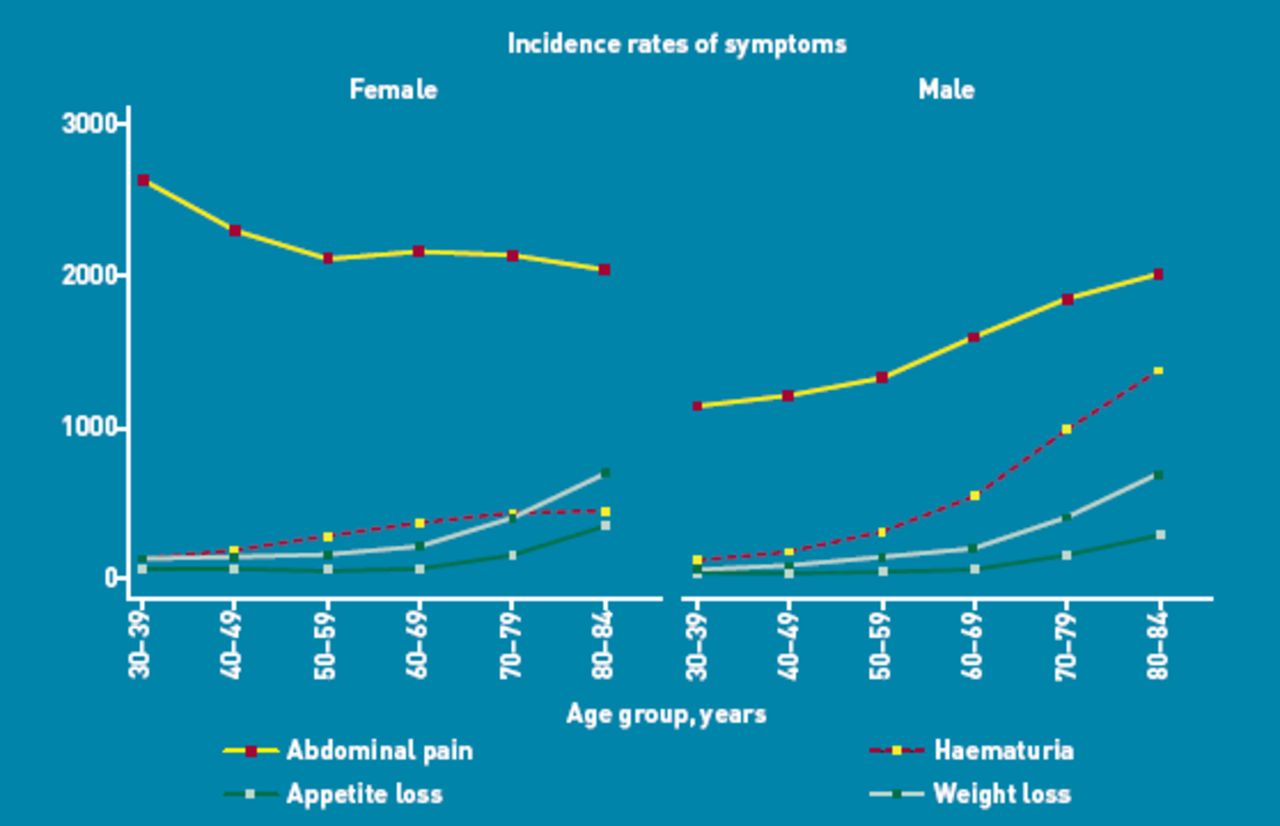
Incidence rates of haematuria, abdominal pain, appetite loss, and weight loss per 100 000 person-years in males and females in the derivation cohort.
Incidence rates of renal tract cancer
Overall in the derivation cohort, during the 2-year follow-up period, a total of 2878 incident cases of renal tract cancer were identified, arising from 4 135 701 person-years of observation, giving a crude rate of 70 per 100 000 person-years. The crude incidence rate was more than twice as high in males as in females (99 versus 39 per 100 000 person-years) and rose steeply with age, as shown in Table 2. Of the 2878 incident cases of renal tract cancer, the mean age at diagnosis was 70 years and 2063 (71.2%) were males. There were 2796 cases (97.2% of 2878) identified using the GP record and an additional 82 (2.8%) identified solely from the linked death record. Of the 2878 cases, 570 were kidney (19.8%), 2267 were bladder (78.8%), 36 were ureter (1.3%), and five were urethra (0.2%) cancer.
Age-sex specific incidence rates for renal tract cancer in the QResearch® derivation cohort; number of cases per 100 000 person-years (2000–2010)
In the validation cohort, 1622 incident cases of renal tract cancer were identified, arising from 2 176 202 person-years of observation, giving a crude rate of 75 per 100 000 person-years. Of the 1622 incident cases of renal tract cancer in the validation cohort, the mean age at diagnosis was 70 years and 1187 (73.2%) were males. There were 1575 cases (97.1% of 1622) identified using the GP record and an additional 47 (2.9%) solely from the linked death record. Of the 1622 cases in the validation cohort, 1292 (79.7%) were bladder, 307 (18.9%) were kidney, 21 (1.3%) were ureter, and 2 (0.1%) were urethra cancer.
Predictor variables
Table 3 shows the predictor variables selected for the final models for females and males. Independent predictors in both males and females included: age, smoking status, haematuria, abdominal pain, weight loss, and anaemia. A history of prior cancer other than renal tract cancer, and appetite loss were predictors for females only. The other variables examined were not independent risk factors, so were not included in the final models.
Adjusted hazard ratios (95% CI) for the final model for renal tract cancer for males and females in the derivation cohorta
The risk of renal tract cancer in females was significantly associated with increasing age, as shown in Figure 2. The risk also increased with the amount smoked. For example, compared with non-smokers, the risks were increased by 2.3-fold for heavy smokers and 1.8-fold for light smokers. The risks were also elevated in females with prior cancer (1.5-fold higher), haematuria (119-fold higher), abdominal pain (2.4-fold higher), appetite loss (2.5-fold higher), weight loss (2.6-fold higher), and anaemia (2.0-fold higher). There was also a significant interaction between haematuria and age in females, with the relative risk being more marked at younger ages. There was also a significant interaction between haematuria and age in males, which showed higher hazard ratios at younger ages.

Adjusted hazard ratios for renal tract cancer by age in males and females. Hazard ratios were compared with age = 45 years.
The magnitudes of the hazard ratios in males were generally higher than those for females as shown in Table 3, and the relative increase in risk with increasing age was marginally steeper in males (Figure 2). The risks were also elevated with haematuria (148-fold higher), abdominal pain (3.1-fold higher), and weight loss (5.7-fold higher). There were also significant interactions between haematuria and age, abdominal pain and age, and weight loss and age in males. Unlike females, prior cancer and loss of appetite were not significant predictors in males.
Validation
The validation statistics in Table 4 showed that the risk-prediction equations explained 75% of the variation in time to diagnosis in females and 76% of the variation in males. The D-statistic was 3.53 for females and 3.60 for males. The ROC statistics were 0.91 for females and 0.95 for males.
Validation statistics for the risk-prediction algorithm in the validation cohort
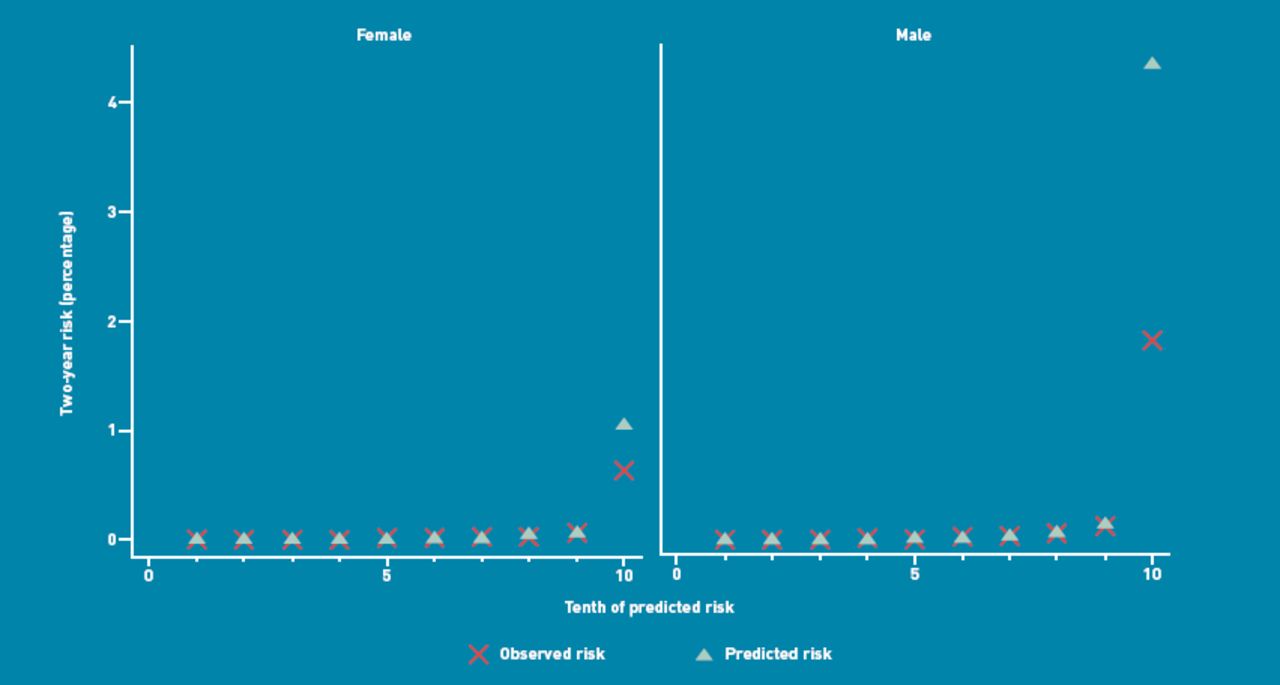
Figure 3 shows the mean predicted risk scores and the observed risks at 2 years within each tenth of predicted risk, in order to assess the calibration of the model in the validation cohort. Overall, the model was reasonably calibrated. There was close correspondence between predicted and observed 2-year risks within each model tenth for males and females, with a degree of over-prediction in the highest tenth, which was more marked in males than females.
Mean predicted risk and observed risk of renal tract cancer over 2 years by tenth of predicted risk applying the risk prediction scores to the validation cohort
Individual risk assessment and thresholds
One potential use for this algorithm is within consultations with individual patients, particularly if they present with new onset of an alarm symptom such as haematuria, abdominal pain, weight loss, or appetite loss. Some clinical examples are shown in Box 1. The algorithm could also be used for systematic risk stratification for a population of patients aged 30–84 years. Patients at highest risk could be identified and recalled for a clinical assessment.
Box 1. Clinical examples
A 70-year-old male who is a heavy smoker and presents with haematuria has a 12.5% estimated risk of having renal tract cancer. If he also has unintentional weight loss, the estimated risk would be 24%.
A 50-year-old female who is a non-smoker and has haematuria, abdominal pain, and loss of appetite, has a 4.9% estimated risk of having renal tract cancer. If she also has anaemia, the estimated risk would be 9.5%.
A 75-year-old female who is a heavy smoker with previous cancer (apart from renal tract cancer) and has abdominal pain, weight loss, and loss of appetite has a 2.9% estimated risk of having renal tract cancer.
A 45-year-old male who is a non-smoker and has haematuria but no other symptoms, and who is not anaemic, has a 0.5% estimated risk of having renal tract cancer.
The 90th centile defined a high-risk group with a 2-year risk score of >0.1% (Table 5). There were 1412 new cases of renal tract cancer within this group, out of 1622 new cases identified in the validation cohort, which accounted for 87% of all new cases of renal tract cancer (sensitivity). The positive predictive value (PPV) with this threshold was 1.6%. Alternatively, using a threshold based on the top 1% of risk (that is, a 2-year risk score >7.7%) had a sensitivity of 56% and a PPV of 11%. The sensitivity of haematuria alone was 74% with a PPV of 7%.
Comparison of strategies to identify patients at risk of having a diagnosis of renal tract cancer in the next 2 years, based on the validation cohort
DISCUSSION
Summary
This research has developed and validated a new algorithm designed to quantify the absolute risk of having renal tract cancer, which is either currently present or likely to become manifest within 2 years. To the authors' knowledge, this is the first algorithm of its kind. For males, the final predictors were age, smoking status, haematuria, abdominal pain, weight loss, and anaemia. For females, the same predictors as in males were significant, plus history of prior cancer and appetite loss. Of all the symptoms, haematuria was the strongest predictor, which accords with existing knowledge. In the authors' opinion, this study has good face validity, since it has been conducted in the setting where the majority of patients in the UK are assessed, treated and followed-up. The algorithm has good face validity as it confirms the significance of established risk factors such as age, and smoking, and symptoms thought to indicate renal tract cancer, such as haematuria,3 weight loss, abdominal pain,1,2 and appetite loss (females only). As expected, the strongest predictor was haematuria, which had an adjusted hazard ratio of 119 in females and 148 in males compared with those without this symptom. On its own, however, it has a sensitivity of 75%, meaning that 25% of cases of renal tract cancer do not have this symptom recorded prior to diagnosis.
It was found that smoking was associated with an increased risk of renal tract cancer and the magnitudes of the risks were similar to those reported elsewhere.19 In particular, it was found that ex-smokers have a raised risk compared with non-smokers, though it was lower than that found for current smokers. While no evidence was found to support a preliminary finding that diabetes may be associated with an increased risk of renal tract cancer,22 or of an increased risk associated with antihypertensive treatment,21 previous cancers were found to be associated with an increased risk of renal tract cancer in females (previously thought to be related to past radiotherapy),23 but not in males.24
Strengths and limitations
Key strengths of the study include size, duration of follow-up, representativeness, and lack of selection, recall, and responder bias. UK general practices have good levels of accuracy and completeness in recording clinical diagnoses.38 Limitations include lack of formally adjudicated outcomes, information bias, and missing data. The numbers of patients with each type of renal cancer were too small to allow development of separate risk models for kidney and bladder cancer. Not all patients with symptoms will attend their GP, and in those who do, not all symptoms will be reported or recorded. The study database has linked cause of death from the UK ONS, and the study is therefore likely to have picked up the majority of cases of renal tract cancer, thereby minimising ascertainment bias. The incidence rate of renal tract cancer in the study population is close to national estimates, suggesting good ascertainment of cases. It is marginally higher than rates reported in UK cancer registry reports,1,2 which might reflect the improved ascertainment resulting from including diagnoses recorded in either the primary-care or the cause-of-death record. Patients who die of renal tract cancer will be included on the linked cause-of-death data. Patients diagnosed with renal tract cancer in hospital will have the information recorded in hospital discharge letters, which are sent to the GP and then entered into the patient's electronic record.
While this study is reliant on accuracy of information recorded by primary care physicians, the quality of information is likely to be good, since previous studies have validated similar outcomes and exposures using questionnaire data and found levels of completeness and accuracy in similar GP databases to be good.39,40 For example, a systematic review of General Practice Research Database (GPRD) studies reported that, on average, 89% of diagnoses recorded on the GP electronic record are confirmed from other data sources.39 Currently, however, there is limited information on the QResearch database regarding the precise type of cancer, which means this study has not been able to include the precise type of renal tract cancer in the outcome, the stage, or the grade. The QResearch database will be linked with information from cancer registries in the near future, which is likely to increase the accuracy and completeness of this information and also enable more analyses of prognosis for patients with a diagnosis of renal tract cancer.
This study has developed the algorithms in one cohort and validated them in a separate cohort that is representative of the patients likely to be considered for preventative measures. The algorithm performed well, with good discrimination and calibration; however, since the practices in the validation sample used the same computer system as those in the derivation sample, it is possible that the validation gave over-optimistic results. Following independent external validation and cost-effectiveness modelling (which is outside the scope of the present study), the algorithm could potentially be used in clinical practice to identify those at highest risk of having renal tract cancer, to facilitate more timely referral and investigation, and so help earlier identification of patients with renal tract cancer.
Comparison with existing literature
The renal tract cancer incidence rates in this study were comparable with those published using national cancer registry data for the UK for 2006–2008. The crude incidence rate for both sexes in the present study was 70 per 100 000 person-years, compared with 63 per 100 000 person-years for the UK.1,2 There was a similar pattern by age and sex. Both the study incidence rates of renal tract cancer and the UK rates were substantially higher than the rate of 22 per 100 000 reported by Jones et al using the GPRD.3 This might reflect clinical recording differences, since the GPRD study was conducted 10 years earlier. However, renal tract cancer incidence rates peaked in the UK during the 1990s and have declined by approximately one-third since then.1,2 Similarly, the overall incidence of haematuria in this study, for males and females, was higher than that in the GPRD study, although the difference was not as marked as the difference in cancer rates. The incidence rate of haematuria was 298 per 100 000 person-years in this study, compared with 245 in the GPRD study. Nonetheless, the positive predictive power of haematuria as a single symptom in the present study was similar to the GPRD study — the PPV was 6.5% for a diagnosis of renal tract cancer in the next 2 years in this study, compared with 5.7% over the next 3 years in the GPRD study. The sensitivity of haematuria as a symptom of renal tract cancer was 74% in the present study, which is higher than the corresponding figure of 56% from the GPRD study.
Implications for practice and research
This study has developed and validated a model that can be used to identify patients at highest risk of having renal tract cancer. The algorithm is based on simple clinical variables that can be ascertained in clinical practice. The algorithm performed well in a separate validation sample, with good discrimination and calibration.
National Institute for Health and Clinical Excellence (NICE) guidelines recommend urgent referral of anyone with painless haematuria,37 and while the present study provides some evidence for this approach, haematuria is not present in 25% cases, so alternative approaches are needed. An approach has therefore been proposed based on symptom complexes combined with risk factors such as smoking and age. The results could help inform the decision to undertake further diagnostic tests, such as intravenous urogram with CT or abdominal scanning of the abdomen. This new approach could help inform the current revision of the NICE guideline on suspected cancer,37 especially if a symptom-based approach is recommended and can include the symptoms that have identified in this study as being independently predictive, such as abdominal pain, weight loss, appetite loss, and anaemia. Further research is needed to assess whether use of this symptom-based tool can lead to earlier identification of renal tract cancer at a stage where curative treatment is more likely to be possible.
Although primarily designed to be used by GPs at the point of care to assess risk in symptomatic patients, and inform the decision to investigate or refer, the algorithm could also be used by members of the public via a simple web calculator, which could then prompt symptomatic patients to consult their GP. The algorithm could be integrated into GP clinical computer systems and used to generate a list of high-risk patients who could be then be recalled and systematically assessed. For example, the algorithm can identify the 10% of the population in which approximately 87% of all new renal tract cancer cases are likely to be diagnosed over the next 2 years. This paper has presented a table of possible thresholds along with the sensitivity, specificity, and positive and negative predictive values. This is intended to inform subsequent cost-effectiveness modelling and the choice of thresholds, which is outside the scope of this paper.
Acknowledgments
We acknowledge the contribution of EMIS practices who contribute to QResearch® and the University of Nottingham and EMIS for expertise in establishing, developing, and supporting the database. The software that implements the algorithms described in this paper is free for anyone to use under the terms of the GNU lesser GPL3. For those who wish to implement software in a closed source setting, then a licence fee is payable to ClinRisk Ltd.
Notes
Funding
This study was undertaken by ClinRisk Ltd. There was no external funding.
Ethics committee
All QResearch® studies are independently reviewed in accordance with the QResearch® agreement with Trent Multi-Centre Ethics Committee (UK).
Provenance
Freely submitted; externally peer reviewed.
Web calculator
Here is a simple web calculator to implement the renal tract cancer algorithm, which will be publicly available alongside the paper and open source software. http://www.qcancer.org/renal.
Competing interests
Julia Hippisley-Cox is professor of clinical epidemiology at the University of Nottingham and co-director of QResearch® – a not-for-profit organisation which is a joint partnership between the University of Nottingham and EMIS (leading commercial supplier of IT for 60% of general practices in the UK). Julia Hippisley-Cox is also a paid director of ClinRisk Ltd, which produces software to ensure the reliable and updatable implementation of clinical risk algorithms within clinical computer systems to help improve patient care. Carol Coupland is associate professor of medical statistics at the University of Nottingham and a paid consultant statistician for ClinRisk Ltd. This work and any views expressed within it are solely those of the co-authors and not of any affiliated bodies or organisations.
Discuss this article
Contribute and read comments about this article on the Discussion Forum: http://www.rcgp.org.uk/bjgp-discuss
- Received November 4, 2011.
- Revision received December 7, 2011.
- Accepted January 9, 2012.
- © British Journal of General Practice 2012
REFERENCES
In this issue


Jump to section
More in this TOC Section
Related Articles
Cited By...

