


Article Figures & Data
Figures
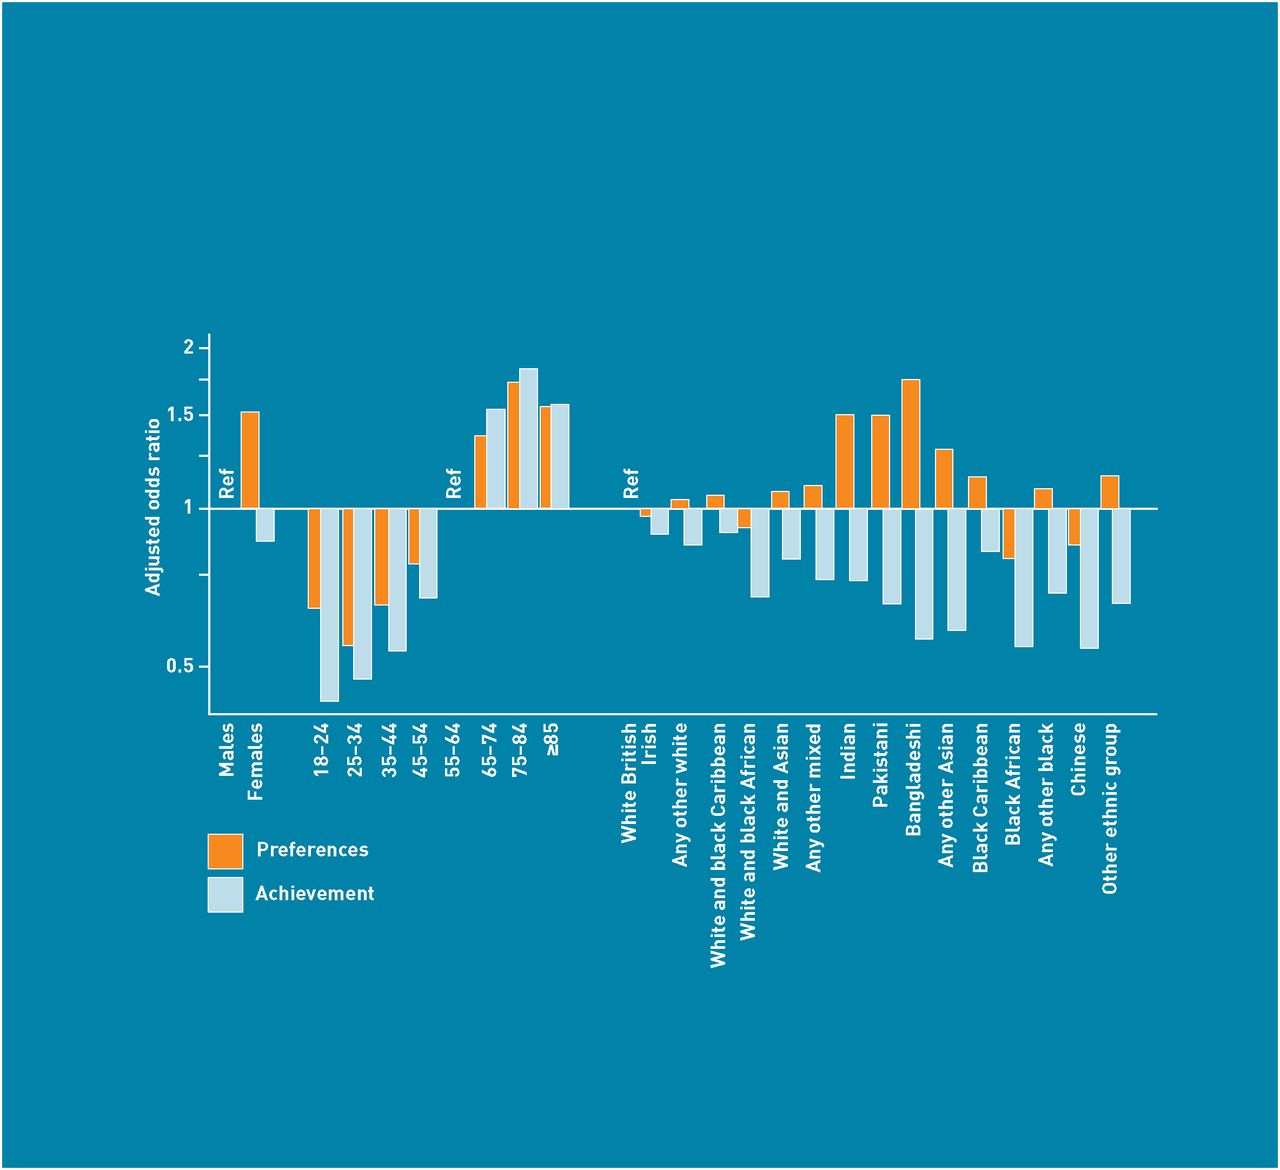
- Figure 1
Adjusted odds ratios of having preference for seeing a particular doctor, and success in achieving it most of the time (sex, age, and ethnicity).
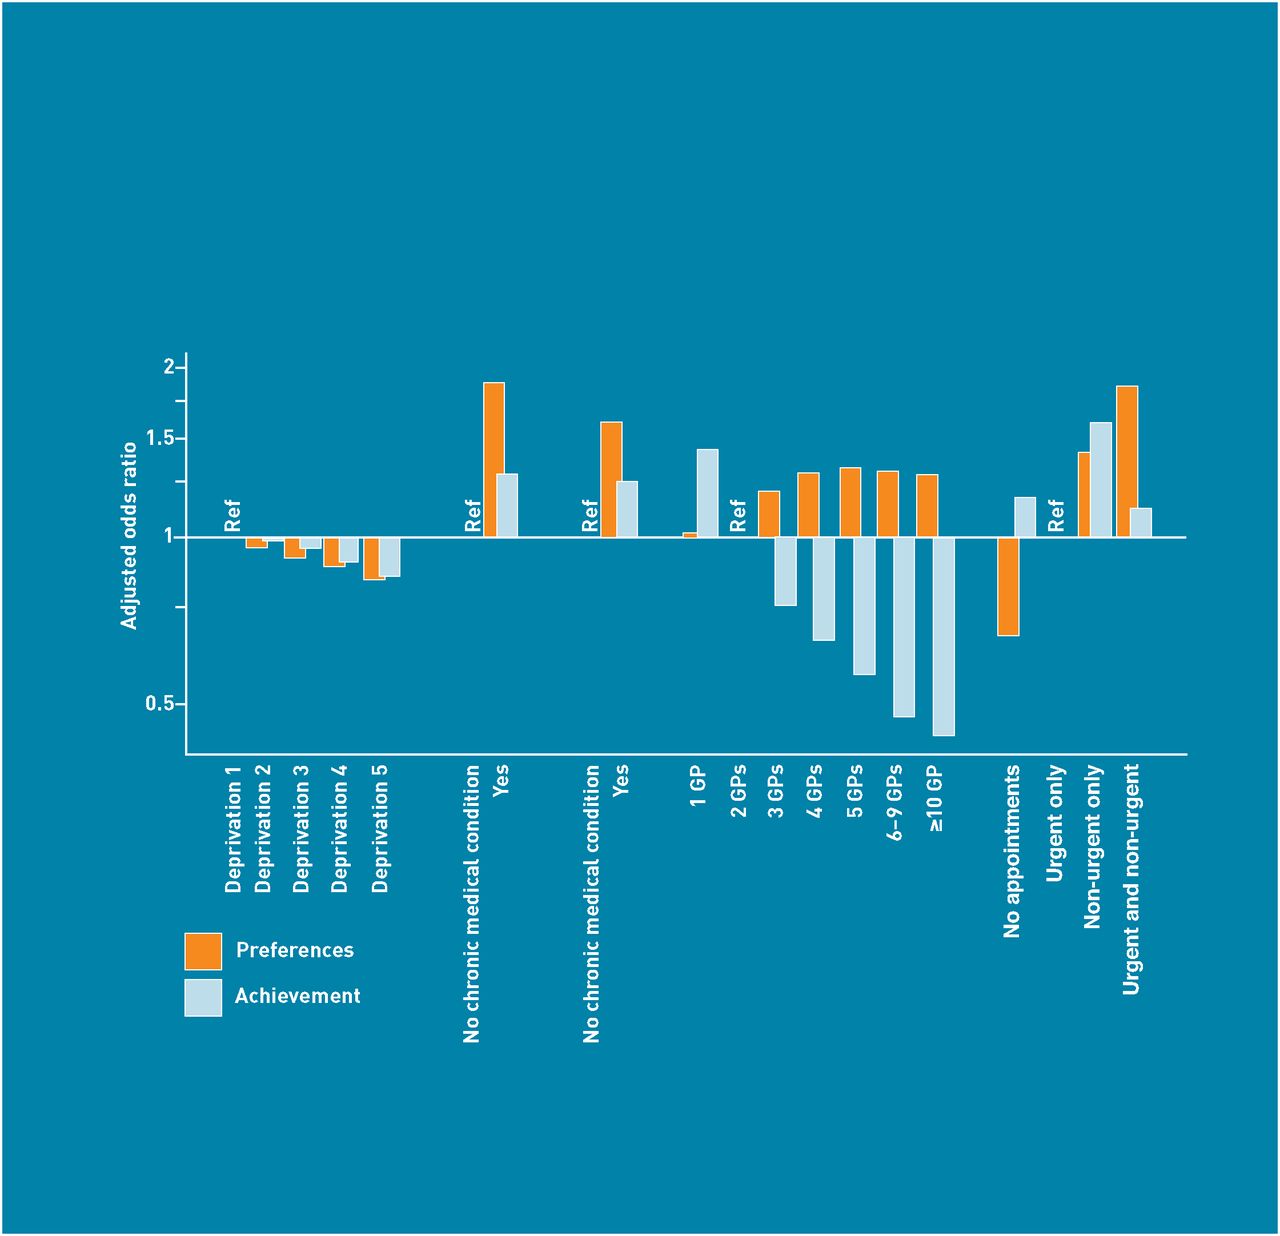
- Figure 2
Adjusted odds ratios of having preference for seeing a particular doctor, and success in achieving it most of the time (deprivation, chronic conditions, practice size, and appointment type).


Tables
- Table 1
Demographic characteristics of responders to the 2009/2010 General Practice Patient Survey
Characteristic n % All survey responders 2 169 718 100 Sex Male 897 326 42.4 Female 1 218 009 57.6 Age group, years 18-24 103 865 4.9 25-34 230 654 10.9 35-44 326 488 15.5 45-54 376 472 17.8 55-64 428 774 20.3 65-74 357 022 16.9 75-84 223 834 10.6 ≥85 66 621 3.2 Ethnic group (ONS 6) Ethnic group (ONS16) White White British 1 746 425 82 Irish 28 805 1.4 Any other white 86 278 4.1 Mixed White and Black Caribbean 4345 0.2 White and Black African 2808 0.1 White and Asian 4182 0.2 Any other mixed 5046 0.2 South-Asian Indian 53 464 2.6 Pakistani 29 056 1.4 Bangladeshi 9711 0.5 Any other Asian 21 270 1 Black Black Caribbean 24 095 1.1 Black African 29 936 1.4 Any other black 4750 0.2 Chinese Chinese 10 007 0.5 Other ethnic group Other ethnic group 69 665 3.3 Deprivation quintile 1 (affluent) 387 771 17.9 2 418 707 19.3 3 430 329 19.9 4 446 263 20.6 5 (deprived) 483 594 22.3 Presence of self-reported chronic medical condition No 948 565 49.9 Yes 951 323 50.1 Presence of self-reported long-standing psychological or emotional condition No 1 792 622 94.2 Yes 110 507 5.8 Number of practice GPs 1 259 957 12.1 2 347 707 16.2 3 285 727 13.3 4 281 408 13.1 5 257 185 11.9 6-9 651 996 30.2 ≥10 72 390 3.4 Type of appointments sought in previous 6 monthsa No appointments requested 570 480 26.3 Urgent only 554 818 25.6 Non-urgent only 271 794 12.5 Both urgent and non-urgent 772 626 35.6 ONS = Office for National Statistics.
↵a As reported by the patients (see Method).
Characteristic Weighted prevalencea (95% CI) Crude weighted ORa (95% CI) Adjusted ORb (95% CI) All survey responders 62.2 (61.9 to 62.4) N/A N/A Sex Male 56.3 (56.1 to 56.6) Reference Reference Female 67.5 (67.2 to 67.7) 1.60 (1.59 to 1.61) 1.50 (1.49 to 1.52) Age group, years 18-24 51.7 (51.1 to 52.2) 0.49 (0.48 to 0.50) 0.65 (0.64 to 0.66) 25-34 51.0 (50.6 to 51.3) 0.48 (0.47 to 0.48) 0.55 (0.54 to 0.56) 35-44 56.0 (55.6 to 56.3) 0.58 (0.58 to 0.59) 0.66 (0.65 to 0.67) 45-54 61.4 (61.1 to 61.7) 0.73 (0.72 to 0.74) 0.79 (0.78 to 0.80) 55-64 68.6 (68.3 to 68.9) Reference Reference 65-74 76.0 (75.8 to 76.3) 1.45 (1.44 to 1.47) 1.36 (1.35 to 1.38) 75-84 81.1 (80.8 to 81.4) 1.97 (1.94 to 2.00) 1.71 (1.69 to 1.74) ≥85 80.0 (79.5 to 80.4) 1.83 (1.78 to 1.88) 1.54 (1.50 to 1.58) Ethnic group (ONS 6) Ethnic group (ONS16) White White British 62.9 (62.6 to 63.2) Reference Reference Irish 65.1 (64.2 to 65.9) 1.10 (1.06 to 1.14) 0.97 (0.94 to 1.00) Any other white 57.5 (56.9 to 58.1) 0.80 (0.78 to 0.82) 1.03 (1.01 to 1.05) Mixed White and Black Caribbean 56.8 (54.8 to 58.9) 0.78 (0.72 to 0.84) 1.05 (0.97 to 1.14) White and Black African 52.2 (49.6 to 54.7) 0.64 (0.58 to 0.71) 0.92 (0.84 to 1.02) White and Asian 56.7 (53.8 to 59.6) 0.77 (0.69 to 0.87) 1.07 (0.99 to 1.16) Any other mixed 59.7 (57.7 to 61.7) 0.88 (0.81 to 0.95) 1.09 (1.02 to 1.18) South-Asian Indian 63.0 (62.2 to 63.9) 1.01 (0.97 to 1.04) 1.49 (1.45 to 1.53) Pakistani 61.4 (60.4 to 62.4) 0.94 (0.90 to 0.98) 1.49 (1.43 to 1.54) Bangladeshi 61.7 (60.2 to 63.2) 0.95 (0.89 to 1.01) 1.74 (1.64 to 1.84) Any other Asian 59.0 (57.9 to 60.1) 0.85 (0.81 to 0.89) 1.28 (1.23 to 1.33) Black Black Caribbean 61.9 (60.9 to 62.8) 0.96 (0.92 to 1.00) 1.14 (1.10 to 1.18) Black African 47.3 (46.4 to 48.2) 0.53 (0.51 to 0.55) 0.81 (0.78 to 0.83) Any other black 59.1 (57.2 to 61.1) 0.86 (0.79 to 0.93) 1.08 (0.99 to 1.17) Chinese Chinese 48.5 (47.0 to 50.0) 0.56 (0.52 to 0.59) 0.86 (0.81 to 0.90) Other ethnic group Other ethnic group 58.5 (57.9 to 59.1) 0.83 (0.81 to 0.85) 1.14 (1.12 to 1.17) Deprivation quintile 1 (affluent) 64.1 (63.7 to 64.5) Reference Reference 2 63.3 (62.9 to 63.6) 0.96 (0.95 to 0.98) 0.96 (0.95 to 0.97) 3 62.2 (61.8 to 62.6) 0.92 (0.90 to 0.94) 0.92 (0.91 to 0.93) 4 61.0 (60.6 to 61.3) 0.87 (0.86 to 0.89) 0.89 (0.88 to 0.90) 5 (deprived) 59.5 (59.1 to 60.0) 0.82 (0.81 to 0.84) 0.84 (0.83 to 0.85) Presence of self-reported chronic medical condition No 52.1 (51.7 to 52.4) Reference Reference Yes 74.8 (74.5 to 75.0) 2.73 (2.70 to 2.76) 1.87 (1.86 to 1.89) Presence of self-reported long-standing psychological or emotional condition No 61.3 (61.1 to 61.6) Reference Reference Yes 78.3 (77.9 to 78.7) 2.28 (2.23 to 2.33) 1.59 (1.57 to 1.62) Number of practice GPs 1 56.4 (55.6 to 57.2) 0.94 (0.90 to 0.97) 1.01 (0.97 to 1.05) 2 58.0 (57.4 to 58.6) Reference Reference 3 61.9 (61.3 to 62.5) 1.18 (1.13 to 1.22) 1.20 (1.15 to 1.25) 4 63.5 (62.9 to 64.1) 1.26 (1.22 to 1.30) 1.29 (1.24 to 1.35) 5 63.6 (63.0 to 64.2) 1.26 (1.22 to 1.31) 1.31 (1.26 to 1.37) 6-9 63.0 (62.6 to 63.4) 1.23 (1.19 to 1.27) 1.30 (1.25 to 1.34) ≥10 62.2 (60.7 to 63.6) 1.19 (1.11 to 1.27) 1.28 (1.19 to 1.37) Type of appointments sought in previous 6 monthsc No appointments requested 47.5 (47.2 to 47.8) 0.65 (0.64 to 0.66) 0.67 (0.66 to 0.68) Urgent only 58.3 (58.0 to 58.6) Reference Reference Non-urgent only 67.5 (67.1 to 67.9) 1.49 (1.46 to 1.51) 1.40 (1.39 to 1.42) Both urgent and non-urgent 73.5 (73.2 to 73.7) 1.98 (1.96 to 2.00) 1.85 (1.83 to 1.87) N/A = not applicable. ONS = Office for National Statistics. OR = odds ratio.
↵a Estimated from weighted unadjusted analysis; P<0.001 for all association (joint tests for categorical variables).
↵b Estimated from a single multivariate logistic regression model including all variables that appear in the table, plus a random practice intercept; P<0.001 for all associations (joint tests for categorical variables).
↵c As reported by the patients (see Method).
Characteristic Weighted prevalencea (95% CI) Crude weighted ORa (95% CI) Adjusted ORb 95% CI) All survey responders 71.8 (71.4 to 72.1) N/A N/A Sex Male 73.6 (73.2 to 74.0) Reference Reference Female 70.2 (69.9 to 70.6) 0.85 (0.84 to 0.86) 0.87 (0.86 to 0.88) Age group, years 18-24 59.8 (59.1 to 60.5) 0.43 (0.42 to 0.44) 0.43 (0.42 to 0.44) 25-34 60.2 (59.7 to 60.8) 0.44 (0.43 to 0.44) 0.48 (0.47 to 0.49) 35-44 63.6 (63.1 to 64.0) 0.50 (0.49 to 0.51) 0.54 (0.53 to 0.55) 45-54 69.8 (69.4 to 70.3) 0.67 (0.66 to 0.68) 0.68 (0.67 to 0.69) 55-64 77.7 (77.3 to 78.1) Reference Reference 65-74 84.3 (84.0 to 84.7) 1.55 (1.52 to 1.58) 1.53 (1.50 to 1.56) 75-84 86.5 (86.1 to 86.8) 1.84 (1.80 to 1.87) 1.82 (1.79 to 1.86) ≤85 85.3 (84.8 to 85.7) 1.66 (1.61 to 1.72) 1.56 (1.51 to 1.61) Ethnic group (ONS 6) Ethnic group (ONS16) White White British 73.7 (73.4 to 74.1) Reference Reference Irish 74.1 (73.2 to 75.1) 1.02 (0.97 to 1.07) 0.90 (0.86 to 0.94) Any other white 66.9 (66.2 to 67.5) 0.72 (0.70 to 0.74) 0.85 (0.83 to 0.88) Mixed White and Black Caribbean 61.8 (59.1 to 64.4) 0.58 (0.52 to 0.64) 0.90 (0.81 to 1.00) White and Black African 56.6 (53.4 to 59.8) 0.46 (0.41 to 0.53) 0.68 (0.60 to 0.78) White and Asian 63.4 (60.7 to 66.1) 0.62 (0.55 to 0.69) 0.81 (0.72 to 0.90) Any other mixed 62.4 (60.1 to 64.7) 0.59 (0.54 to 0.65) 0.74 (0.67 to 0.81) South-Asian Indian 60.7 (59.3 to 62.1) 0.55 (0.52 to 0.58) 0.73 (0.71 to 0.76) Pakistani 54.4 (52.9 to 55.9) 0.43 (0.40 to 0.45) 0.66 (0.63 to 0.69) Bangladeshi 50.2 (48.1 to 52.3) 0.36 (0.33 to 0.39) 0.57 (0.53 to 0.61) Any other Asian 56.8 (55.4 to 58.1) 0.47 (0.44 to 0.49) 0.59 (0.56 to 0.62) Black Black Caribbean 65.6 (64.2 to 67.0) 0.68 (0.64 to 0.72) 0.83 (0.79 to 0.87) Black African 52.3 (50.9 to 53.8) 0.39 (0.37 to 0.42) 0.55 (0.53 to 0.58) Any other black 58.0 (55.3 to 60.6) 0.49 (0.44 to 0.55) 0.70 (0.62 to 0.78) Chinese Chinese 56.2 (54.1 to 58.4) 0.46 (0.42 to 0.50) 0.55 (0.51 to 0.59) Other ethnic group Other ethnic group 60.6 (59.9 to 61.4) 0.55 (0.53 to 0.57) 0.66 (0.64 to 0.68) Deprivation quintile 1 (affluent) 74.3 (73.7 to 74.8) Reference Reference 2 74.1 (73.6 to 74.6) 0.99 (0.97 to 1.02) 0.99 (0.97 to 1.01) 3 72.3 (71.8 to 72.8) 0.90 (0.88 to 0.93) 0.95 (0.94 to 0.97) 4 69.6 (69.1 to 70.1) 0.79 (0.77 to 0.82) 0.91 (0.89 to 0.93) 5 (deprived) 67.0 (66.4 to 67.6) 0.70 (0.68 to 0.73) 0.86 (0.84 to 0.88) Presence of self-reported chronic medical condition No 66.3 (65.8 to 66.7) Reference Reference Yes 76.8 (76.4 to 77.1) 1.68 (1.66 to 1.70) 1.29 (1.27 to 1.30) Presence of self-reported long-standing psychological or emotional condition No 71.9 (71.5 to 72.2) Reference Reference Yes 75.3 (74.8 to 75.8) 1.19 (1.17 to 1.22) 1.25 (1.22 to 1.27) Number of practice GPs 1 78.5 (77.3 to 79.6) 1.10 (1.01 to 1.19) 1.42 (1.33 to 1.52) 2 76.9 (76.0 to 77.7) Reference Reference 3 74.5 (73.6 to 75.4) 0.88 (0.82 to 0.94) 0.76 (0.71 to 0.81) 4 73.4 (72.6 to 74.3) 0.83 (0.78 to 0.89) 0.66 (0.61 to 0.70) 5 72.0 (71.1 to 72.9) 0.77 (0.73 to 0.83) 0.57 (0.53 to 0.61) 6-9 69.7 (69.2 to 70.3) 0.69 (0.66 to 0.73) 0.48 (0.45 to 0.51) ≥10 68.8 (67.0 to 70.7) 0.67 (0.60 to 0.74) 0.44 (0.40 to 0.49) Type of appointments sought in previous 6 monthsc No appointments requested 73.6 (73.2 to 74.0) 1.23 (1.21 to 1.25) 1.17 (1.15 to 1.19) Urgent only 69.4 (68.9 to 69.8) Reference Reference Non-urgent only 78.8 (78.4 to 79.2) 1.64 (1.60 to 1.68) 1.59 (1.57 to 1.62) Both urgent and non-urgent 70.3 (69.9 to 70.7) 1.05 (1.03 to 1.06) 1.12 (1.10 to 1.13) N/A = not applicable. ONS = Office for National Statistics. OR = odds ratio.
↵a Estimated from weighted unadjusted analysis; P<0.001 for all association (joint tests for categorical variables).
↵b Estimated from a single multivariate logistic regression model including all variables that appear in the table, plus a random practice intercept; P<0.001 for all associations (joint tests for categorical variables).
↵c As reported by the patients (see Method).
In this issue


Jump to section
More in this TOC Section
Related Articles
Cited By...

