


Abstract
Background Laboratory tests are extensively used for diagnosis and monitoring in UK primary care. Test usage by GPs, and associated costs, have grown substantially in recent years.
Aim This study aimed to quantify temporal growth and geographic variation in utilisation of laboratory tests.
Design and setting Retrospective cohort study using data from general practices in the UK.
Method Data from the General Practice Research Database, including patient demographics, clinical details, and laboratory test results, were used to estimate rates of change in utilisation between 2005 and 2009, and identify tests with greatest inter-regional variation, by fitting random-effects Poisson regression models. The study also investigated indications for test requests, using diagnoses and symptoms recorded in the 2 weeks before each test.
Results Around 660 000 tests were recorded in 230 000 person-years of follow-up. Test use increased by 24.2%, from 23 872 to 29 644 tests per 10 000 person-years, between 2005 and 2009. Tests with the largest increases were faecal occult blood (121%) and C-reactive protein (86%). There was substantial geographic variation in test utilisation; GPs in some regions requested tests such as plasma viscosity and cardiac enzymes at a rate more than three times the national average.
Conclusion Increases in the use of laboratory tests have substantial resource implications. Rapid increases in particular tests may be supported by evidence-based guidelines, but these are often vague about who should be tested, how often, and for how long. Substantial regional variation in test use may reflect uncertainty about diagnostic accuracy and appropriate indications for the laboratory test. There is a need for further research on the diagnostic accuracy, therapeutic impact, and effect on patient health outcomes of the most rapidly increasing and geographically variable tests.
- clinical laboratory techniques
- economics
- evidence-based medicine
- physician practice patterns
- primary health care
- trends
INTRODUCTION
Laboratory tests are extensively used to make or support diagnoses and for chronic disease monitoring and management. In the UK, NHS laboratory services process in excess of 700 million requests annually, costing around £2.5 billion, and influence over 70% of clinical decisions.1 More than one-third of requests for laboratory tests are initiated in primary care.1 Testing is expensive for laboratories and practices, as it incurs substantial primary care staff and patient costs per specimen due to sampling, transport, result interpretation, and result communication.
Test use by GPs has seen particular growth recently.2 In part, this is due to the increasing use of point-of-care testing and the introduction of the Quality and Outcomes Framework (QOF), which offers financial rewards to GPs for more intensive monitoring of patients.3 Requests by GPs for biochemistry tests increased, on average, by more than 20% between 2002/2003 and 2005, with growth in demand predicted to continue.1 Concerns that many laboratory tests requested by GPs are unnecessary4,5 may be supported by considerable regional variation, both in the UK and worldwide.6–11 Wennberg’s ‘professional uncertainty hypothesis’ suggests that some geographic variation occurs because of regional differences in physicians’, or a regional opinion leader’s, beliefs about the value of the test or treatment, rather than geographic variations in patients’ need.12 Inappropriate test use has also been attributed to factors such as patient pressure and the use of ‘defensive’ diagnostic testing to reduce malpractice liability.13,14 As budgets tighten and UK GPs become responsible for commissioning decisions, and ultimately laboratory budgets, there will be increased incentives for more cost-effective use of laboratory tests.
The aim of this study was to identify the laboratory tests with the largest temporal growth and geographic variation in utilisation, using NHS GP records of use of routine laboratory tests requests between 2005 and 2009. The evidence supporting rapidly increasing use of specific tests is discussed, and possible causes of geographic variation are explored.
METHOD
Data from the General Practice Research Database (GPRD) were used; the GPRD holds approximately 5 million active patient records from 636 general practices across the UK. Information collected includes practice characteristics, patient demographics, records of primary care visits including symptoms and diagnoses, and data on laboratory test requests and results. The GPRD has an in-house data quality-assurance mechanism to ensure practices are ‘up to research standard’.
How this fits in
Test utilisation by UK GPs is thought to have grown rapidly in recent years with concerns that some tests are unnecessary. This study confirms these beliefs, with an overall increase in the utilisation of laboratory tests of 24.2% between 2005 and 2009. It also strengthens previous evidence indicating substantial geographic variation in laboratory test use.
Patients can have several registration periods if they move between GPRD practices. When this occurred, only data from the last registration period were used. A random sample was drawn of 100 000 patients registered with a GPRD general practice at any time from 1 January 1999 to 31 December 2008. Patients were excluded from the initial cohort if they left the practice or died before 1 January 2005 (n = 25 233), or left the practice or died before the practice was deemed ‘up to research standard’ (n = 924) from the initial cohort, leaving 73 843 patients for analysis. This was an ‘open’ cohort of variable size during the study period, because of births, deaths, and transfers.
Test results were recorded separately in the GPRD, even if requested as part of a panel, leading to multiple entries for the same test request. For example, when a full blood count was requested, red blood cell, white blood cell, and platelet counts were recorded separately. Results corresponding to the same test panel were regrouped and recorded as one test request (Appendix 1). Although the GPRD collects information solely from primary care, the results of tests carried out in secondary care and returned to the GP might be recorded within the GPRD. Therefore, tests that are unlikely to be requested by a GP, and some miscellaneous test groups, were excluded from the analyses (Appendix 2).
Test-utilisation rates were calculated by dividing the number of test results by the total person-years of follow-up. For each test, age–sex-standardised annual utilisation rates were calculated using direct standardisation with the population of England as the standard population. Standardisation ensures that observed differences in test rates are not simply due to differences in the age or sex of the population over time or between practices.15 Rates were expressed as tests per 10 000 person-years. To focus on the most common and economically important tests, the analysis was limited to laboratory tests with an average annual utilisation of more than 50 per 10 000 person-years. Tests with the largest increase in utilisation, in both relative and absolute terms, were identified.
Temporal changes and geographic differences in the demographics and frequency of patients undergoing testing were explored, and reasons for test use were identified, using information on symptoms and diagnoses, which are recorded in the GPRD using Read Codes. Because the Read Code system is complex, with numerous ways to code the same event,16 Read Code groupings (RCGs) supplied by the Information Services Division, NHS National Services Scotland were used.17 RCGs use headings based on the chapters of the International Classification of Diseases (ICD-10), to categorise around 80 000 Read Codes into around 260 more homogeneous groups. Probable reasons for test use were evaluated by examining the frequency of RCGs (including both new and chronic symptoms and diagnoses) recorded in the 14 days before the laboratory test. For each test, a rate ratio was calculated, comparing the relative frequency of RCGs recorded in patients who had that test (cases) compared with a cohort of patients matched on sex, age, and geographic region (controls), who underwent a different laboratory test in the same quarter of the year as the case. When possible, 10 controls were sampled for each case. Symptoms and diagnoses most strongly associated with the ordering of the test should lead to the largest rate ratios. Hand filtering was used to remove RCGs relating to administrative events (for example, patient reviewed) or related to the test itself (for example, urine sample taken). To focus on the most relevant symptoms and diagnoses, rate ratios were only calculated for those that were recorded in more than 50 patients in the 2 weeks preceding the test.
Geographic variation in the average rate of test utilisation from 2005 to 2009 among 13 UK regions was explored using Poisson regression models, allowing for between-region variation in test utilisation. Calculating variance estimates from random effects Poisson regressions rather than directly from the observed rates is a more statistically rigorous approach, which appropriately adjusts for chance variability. The most variable tests are those with the largest between-region standard deviation. Analyses were conducted using Stata (version 11).
RESULTS
Table 1 shows that cohort demographics (age, sex, and practice location) were stable during the study period, although fewer practices in the North East, East Midlands and Yorkshire and Humber regions contributed data to the GPRD than in other areas. Around 660 000 tests were recorded in 230 000 person-years. The number of practices and patients, and tests ordered, increased substantially throughout the study period.
Cohort characteristics
Table 2 shows the annual utilisation rate for each test, together with the relative and absolute utilisation increases, and the between-region standard deviation. Test use increased by an average of 24.2% during the study period, from 23 872 to 29 644 per 10 000 person-years. Between 2005 and 2009, several tests, including faecal occult blood, C-reactive protein, and haematinics, had relative increases of more than 75%. The largest absolute increases, in excess of 680 tests per 10 000 person-years, were observed for creatinine, urea and electrolytes, full blood count, and liver function test. Few tests decreased in utilisation, and the magnitude of decreases was modest in both absolute and relative terms.
Temporal and geographic variation in laboratory tests, tests per 10 000 person-years (age–sex standardised)
Table 3 displays a more detailed analysis of testing patterns and reasons for testing, for the five tests with the greatest relative increases in utilisation. Increased utilisation appeared to result mainly from testing more patients, rather than from testing the same patients more frequently. C-reactive protein was the only test for which there was a clear increase in tests per patient tested between 2005 and 2009 (1.31 versus 1.43; P = 0.002). Symptoms and diagnoses recorded relatively more frequently in the 14 days before the test request corresponded to the expected indications for these tests, but in a high proportion of cases no diagnoses or symptoms were recorded.
Details of test use for relatively increasing tests
There was substantial geographic variation in the use of some tests (Figure 1). For example, the average rate of plasma viscosity testing varied widely between regions; no testing was recorded in two regions (East of England, South East Coast), while 770 tests per 10 000 person-years were recorded in the South West region. In some regions, rates of plasma viscosity, cardiac enzymes, and blood trace elements/vitamins testing were more than three times the national average. The test with least geographic variability, thyroid function, had a utilisation rate varying from 1935 tests per 10 000 person-years in the East Midlands to 2845 per 10 000 person-years in Northern Ireland.

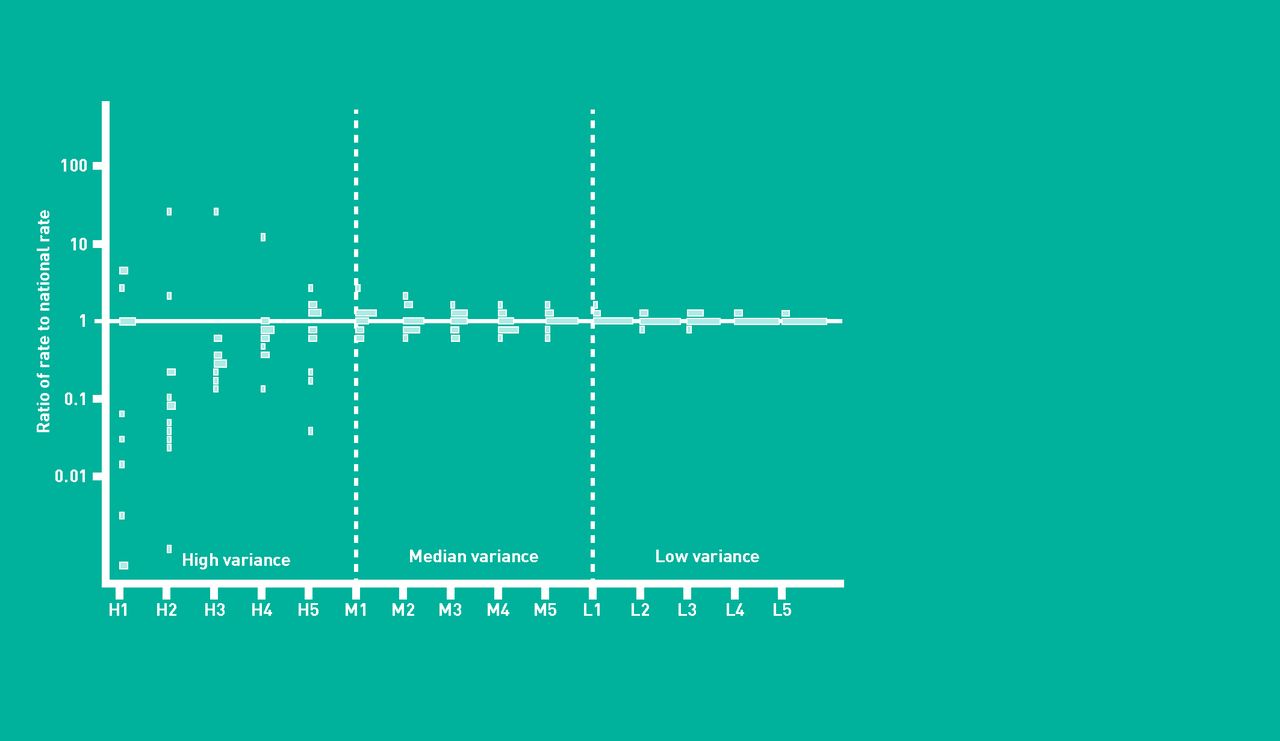
Regional variation in test-ordering behaviour, stratified by high, median, and low variance. For H1, H2, no procedures were observed in some regions. The lowest bar for this procedure refers to a notional rate of 0.1 procedures per 10 000 person-years.
Geographic variation may be partly due to more frequent testing of the same patients (Table 4). Patients in regions of high use were tested more frequently for plasma viscosity (1.60 versus 1.25 tests per person per year; P<0.001) and cardiac enzymes (1.48 versus 1.04 tests per person per year; P = 0.01) than patients in areas of low use. Other geographically variable tests showed trends in the same direction. There were minor differences in the age profile of patients tested in regions of high use; for example, patients for whom blood trace elements/vitamins and clotting tests were ordered were older in high utilisation regions.
Details of test use for geographically variable tests
DISCUSSION
Summary
Between 2005 and 2009, utilisation of laboratory tests in primary care increased by 24.2%, from 23 872 to 29 644 tests per 10 000 person-years, after accounting for changes in the age and sex composition of the cohort. The largest relative increases, more than 75% over the 5-year study period, were observed in faecal occult blood, C-reactive protein, and haematinic tests. Most of the largest relative temporal increases reflect the testing of more patients rather than testing the same patients more frequently. In absolute terms, substantial increases of more than 650 tests were found in the urea and electrolytes, full blood count, and liver function tests. There was substantial geographic variation; in some regions, rates of plasma viscosity, cardiac enzymes, and blood trace elements/vitamins testing were more than three times the national average.
Strengths and limitations
A large sample of patients afforded substantial statistical power to investigate temporal trends and geographic variations. Several studies have found GPRD data to be of high accuracy and completeness when compared to other databases.18–20 The GPRD is a voluntary scheme, but participating general practices are quality assured and broadly representative of the UK population,21 suggesting the present results are reliable and generalisable. GPRD guidelines ask that GPs record all clinically ‘significant’ test results.22 Therefore, it is possible that tests within normal range have not been recorded in the database, and improvements in recording, specifically movement to electronic test recording, might be responsible for the temporal trends observed. However, electronic reporting of laboratory tests was used in 90% of GPRD practices by 2005.23 Furthermore, during preliminary analysis of selected tests (C-reactive protein, folate level, glycosylated haemoglobin (HbA1c), thyroid stimulating hormone, serum creatinine, blood glucose, calcium, alkaline phosphatase), it was found that the proportion of tests with numerical results recorded in the GPRD (85.9%, 93.6%, and 94.6% in 1995–1999, 2000–2004, and 2005–2009 respectively), and the proportion of results within the normal range (54.6%, 71.3%, and 73.0 respectively) had reached a plateau by 2005. However, given the small number of GPRD practices in some regions (for example, North East), geographic variations may be influenced by differences in recording completeness.
The GPRD does not require GPs to record a reason or ‘problem heading’ for ordering a test. Some insight into reasons for test utilisation was provided in this study by presenting symptoms and diagnoses that were relatively more frequently recorded in the 2 weeks before test ordering. However, these results must be interpreted with caution, owing to the large proportion of tests where no reason for testing could be ascertained. Furthermore, this approach may be better able to detect acute indications, rather than chronic-disease-monitoring activity, because the GPRD guidelines require that only new occurrences of symptoms or episodes of illness are recorded.22
Comparison with existing literature
There are no official statistics on laboratory test usage in the UK, and to the authors’ knowledge this is the first study of its kind in the UK primary care sector. Data from the Bettering the Evaluation and Care of Health study, conducted in Australia, reported an annual increase in utilisation of pathology tests of 7% between 2004 and 2008.24 Several UK-based and international studies have concluded that regional variation exists in primary care test-ordering behaviour.6–11 One of these studies observed large differences, probably driven by clinical practice variation,10 in the patterns of pathology test requests of 22 UK general practices. Some studies have investigated variations at the clinician8 or practice9,10 level; however, individual practices or practitioners could not be identified within the present study.
Implications for practice and research
This study has demonstrated widespread increases in test utilisation, some of which will be appropriately generated through adherence to guidelines for chronic disease management, but others (for example, regional variations in plasma viscosity use) may reflect a growth in inappropriate testing. For example, the introduction of clinical guidelines for rheumatoid arthritis, based on evidence from randomised controlled trials, recommending ‘regular’ use of C-reactive protein testing for monitoring and optimisation of therapy, particularly in patients with recent onset of disease, might be one factor underlying the large increases in the use of this test during the study period. Increases in the use of faecal occult blood tests might be directly or indirectly related to the introduction of the national bowel cancer screening programme in 2006. Results from the screening programme are not typically recorded in GP records, but may directly contribute to some of the increase observed in the present study. Furthermore, the screening programme has probably led to greater patient pressure for testing and increased awareness among clinicians around the appropriate indications for testing. Conversely, the decrease in GP-initiated pregnancy testing that was observed in this study might reflect an increased reliance on results from home pregnancy testing kits.25 The QOF,3 which directly encourages the use of some tests in the present study (for example, HbA1c and thyroid function tests), is likely to be responsible for some of the increases seen in this study. However, the widespread increases in test use, transcending both QOF and non-QOF tests, suggest that other mechanisms play an important role in driving utilisation.
For some tests, the observed extensive regional variation might indicate that GPs are uncertain about the appropriate rate of usage. Alternatively, variation in local laboratory policies rather than GP preferences, for example differences in the numerical criteria used by laboratories when deciding whether a blood film is necessary,26 may drive geographic variation. It is unclear whether this variation reflects inappropriate testing in regions of high use, or, conversely, failure to provide effective care in regions of low use; however, exploration of geographic variations in test use may help identify priorities for future research. For example, plasma viscosity tests in patients with suspected rheumatoid arthritis and other musculoskeletal disorders varied markedly by region. While plasma viscosity testing might have some prognostic value in arthritis,27 it is not recommended by the National Institute for Health and Clinical Excellence’s (NICE’s) guidelines for rheumatoid arthritis.28
Guidelines are available to disseminate knowledge about appropriate test use to practitioners.29–31 However, research suggests that they generally lag behind best practice, are often supported by poor evidence, and GP adherence may be low.32–34 Numerous other, more intensive, interventions, such as tailored education/feedback,35–38 decision support,39,40 redesign of test-order forms,41 and physician quality improvement,42 have been shown to effectively reduce demand. However, such interventions can be costly, and in some cases the savings made may be less than the programme cost.43
The present findings highlight the need for research on the appropriate use of laboratory tests for diagnosis, treatment monitoring, and prognosis in primary care, at the level of both practices and clinicians. Where there is relatively strong evidence that the test has good accuracy (for example, C-reactive protein for monitoring disease activity in rheumatoid arthritis), the key questions for clinicians and policy makers relate to better definition of the patient subgroups that should be tested, the optimal interval between screening or monitoring tests, and the optimal duration of monitoring. In the absence of such information, vague guideline recommendations that patients should be monitored ‘regularly’, or until ‘treatment has controlled the disease’, may continue to foster the large increases in test use observed since 2005.44 For other tests, such as plasma viscosity, where regional variation in test use is highest and evidence may be poor quality or sparse, additional primary diagnostic/prognostic accuracy studies and systematic reviews are needed to inform appropriate policy.
Acknowledgments
The authors would like to thank Chris Salisbury and Tjeerd Van Staa for their comments an earlier draft of this paper and Tarita Murray-Thomas for advice on the GPRD dataset.
Appendix 1. Groupings of tests
| Battery | Test unit |
|---|---|
| Full blood count | Eosinophil count |
| Haemoglobin | |
| Mean corpuscular haemoglobin | |
| Mean corpuscular haemoglobin concentration | |
| Mean corpuscular volume | |
| Monocyte count | |
| Neutrophil count | |
| All platelet tests | |
| Red blood cell count | |
| Total white blood cell count | |
| Lymphocyte count | |
| Full blood count | |
| Packed cell volume | |
| Basophil count | |
| Differential white cell count | |
| Red blood cell size | |
| Creatinine, urea and electrolytes | Serum creatinine |
| Potassium | |
| Sodium | |
| Urea blood | |
| Urea and electrolytes | |
| Renal function tests | |
| GFR (calculated based on MDRD) | |
| Serum electrolytes | |
| Liver function test | Albumin |
| Alkaline phosphatase | |
| Alanine aminotransferase | |
| Aspartate aminotransferase | |
| Bilirubin | |
| Gamma glutamyl transpeptidase | |
| Total protein | |
| Liver function tests | |
| Serum globulin (calculated) | |
| Liver enzymes | |
| Lipid profile | Serum cholesterol |
| High-density lipoprotein (HDL) | |
| Low-density lipoprotein (LDL) | |
| Triglycerides | |
| Blood lipids | |
| HDL:LDL ratio | |
| Thyroid function tests | Thyroxine |
| Thyroid stimulating hormone | |
| Thyroid function | |
| Free tri-iodothyronine (T3) | |
| Free thyroxine | |
| Serum T3 level | |
| Urine MCS | Urine test |
| Midstream specimen of urine | |
| Microscopy culture and sensitivities | |
| Urine dipstick | Urine ketones |
| Urinalysis glucose | |
| Urinalysis protein | |
| Urine dipstick for glucose | |
| Urine dipstick for protein | |
| Urine dipstick for ketones | |
| Urine dipstick for blood | |
| Urine dipstick for pH | |
| Serum troponina | Serum troponin T |
| Serum troponin I | |
| Glucose | Blood glucose |
| Glucose tolerance test | |
| Fasting glucose | |
| Bone profile | Serum inorganic phosphate |
| Calcium | |
| Calcium adjusted | |
| Bone studies | |
| Haematinics | B12 levels |
| Serum ferritin | |
| Folate | |
| B12 and folate | |
| RBC folate | |
| Iron studies | Serum iron studies |
| Total iron-binding capacity | |
| Iron studies | |
| Clotting tests | Clotting tests |
| Prothrombin time | |
| Partial thromboplastin time | |
| Thrombin time | |
| INR | |
| Sex hormones | Female sex hormones |
| Follicle stimulating hormone | |
| Luteinising hormone | |
| Male sex hormones | |
| Oestradiol level | |
| Progesterone | |
| Sex hormone binding globulin | |
| Testosterone | |
| Urine biochemistry | Urine biochemistry |
| Urine microalbumin | |
| Drug levels | |
| Other drug levels | |
| Vaginal swab | Vaginal swab |
| High vaginal swab | |
GFR = glomerular filtration rate. INR = international normalised ratio. MCS = microscopy, culture and sensitivities. MDRD = modification of diet in renal disease. RBC = red blood cell.
↵a Utilisation less than 50 tests per 10 000 person-years and so not included in Table 2.
Appendix 2. Tests that are excluded from the study tables/figures
| Test | Reason |
|---|---|
| Other laboratory tests | Miscellaneous |
| Other bacteriology tests | Miscellaneous |
| Large unstained cells | Miscellaneous |
| Infection titres | Miscellaneous |
| Other autoantibodies | Miscellaneous |
| Histology | Miscellaneous |
| Other biochemistry test | Miscellaneous |
| Other immunology | Miscellaneous |
| Other drug levels | Miscellaneous |
| Other swab | Miscellaneous |
| Uric acid blood level | Secondary care |
| Serum chloride | Secondary care |
| Serum bicarbonate | Secondary care |
| Anion gap | Secondary care |
| Blood gases | Secondary care |
| Ascitic fluid examination | Secondary care |
| Schilling test | Secondary care |
Notes
Funding
This project was funded by the MRC Methodology Research Panel Grant ‘Making diagnostic systematic reviews fit for purpose: improving decision making in the NHS’ (Grant Number: G0801405).
Ethical approval
None required.
Provenance
Freely submitted; externally peer reviewed.
Competing interests
The authors have declared no competing interests.
Discuss this article
Contribute and read comments about this article on the Discussion Forum: http://www.rcgp.org.uk/bjgp-discuss
- Received January 5, 2012.
- Revision received May 28, 2012.
- Accepted September 13, 2012.
- © British Journal of General Practice 2013
REFERENCES
In this issue


Jump to section
Keywords
More in this TOC Section
Related Articles
Cited By...

