


Abstract
Background More accurate and recent estimates of adverse events in primary care are necessary to assign resources for improvement of patient safety, while predictors must be identified to ameliorate patient risk.
Aim To determine the incidence of recorded iatrogenic harm in general practice and identify risk factors for these adverse events.
Design and setting Cross-sectional sample of 74 763 patients at 457 English general practices between 1 January 1999 and 31 December 2008, obtained from the General Practice Research Database.
Method Patient age at study entry, sex, ethnicity, deprivation, practice region, duration registered at practice, continuity of care, comorbidities, and health service use were extracted from the data. Adverse events were defined by Read Codes for complications of care (Chapters S, T, and U). Crude and adjusted analyses were performed by Poisson regression, using generalised estimating equations.
Results The incidence was 6.0 adverse events per 1000 person-years (95% confidence interval [CI] = 5.74 to 6.27), equivalent to eight adverse events per 10 000 consultations (n = 2 540 877). After adjustment, patients aged 65–84 years (risk ratio [RR] = 5.62, 95% CI = 4.58 to 6.91; P<0.001), with the most consultations (RR = 2.14, 95% CI = 1.60 to 2.86; P<0.001), five or more emergency admissions (RR = 2.08, 95% CI = 1.66 to 2.60; P<0.001), or the most diseases according to expanded diagnosis clusters (RR = 8.46, 95% CI = 5.68 to 12.6; P<0.001) were at greater risk of adverse events. Patients registered at their practice for the longest periods of time were less at risk of an adverse event (RR = 0.40, 95% CI = 0.35 to 0.47; P<0.001).
Conclusion The low incidence of recorded adverse events is comparable with other studies. Temporal sequencing of risk factors and case ascertainment would benefit from data triangulation. Future studies may explore whether first adverse events predict future incidents.
INTRODUCTION
The epidemiology of adverse events occurring in primary care in England and other countries remains uncertain, although the burden to the health system is considerable.1 Evidence is limited and of inconsistent quality.1,2 In this article, adverse events are defined as temporary or permanent injuries caused by medical management that are not due to underlying disease nor are expected outcomes of treatment.3–5 These events, also collectively referred to as iatrogenic harm, can be caused by medical errors arising from actions or omissions that are unanticipated and unintended and should not recur.6 For effective patient safety surveillance and successful prevention of patient harm, baseline estimates of adverse events are needed.
One financially prudent and practical approach to gauging the nature and extent of adverse events in the primary care setting is to use data collected routinely during patient care. Designated diagnosis codes for complications of care are readily available in Read Codes, the current standard clinical classification system for English primary care. Thus it is possible to measure the rate of patient safety incidents from these data.
When used in conjunction with other data sources, estimates based on routinely recorded data would reduce the effects of deficits inherent to individual sources and measurement methods.7,8
Research on iatrogenic harm in non-acute care has focused on drug-related events and tended to rely on data from a single care setting and obtained from a limited number of sources, resulting in potential under-estimation of the true rate of patient harm.9–11 A comprehensive estimate of adverse events in primary care is lacking, especially as existing safety monitoring systems such as the National Reporting and Learning System are inadequate for detecting events in the primary care setting, and may be affected by under-reporting.12,13 Other methods for monitoring and learning from adverse events, at the practice level, include significant event audits and trigger tools but they also have limitations.14–16
There are also gaps in knowledge about risk factors for adverse events occurring in primary care. Certain patient groups are more likely to experience adverse events, including older patients and patients with complex care needs, or patients of ethnic minorities.17–19 However, the relationships between other characteristics, such as continuity of care, and patient harm, are less well established.20,21 This observational study aims to quantify the rate of adverse events recorded in English primary care and identify predictors for iatrogenic harm from routinely collected electronic health data.
METHOD
Sources of data
A random sample from the General Practice Research Database (GPRD; superseded by the Clinical Practice Research Datalink, since April 2012) was obtained under a Medical Research Council licence for academic institutions. The GPRD contains representational coverage of the English population and is well validated for health services research.22–24 Patient harm and side-effects from drugs have been well investigated using GPRD data.22,25,26 However, fewer studies have taken advantage of the longitudinal nature of the database to explore non-drug-related adverse events.26
How this fits in
The epidemiology of patient safety incidents in primary care remains inconclusive, with fluctuating estimates and a narrow focus on drug-related harm. This study presents an estimate of adverse events, using standardised clinical diagnosis codes; the low incidence of recorded harm is comparable with other studies. The results demonstrate the potential use of routinely collected data for active safety surveillance, and identify some of the risk factors that may be associated with iatrogenic harm.
Patients were excluded from the study if their sex, registration date, year of birth, or place of residence (only valid if England) was invalid or missing. From 100 000 patients in the original dataset, the study sample contained records for 74 763 patients registered at 457/584 general practices during the study period (1 January 1999 to 31 December 2008). The reason for the majority of exclusions was invalid place of residence (Northern Ireland, Scotland, or Wales).
Included variables
The variables of interest were age at study entry, sex, ethnicity, deprivation status, practice region, length of time registered at the general practice, continuity of care, comorbidities, and health service use. Ethnicity and social deprivation (Index of Multiple Deprivation [IMD] 2007 scores) information was only available for patients who had one or more admission recorded in integrated Hospital Episode Statistics data. Continuity of care was measured by the Bice and Boxerman’s Continuity of Care (COC) Index.27 The COC score is derived from the number of consultations at the general practice or by telephone that a patient has with individual doctors and nurses during a given time period.27 Health service use was measured by the number of consultations (at the general practice, or by telephone or home visit with a GP or nurse), referrals, and admissions throughout the study period.
Comorbidities were identified using a modified Charlson score and measures derived from the Johns Hopkins Adjusted Clinical Groups (ACG) case-mix system. The Charlson Index is widely used in health research and well validated in different populations, although it has relatively little documented use in English general practice.28–30 Khan et al (2010) adapted Deyo et al’s31 modified Charlson Index scores for Read Codes.30 This adaptation was used to calculate patients’ cumulative Charlson score, to produce a composite comorbidity measure (whether a patient had one or more of the diseases or conditions included in the Charlson Index), and to create 17 binary disease flags based on the Charlson scoring method. The ACG system has been applied internationally, including in English general practice, to predict future healthcare use.32–38 Five ACG measures were included in this study: Aggregated Disease Groups (ADGs); Collapsed Aggregated Diagnosis Groups (CADGs); Major Expanded Diagnosis Clusters (MEDCs); Expanded Diagnosis Clusters (EDCs); and Resource Utilization Bands (RUBs).
Adverse events were defined by designated diagnosis codes for complications of care from three Read Code chapters for external causes of injury and poisoning, including complications of medical and surgical care. The Read chapters were: ‘Injury and Poisoning’ (Chapter S); ‘Causes of injury and poisoning’ (Chapter T); and ‘External causes of morbidity and mortality’ (Chapter U).39
Data cleaning and processing
To reduce the inclusion of invalid adverse events attributable to care not from the patient’s current general practice, events recorded as occurring before or during a patient’s first consultation at their practice were excluded. Where patients had multiple Read-Coded complications of care for a single consultation, Read terms and classifications guided further investigation and assignment of adverse event category. With a dearth of data on suitable ‘washout’ periods for studies on adverse events in primary care, an arbitrary interval of <30 days was used to distinguish between new adverse events and existing (related or duplicate) events. This time period was selected after examining the time to next adverse event in patients who had one or more adverse event and the diagnoses of these events.
Statistical methods
Given potential clustering effects of multiple adverse events per patient, a continuous outcome measure was applied in the form of the rate of adverse events per patient. Using Poisson regression, clustering of patients at practices was managed by applying the generalised estimating equation (GEE) method. The log of patients’ follow-up time (in years) was included as an offset term in the models; the length of time that participants contributed to the study was calculated as the end date (date of death, transfer out of general practice, or study end date, whichever occurred first) minus the date that participants entered the study (study start date or first registration date at the general practice if date of birth was after 1 January 1999, whichever occurred last). The number of days was then converted into years and log transformed. All analyses were performed using SAS (version 9.2). Regression analyses were performed using SAS’s ‘PROC GENMOD’ procedure.
RESULTS
Incidence of adverse events
Patients were followed up for a total of 341 261 person-years. The average follow-up time for patients who had one or more adverse event was 9 years (standard deviation [SD] = 2.47 years), compared with 7 years (SD = 3.52 years) for patients who did not have any adverse events, z = 21.9, P<0.001. There were 2048 adverse events (1817 adverse event codes) recorded in 1774 patients at 387 general practices between 1999 and 2008. This estimate corresponds to 2.4% of the study population experiencing one or more adverse event during the study period (n = 74 763). The overall incidence was 6.0 adverse events per 1000 person-years (95% confidence interval [CI] 5.74 to 6.27), or 8.0 adverse events per 10 000 consultations (n = 2 540 877). The majority of patients who experienced an event had one adverse event during the study period (87.7%, n = 1774).
Out of all the adverse events recorded, 72.1% were represented by 10 Read Codes relating to surgery or medication (n = 1477/2048). These adverse events fell into the three categories of postoperative infection, including wound infection (Read Code SP25., n = 630/1477), postoperative pain (Read Code SP2y., n = 154/1477), and adverse drug effects or reactions (Read Code TJ…, n = 693/1477). Drug types specifically identified in the 10 most frequently recorded adverse events were beta-blockers (7.18%; n = 106/1477), statins (6.91%; n = 102/1477), angiotensin-converting-enzyme inhibitors (5.89%; n = 87/1477), and salicylates (5.82%; n = 86/1477).
The rate of adverse events increased from 3.79 events per 1000 person-years (95% CI = 3.05 to 4.66) in 1999 to 7.60 events per 1000 person-years (95% CI = 6.77 to 8.51) in 2007 (Figure 1). Throughout this period, the rate of adverse events was lower in male patients, who had an overall rate of 5.54 events per 1000 person-years (n = 854/2048; 95% CI = 5.18 to 5.93) compared with 6.38 events per 1000 person-years (n = 1194/2048; 95% CI = 6.02 to 6.75) in female patients.
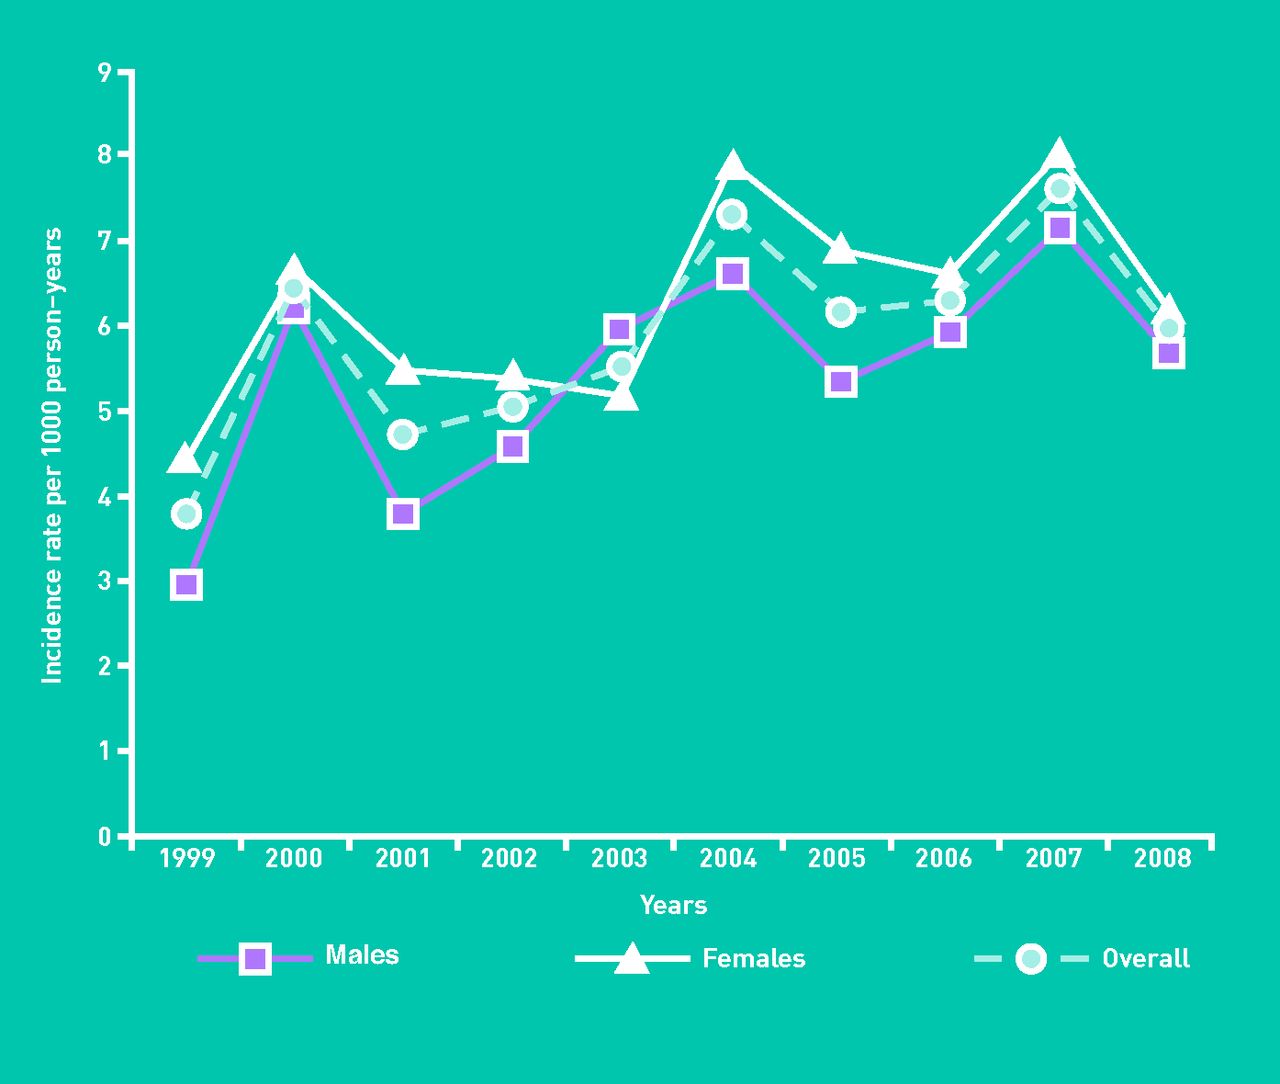
Incidence of recorded adverse events by sex and year, per 1000 person-years.
Overall, the highest rate of events occurred in the oldest patients (aged ≥85 years), who experienced 18.8 events per 1000 person-years (95% CI = 16.0 to 21.9). There were fluctuations in the rate of adverse events between age groups over the study period, especially in patients aged ≥85 years when they entered the study, in whom the rate of events ranged from 9.21 events per 1000 person-years (95% CI = 3.70 to 19.0) in 2001 to 31.7 events per 1000 person-years (95% CI = 21.9 to 44.3) in 2007 (Figure 2).

Incidence of recorded adverse events by age group and year, per 1000 person-years.
Unadjusted analyses
In bivariate analyses, all variables were significant at the 95% level, except for deprivation status and mild liver disease (Table 1). No patients had a recording of autoimmune deficiency disease, so this comorbidity variable was excluded from further analyses and is not reported.
Risk factors for reported adverse events: crude results from Poisson regression using the generalised estimating equations method
Patients most at risk of adverse events were aged 65–84 years when they entered the study, compared with other age groups (risk ratio [RR] = 11.9, 95% CI = 9.90 to 14.30; P<0.001), female (RR = 1.31, 95% CI = 1.20 to 1.43; P<0.001), or registered at practices in the North East (RR = 1.46, 95% CI = 1.05 to 2.04; P = 0.026) or South Central regions (RR = 1.45, 95% CI = 1.04 to 2.04; P = 0.030), compared with elsewhere in England.
Patients registered at their practice for the longest lengths of time (RR = 1.36, 95% CI = 1.18 to 1.57; P<0.001), with the highest COC scores (RR = 7.27, 95% CI = 4.66 to 11.30); P<0.001), or who had a high number of consultations at the general practice, or by telephone or home visit (RR = 7.79, 95% CI = 6.39 to 9.49; P<0.001) were also at greater risk of adverse events. Patients of unknown ethnicity were statistically least at risk of adverse events compared with patients of known ethnicity (RR = 0.56, 95% CI = 0.34 to 0.90; P = 0.016). Elevated comorbidity status, measured by higher Charlson Index scores (RR = 1.05, 95% CI = 1.05 to 1.06; P<0.001) and more EDCs (RR = 17.80, 95% CI = 13.20 to 23.9; P<0.001), was also associated with increased risk of adverse events. Further results by comorbidities are available from the corresponding author on request.
Less than 1% of patients who had one or more adverse event during the study period did not have any consultations with a doctor or nurse at the general practice, or by telephone or home visit before their index adverse event (n = 12/1774; P<0.001). There were positive linear relationships between the number of referrals and emergency admissions during the study period and patients’ risk of adverse events. The association was greatest in patients who had two or more referrals (RR = 1.37; 95% CI = 1.11 to 1.68; P = 0.003) and those who had five or more emergency admissions (RR = 5.17, 95% CI = 4.61 to 5.79; P<0.001).
Model selection for adjusted analyses
The data had excess zero counts but were not overdispersed. Eight models were developed to assess the individual contribution of the eight comorbidity measures and to prevent collinearity. In explaining the risk of having recorded adverse events, the model with the total number of EDCs performed best, with the lowest Quasi-likelihood under the Independence model Criterion (QIC) score of 11 248.0 (Table 2).
Fit of adjusted Poisson regression models for predicting risk factors for an adverse event, using the generalized estimating equations method
The QIC is a modified version of the Akaike Information Criterion (AIC) developed for generalised estimating equations, where lower scores indicate better model fit.40 The score for the model with EDCs indicated reasonable fit for the data, compared with the null model (containing no predictor variables), which had a QIC score of 13 911.7.
Performance of comorbidity measures
A comparison of Khan et al’s version of the Charlson Index30 and the ACG software for predicting the risk of an adverse event showed that the latter achieved better performance, as described previously. The Charlson score was second best, with a QIC score of 12 213.7 (Table 2).
All models performed better than the null model, except those containing ADGs and MEDCs.
There was little difference in the performance of the models with the two Charlson Index-derived measures (composite comorbidity flag and 17 disease flags) and CADGs.
Adjusted associations with adverse events
After adjusting for other variables and clustering of patients at practices, there was no longer a statistically significant sex difference in the risk of adverse events (P = 0.322) (Table 3). Ethnicity (P = 0.452), practice region (P = 0.193), and continuity of care (P = 0.582) were also no longer significant predictors of adverse events. Compared with patients of other ages, patients aged between 65 and 84 years were still most at risk of adverse events, with an adjusted RR of 5.62 (95% CI = 4.58 to 6.91; P<0.001) compared with an unadjusted RR of 11.90 (95% CI = 9.90 to 14.30; P<0.001).
Risk factors for reported adverse events: adjusted results from Poisson regression using the generalised estimating equations method
Table 3 shows that other factors associated with adverse events were high number of consultations at the general practice, or by telephone or home visit (RR = 2.14, 95% CI = 1.60 to 2.86; P<0.001) and having five or more emergency admissions (RR = 2.08, 95% CI = 1.66 to 2.60; P<0.001). In contrast to crude results, longer length of time registered at the practice now had an inverse relation with adverse events (RR = 0.40, 95% CI = 0.35 to 0.47, P<0.001). Similarly, having one or more referral request was protective against adverse events (P = 0.031). Patients with a high number of EDCs were most at risk of adverse events (RR = 8.46, 95% CI = 5.68 to 12.60; P<0.001).
DISCUSSION
Summary
Few studies measuring the incidence of adverse events in primary care have used person-years as the unit of measurement, instead preferring estimates based on the number of consultations. Using the latter variable, the estimated rate of eight adverse events per 10 000 consultations is comparable to other studies that identified adverse events in less than 1% of consultations.2,19 Also as previously found, older patients were at greatest risk of adverse events.14,41,42
Strengths and limitations
This study used population-representative data spanning 10 years to determine the incidence of, and temporal trends in, recorded adverse events in English general practice. It benefited from the use of a validated diagnosis coding set. However, despite careful data cleaning, the sample may have contained false-positive cases of adverse events, including events attributed to the disease process, expected treatment effects, or previous adverse events. The secondary use of data collected for other purposes is likely to be affected by biases related to financial reimbursement (including the Quality and Outcomes Framework [QOF]), patient groups, or the software itself.43,44 Disease severity is generally not directly recorded by Read Codes or other coding systems, but is an important factor in terms of quantifying avoidable and serious adverse events so that these events can be reduced. Case ascertainment, including severity and potential preventability, can be improved by using additional data sources and the introduction of a broader definition of adverse event beyond diagnosis codes designated for complications of care. This study investigated a range of potential patient risk factors for adverse events but case-mix adjustments were limited by the lack of general practice variables in the GPRD dataset.
Although the models with Khan et al’s adapted Charlson Index performed well,30 fewer diseases are represented in this comorbidity index than in the popular Elixhauser Index, which is also partly derived from the original Charlson Index.45,46 While there is no indication of inappropriate use in the English general practice population, the effects of taxonomical incompatibility should also be considered, as Khan et al’s adapted Charlson Index was translated from International Classification of Diseases, Ninth Revision, Clinical Modification (ICD-9-CM) codes,47 which are not used in England.30 The suitability of CADGs as an alternative measure to the Charlson score for predicting adverse events, and other outcomes, should be explored, given that the models containing either measure performed comparatively well and, unlike the Charlson Index, CADGs take into account health service demand.48,49 Nevertheless, the performance of all ACG measures in this study may have been affected by misclassification, as the chronology of conditions, diseases, and adverse events was not considered. Furthermore, the dataset lacked indication of resolved conditions and diseases.36
Likewise, it was not possible to determine causality with this cross-sectional study design. Temporal congruence of potential risk factors and the outcome of interest should be explored in future research. Another issue related to the sequencing of events is the distinction between episodes of adverse events, which was arbitrarily set in this study but may actually represent related adverse events and be affected by patient recall and delayed presentation. The high frequency of events recorded as postoperative infection and pain suggests that adverse events attributable to secondary care may manifest and be treated in primary care instead, although further analysis is required to confirm causality.14
Comparison with existing literature
The study found that the incidence of adverse events increased over time, although there were marked fluctuations, especially in patients aged ≥85 years at study entry. This patient group had the highest incidence of adverse events out of all age groups, with peak rates in 2004 and 2007. The overall rise in adverse events may be associated with more, and improved quality of, data recording. This is perhaps influenced by the QOF payment-by-results system introduced in 2004, increased use of electronic patient records during this period, and the introduction of local and national safety-improvement initiatives. The particularly sharp rise in recorded adverse events in the oldest patients may be explained by random variation due to the relatively small number of patients in this age group compared with the number of patients who experienced harm.
The low incidence of adverse events, as well as risk factors of older age and high number of comorbid diseases, supported results from previous studies.2,14,18,19,40,41 The study finding that elevated risk of adverse events was associated with high numbers of consultations at the general practice, or by telephone or home visit, and having five or more emergency admissions, is clinically reasonable irrespective of causality, as one may expect that greater exposure to health services will increase the risk of iatrogenic harm. Conversely, those who experience adverse events may require more care for their injuries. No statistically significant association was found between continuity of care and risk of adverse events once adjusted for other factors. Given that continuity of care may be associated with some patient outcomes but remains under-investigated, further research is warranted and alternative measures of continuity should be considered.20,21,42 The finding that longer length of time registered at the practice was inversely associated with risk of adverse events reflects the findings of Lewis et al,49 but may be better understood by examining potential interactions with other factors, including age, comorbidities, and frequency of service use.
Implications for practice and research
Studies to inform and facilitate patient safety monitoring should examine whether having a first adverse event predicts the occurrence of subsequent adverse events. Outcomes following adverse events, including emergency admissions and death, are of interest because of their potential preventability and relative ease of identification using routinely collected data. This study has highlighted high-risk patient groups for adverse events recorded routinely during care. As found in other studies using alternative data sources and methods, the rate of adverse events in primary care is low and may reflect under-recording of safety incidents occurring in this setting.19
Routine recording of acute conditions, including adverse events, may be less frequent and less precise than for chronic diseases.9,24 This may be due to errors or failures in diagnosis and/or recording, of which there is limited evidence specifically on adverse events, and poor linkage between initial activity and subsequent harm.8,42,50 The recording of adverse events may be subject to factors that do not affect non-iatrogenic acute conditions, but that have been identified as barriers to incident reporting. For instance, clinicians may be reluctant to attribute care delivered by themselves or colleagues as causing a patient’s adverse event, or may not perceive that it can be a cause.51 The reasons for the low rate of adverse events detected needs to be better understood, particularly if this rate is an under-estimation of the true extent of patient harm.
Acknowledgments
The Johns Hopkins Adjusted Clinical Groups (ACG)® Case-Mix System, version 9.01i was used in analyses. The currently available version of the software is 10i. This study is based in part on data from the Full Feature GPRD obtained under licence from the MHRA. The interpretation and conclusions contained in this study are those of the authors alone.
Notes
Funding
This article represents independent research supported by the National Institute for Health Research (NIHR) Patient Safety Translational Research Centre. The Dr Foster Unit at Imperial is affiliated with the Centre for Patient Safety and Service Quality (CPSSQ) at Imperial College Healthcare NHS Trust, which is funded by NIHR. The Dr Foster Unit at Imperial is funded by a grant from Dr Foster Intelligence (an independent healthcare information company and joint venture with the Information Centre of the NHS). The Department of Primary Care and Public Health at Imperial College London is grateful for support from the NIHR Biomedical Research Centre scheme and the NIHR Collaboration for Leadership in Applied Health Research and Care (CLAHRC) Scheme. Access to the General Practice Research Database (GPRD) database was funded through the Medical Research Council’s licence agreement with the UK Medicines and Healthcare Products Regulatory Agency (MHRA). The views expressed in this article are those of the authors and not necessarily those of the funding organisations. The funders had no role in the study design and the collection, analysis, and interpretation of data, the writing of the article, or the decision to submit it for publication.
Ethical approval
The GPRD Group has Trent Multi-Centre Research Ethics Committee approval for all observational research using GPRD data (reference: 05/MRE04/87). This study was granted approval by GPRD’s Independent Scientific Advisory Committee.
Provenance
Freely submitted; externally peer reviewed.
Competing interests
The authors have declared no competing interests.
Discuss this article
Contribute and read comments about this article on the Discussion Forum: http://www.rcgp.org.uk/bjgp-discuss
- Received January 11, 2013.
- Revision received February 13, 2013.
- Accepted April 18, 2013.
- © British Journal of General Practice 2013
REFERENCES
In this issue


Jump to section
More in this TOC Section
Related Articles
Cited By...

