


Abstract
Background There is little evidence to inform the targeted treatment of individuals found early in the diabetes disease trajectory.
Aim To describe cardiovascular disease (CVD) risk profiles and treatment of individual CVD risk factors by modelled CVD risk at diagnosis; changes in treatment, modelled CVD risk, and CVD risk factors in the 5 years following diagnosis; and how these are patterned by socioeconomic status.
Design and setting Cohort analysis of a cluster-randomised trial (ADDITION-Europe) in general practices in Denmark, England, and the Netherlands.
Method A total of 2418 individuals with screen-detected diabetes were divided into quartiles of modelled 10-year CVD risk at diagnosis. Changes in treatment, modelled CVD risk, and CVD risk factors were assessed at 5 years.
Results The largest reductions in risk factors and modelled CVD risk were seen in participants who were in the highest quartile of modelled risk at baseline, suggesting that treatment was offered appropriately. Participants in the lowest quartile of risk at baseline had very similar levels of modelled CVD risk at 5 years and showed the least variation in change in modelled risk. No association was found between socioeconomic status and changes in CVD risk factors, suggesting that treatment was equitable.
Conclusion Diabetes management requires setting of individualised attainable targets. This analysis provides a reference point for patients, clinicians, and policymakers when considering goals for changes in risk factors early in the course of the disease that account for the diverse cardiometabolic profile present in individuals who are newly diagnosed with type 2 diabetes.
- cardiovascular diseases
- diabetes mellitus, type 2
- prevention and control
- primary health care
- risk assessment
- risk factors
- treatment heterogeneity
INTRODUCTION
The promotion of opportunistic screening for diabetes,1 coupled with the assessment of diabetes risk in national health checks programmes,2 will lead to a greater number of individuals being diagnosed early in the disease trajectory. Among those with established diabetes, the risk of cardiovascular disease (CVD) and mortality can be reduced by intensive treatment of single risk factors, including blood pressure, cholesterol, and glucose.3–6 Further, a small (n = 160) trial of multifactorial treatment found a protective effect at 13 years.7 Screen-detected populations have a CVD risk profile that is distinct from that of individuals with clinically diagnosed or established diabetes,8,9 and evidence to inform the treatment of individuals found earlier in the course of the disease, where CVD risk varies greatly,8 is lacking. Results from ADDITION-Europe, a 5-year cluster randomised trial of intensive multifactorial treatment among screen-detected patients, show that it is possible to intensify treatment and reduce levels of many CVD risk factors in this high-risk group.9 While the reduction in risk of cardiovascular events associated with the intervention was not statistically significant (hazard ratio = 0.83, 95% confidence interval [CI] = 0.65 to 1.05), there was no increase in modelled CVD risk in the 5 years following diagnosis, despite increasing age and diabetes duration. However, many patients were not prescribed recommended treatments.8,9 In a screen-detected population that is free of symptoms, primary care teams may be reluctant to prescribe intensive treatment,10 and patients may be reluctant to adhere, particularly if they only experience complications related to medications in the short term.11 Further, there are examples of inequity in provision of health care for patients with diabetes.12,13 To inform the development and implementation of treatment policies in this high-risk group, this study aimed to examine baseline CVD risk profiles and treatment of CVD risk factors; change in treatment, modelled CVD risk, and CVD risk factors; and (iii) how these are patterned by socioeconomic status.
METHOD
This cohort analysis used data from the ADDITION-Europe trial, details of which have been reported previously.9 Briefly, ADDITION-Europe is a pragmatic primary care-based trial of intensive multifactorial treatment compared with routine care in those with screen-detected diabetes, in England, Denmark, and the Netherlands. Of 1312 general practices invited to participate, 379 (29%) agreed and 343 (26%) were independently randomised to screening plus routine care of diabetes, or screening followed by intensive multifactorial treatment of CVD risk factors. Screening took place between 2001 and 2006, and out of 3233 individuals found to have undiagnosed prevalent diabetes, 3057 (95%) agreed to take part in the treatment phase of the study.
How this fits in
Greater numbers of individuals are being diagnosed early in the diabetes disease trajectory, where there is little evidence to inform treatment. This study shows that the calculation of modelled cardiovascular disease risk is a useful tool for guiding treatment decisions in newly-diagnosed patients with diabetes. Identifying who is at highest risk will help target treatment to those who need it the most and is likely to lead to a reduction in treatment inequity.
Participants underwent a health assessment at baseline, and after a mean of 5.7 years (standard deviation [SD] = 1.3 years) post-diagnosis. Trained staff collected biochemical and anthropometric measurements, according to standard operating procedures.14–16 Self-report questionnaires were used to collect information on sociodemographic information, lifestyle habits, and medication use. Education was first grouped into tertiles, depending on the age at which participants left full-time education, and then dichotomised into two groups; first versus second and third tertile (low education equals <16 years in the UK and the Netherlands; <21 years in Denmark). Employment status was self-reported.
The characteristics of the interventions to promote intensive treatment in each centre have been described previously and are outlined in Table 1.14–17 Family doctors, practice nurses, and participants were educated in target-driven management (using medication and promotion of healthy lifestyles) of hyperglycaemia, blood pressure, and cholesterol, based on the stepwise regimen used in the Steno-2 study.26
Treatment protocol for the routine care and intervention groups in ADDITION-Europe
Statistical analysis
Ten-year modelled CVD risk was calculated from the model of the UK Prospective Diabetes Study (UKPDS); version 3 beta),27 at baseline and 5-years post-diagnosis. This is a diabetes-specific risk-assessment tool that estimates the absolute risk of fatal or non-fatal CVD within a defined time frame up to 20 years. Participants with complete data on the baseline UKPDS score variables, which are outlined in Box 1, were included in the analyses. The population was divided into quartiles of baseline-modelled CVD risk. Sociodemographic (age, sex, ethnicity, and education), health behaviour (smoking status), health utility (EQ-5D),28 and clinical characteristics were summarised by risk quartile and in the cohort as a whole.
Box 1. The UKPDS cardiovascular disease risk model
Background
A diabetes-specific risk-assessment tool that estimates the absolute risk of fatal or non-fatal CVD within a defined time frame up to 20 years. Participants with complete data on the UKPDS score variables at baseline were assessed.
Input variables
Age, sex, ethnicity, smoking status, glycated haemoglobin (HbA1c), systolic blood pressure, total:HDL (high density lipoprotein) cholesterol ratio, atrial fibrillation (AF), previous myocardial infarction or stroke, microalbuminuria (albumin:creatinine ratio ≥2.5 mg/mmol in males, or ≥3.5 mg/mmol in females), macroalbuminuria (albumin:creatinine ratio ≥30 mg/mmol), duration of diagnosed diabetes, and body mass index.
Notes on use
There were no data available on AF in ADDITION-Europe participants, so all individuals were coded as zero (no AF). There was a high proportion of missing data for smoking at 5-year follow-up in the Netherlands (29%). Baseline smoking status was used in the calculation of 5-year modelled CVD risk when follow-up values were missing.
Within each modelled CVD risk quartile, the mean absolute change in each CVD risk factor was calculated. To adjust for the differing demographic characteristics of each quartile, centre-specific linear regression models were used to estimate the change in each CVD risk factor within baseline CVD risk quartile, adjusted for age at diagnosis, sex, ethnicity, age of leaving full-time education, randomisation group, and clustering (robust standard errors). Adjusted means for each centre were combined via fixed-effects meta-analysis. The predicted probability of being prescribed any blood pressure-lowering, lipid-lowering, or glucose-lowering medication between diagnosis and 5 years, adjusting for demographic variables (within quartiles of baseline CVD risk), was calculated using a logistic model analogous to the primary analysis model.
Both the overall effect of education and potential interactions between low education and baseline cardiovascular risk were explored using centre-specific regression models as described above. The effect of employment status on change in each CVD risk factor was also examined.
The possibility that observed associations were dependent on the number of quartiles was explored by producing scatter plots of change in each risk factor by baseline modelled CVD risk. The study also explored whether the relationship between baseline risk quartile and risk factor change differed by trial group. Results were similar and trial groups were combined into a single cohort with adjustment for trial group. A multilevel logistic model (practices within centres) was used to explore sociodemographic information that predicted loss to follow-up. Regression to the mean within quartiles was explored by plotting baseline values against change scores.29 Data were analysed using Stata (version 12.1).
RESULTS
Participant characteristics
At 5 years, 196 people had died, 48 had independently adjudicated cardiovascular-related deaths before 5-year follow-up, and 443 individuals did not have complete data to calculate the UKPDS risk score at baseline. Baseline sociodemographic characteristics were similar between individuals who were included in the analysis (n = 2418) and those who were excluded because of missing clinical data at baseline or follow-up (n = 443), except for sex (females were more likely to have missing data than males [odds ratio = 1.3; 95% CI = 1.04 to 1.6]). Modelled risk at baseline was missing for 15.5% of the population, while missing data at 5 years ranged from 29% for systolic blood pressure to 37% for albumin:creatinine ratio (ACR).
Modelled 10-year CVD risk
Compared to the highest-risk quartile, people in the lowest-risk quartile were more likely to be female (67% versus 19%) and younger (56 years, SD = 7.2 years versus 63 years, SD = 5.5 years) and to be more highly educated (54% versus 33%). Individuals at low risk were also more likely to be non-smokers (86% versus 62%), to be free of CVD, and to have more favourable clinical characteristics (Table 2). The proportion of the population prescribed cardioprotective medication (lipid-, glucose- or blood pressure-lowering medication) at baseline was similar across the four quartiles (Table 2).
Participant characteristics at diagnosis by modelled CVD risk quartile
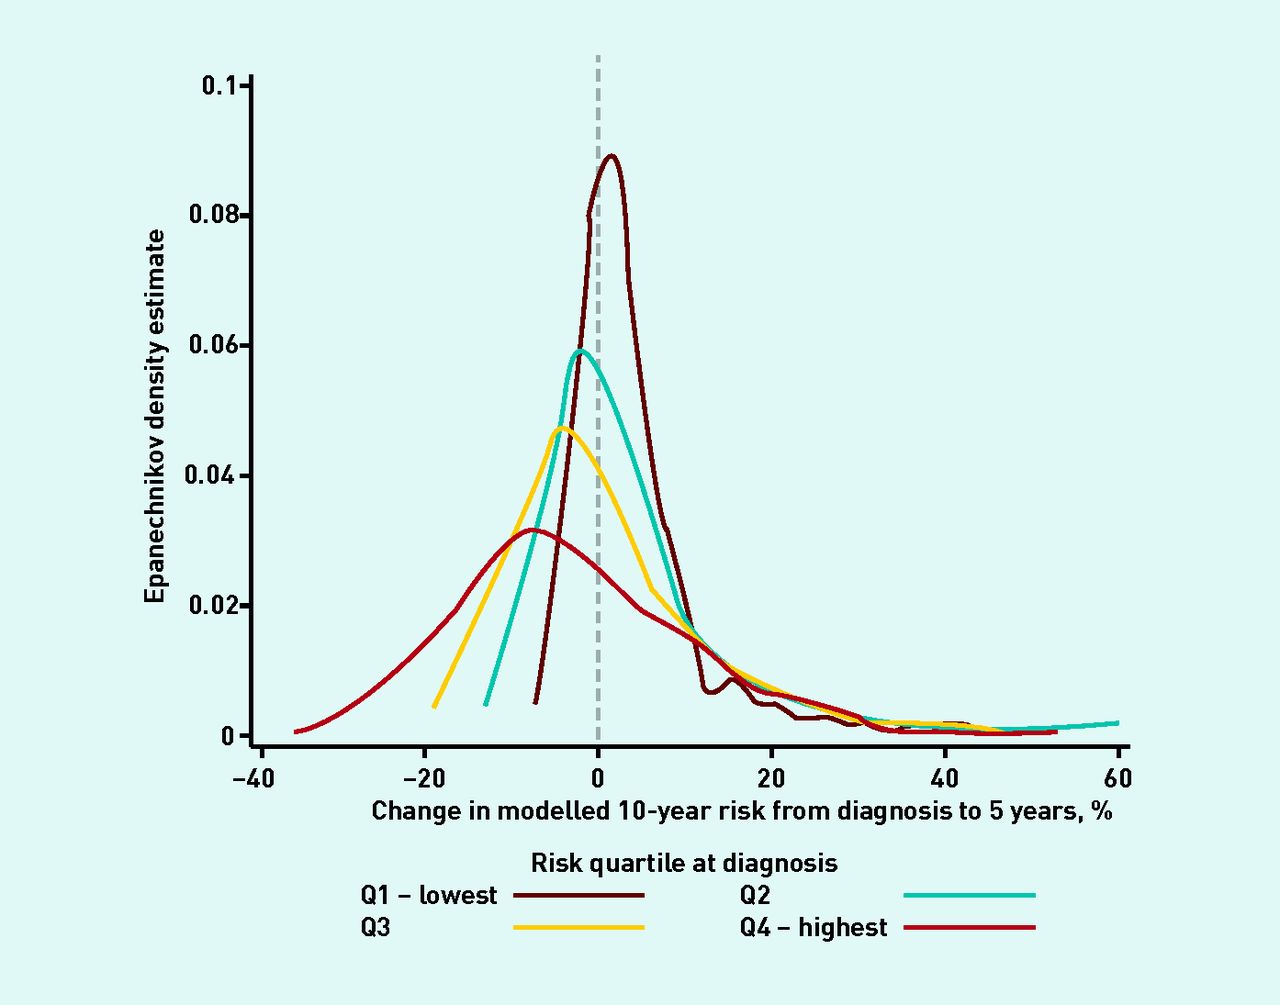
Figure 1 shows the distribution of change in modelled CVD risk from baseline to 5-year follow-up. Participants in the highest quartile of CVD risk at baseline showed the largest reduction in CVD risk, and the largest variation in change. Participants in the lowest quartile of modelled risk at baseline had very similar levels of CVD risk at 5-year follow-up and showed the least variation in risk change.

Distribution of change in modelled CVD risk from diagnosis to 5 years, by quartile of modelled CVD risk at diagnosis.
Body mass index
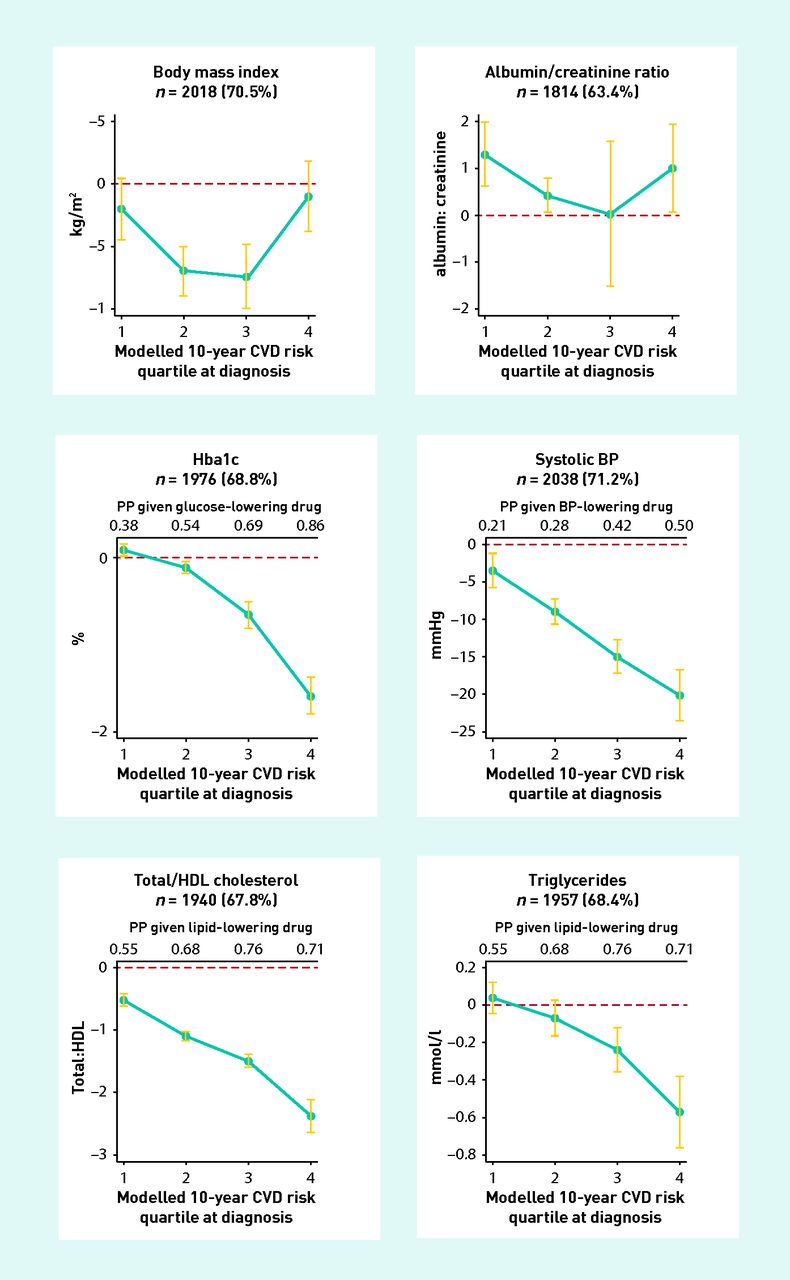
Adjusted reductions in body mass index (BMI) were largest among participants in the second (Q2) and third quartile (Q3) for modelled CVD risk (Q2: −0.7 kg/m2; 95% CI = −0.9 kg/m2 to −0.5 kg/m2; Q3: −0.7 kg/m2; 95% CI = −0.1 kg/m2 to −0.5 kg/m2; Figure 2). No significant reductions were observed in Q1 and Q4 (Table 3).
Absolute change from diagnosis to 5 years (with 95% CI), by modelled CVD risk quartile at diagnosis, adjusted for age, ethnicity, age of leaving full-time education, sex, randomisation group, and practice and centre clustering. Q1, 0–24th centile; Q4, 75–100th centile. BP = blood pressure. PP = predicted probability of being prescribed the medication at 5 years (if not on the drug at baseline), in an adjusted model analogous to the primary analysis.
Adjusted and unadjusted change between diagnosis and 5 years in CVD risk factors, by modelled CVD risk quartile at diagnosis
Glycated haemoglobin (HbA1c)
Baseline median HbA1c ranged from 6.2% in Q1 to 7.2% in Q4 (Table 2). A significant increase in HbA1c was observed in Q1 (+0.1%; 95% CI = 0.05 to 0.2) over 5 years of follow-up (Table 3). There was no change in HbA1c levels in Q2, while large reductions were seen in Q3 (−0.6%; 95% CI = −0.8% to −0.5%) and Q4 (−1.5%; 95% CI = −1.7% to −1.2%) (Table 3).
Systolic blood pressure
Baseline systolic blood pressure ranged from 137 mmHg (SD = 17) in Q1 to 161 mmHg (SD = 24 mmHg) in Q4 (Table 2). Over 5 years follow-up the smallest reduction was observed in Q1 (−3.5 mmHg; 95% CI = −5.7 mmHg to −1.3 mmHg) and the largest reduction in Q4 (−20.5 mmHg; 95% CI = −23.9 mmHg to −17.0 mmHg) (Table 3).
Total:HDL (high-density lipoprotein) cholesterol ratio
The mean (SD) total:HDL cholesterol ratio was 3.8 (1.1) in Q1 at baseline and 5.7 (1.6) in Q4 (Table 2). From diagnosis to 5-year follow-up, the total:HDL cholesterol ratio decreased in all four quartiles, with the smallest reduction in Q1 (−0.5; 95% CI −0.7 to −0.4) and the largest in Q4 (−2.3; 95% CI = −2.5 to −2.2) (Table 3).
Triglycerides
At diagnosis, median triglyceride levels ranged from 1.4 mmol/l in Q1 to 2.1 mmol/l in Q4 (Table 2). At 5 years, triglyceride levels had decreased in Q3 (−0.2 mmol/l; 95% CI = −0.4 mmol/l to −0. mmol/l) and Q4 (−0.6 mmol/l; 95% CI = −0.7 mmol/l to −0.4 mmol/l), with no change observed in Q1 and Q2 (Table 3).
Albumin:creatinine ratio
Median albumin:creatinine ratio at baseline ranged from 0.7 mg/mmol in Q1 to 1.4 mg/ mmol in Q4 (Table 2). At 5-year follow-up significant increases were observed in Q1 (+1.3 mg/mmol; 95% CI = 0.7 mg/mmol to 2.0 mg/mmol), Q2 (+0.5 mg/mmol; 95% CI = 0.2 mg/mmol to 0.9 mg/mmol), and Q4 (+1.0 mg/mmol; 95% CI = 0.1 mg/mmol to 1.9 mg/mmol). No change was noted in Q3 (Table 3).
Predicted probability of being allocated pharmacotherapy
The predicted probability of being prescribed cardioprotective medication at 5 years was higher in all four quartiles (Table 3). Those at the highest baseline modelled CVD risk were most likely to be prescribed cardioprotective treatment at 5 years (Table 3).
Socioeconomic patterning
No association between low education or employment status and change in CVD risk factors was present within any of the quartiles of baseline-modelled CVD risk.
Intervention effect
A sensitivity analysis excluding practices that received the intervention (promotion of intensive multifactorial diabetes care) demonstrated a non-significant decrease in systolic blood pressure in Q1 (−2.9 mmHg; 95% CI = −6.2 mmHg to 0.5 mmHg), and an increase in triglycerides in Q1 (0.2 mmol/l; 95% CI = 0.04 mmol/l to 0.3 mmol/l). Results otherwise suggested that the treatment groups could be pooled.
DISCUSSION
Summary
There was large variation in modelled CVD risk at diagnosis among this group of individuals with screen-detected diabetes. Compared to those at lowest risk, individuals in the highest modelled CVD risk quartile were more likely to be older, male, and smokers and to have a low education status. There was no difference in the proportion of participants prescribed cardioprotective drugs across the CVD risk quartiles at baseline. The largest reductions in modelled risk were seen in participants who were in the highest quartile of CVD risk at baseline, suggesting that treatment was offered to those at highest risk. For lipid-, glucose-, and blood pressure-lowering medication, those at highest CVD risk at baseline were most likely to be prescribed cardioprotective therapy at 5 years. Participants in the lowest quartile of risk at baseline had very similar levels of modelled CVD risk at 5-year follow-up and showed the least variation in change in modelled risk. There was no variation in change in modelled CVD risk or prescription of cardioprotective treatment by socioeconomic status, suggesting that treatment was equitable.
Strengths and limitations
Data were collected from a large, representative population-based sample in three different European countries. There was high participant retention and little difference between individuals with and without follow-up data. Centrally trained staff collected data according to standard operating procedures. Recruitment of practices to the study was by self-selection, which may limit the generalisability of the study findings, but the baseline characteristics of the sample were nationally representative.9 The study population was largely white, and so it was not possible to assess treatment inequity in relation to ethnicity. As only 48 CVD-related deaths occurred between diagnosis and 5 years, they probably introduced a minimal amount of bias. The UKPDS risk model is one of the most extensively validated risk scores for use in European populations with diabetes.30,31 While it has been shown to overestimate risk in some contemporary populations with diabetes,31 it is effective at ranking individuals (discrimination) and is therefore suitable for examination of characteristics by risk quartile and resource prioritisation.
Presenting the data by quartiles of baseline CVD risk could potentially lead to regression toward the mean.29 To explore this effect, the baseline value of each risk factor was plotted against the change at 5 years. The lack of reduction in change in the tails suggests that the change values in Q1 and Q4 were not falsely attenuated. Clinical measurements were collected in triplicate, which may have helped reduce the potential for regression to the mean. The change in each risk factor was normally distributed within each quartile, and sensitivity analyses suggested that the quartiles represented the underlying patterns in an easily interpretable manner.
Comparison with existing literature
The adverse CVD risk profile at baseline in the ADDITION-Europe cohort has been observed in cohorts of individuals with newly-diagnosed diabetes.
After 5 years of follow-up in ADDITION-Europe, the largest reductions in modelled CVD risk were seen in participants who were in the highest quartile of risk at baseline. These findings support data from the UKPDS32 and the Swedish National Diabetes register,33 which suggest that the greatest improvements in cardiovascular risk factors were seen among individuals with the highest initial values after diagnosis of diabetes. In the UKPDS, after an initial very large reduction in HbA1c levels, HbA1c slowly increased over the first 6 years in both intervention arms,34 and a sub-cohort of overweight individuals,35 while a more gradual decline in systolic blood pressure values was observed in the 9 years after diagnosis.4 In the more recent DESMOND (Diabetes Education and Self-Management for Ongoing and Newly Diagnosed) study,36 in which baseline information was collected up to 6 weeks after diagnosis,37 a similar pattern of a reduction in HbA1c, followed by a gradual increase, was observed.36
After 5 years of follow-up, ADDITION participants at highest baseline risk were more likely to be prescribed lipid-, glucose- or blood pressure-lowering drugs, after adjusting for several demographic covariates, including age, that may influence pharmacotherapy decisions by practitioners.38 This is in line with the finding that those at highest risk at baseline in the Danish ADDITION cohort had near-normal all-cause mortality after 7 years of follow-up, while those at lower risk had an all-cause mortality that was approximately twice as high.10 While the overall proportion of participants receiving cardioprotective medication could have been higher, the findings of the present study suggest that the ADDITION intervention was effective at reducing social inequity in treatment
Implications for research and practice
The findings of this study suggest that the calculation of modelled CVD risk is a useful tool for guiding treatment decisions in newly-diagnosed patients with diabetes. Identifying who is at highest risk will help target treatment to those who need it the most, and is likely to lead to a reduction in treatment inequity.42 The group identified at high risk in the study cohort had the highest prevalence of stroke and myocardial infarction at baseline and therefore had the greatest capacity to change. Intensive treatment by lifestyle intervention and prescription of cardioprotective medication is likely to lead to clinically important reductions in CVD risk factors and modelled CVD risk, particularly in individuals with a high CVD risk at diagnosis.
Among individuals with low CVD risk at diagnosis, an early-treatment approach is likely to offset the expected age and/ or diabetes duration-related increase in modelled CVD risk. However, there is some evidence from the ADDITION-Denmark cohort to suggest that individuals at low risk are not being treated appropriately, leading to higher all-cause mortality compared to that for those at higher risk.10 Calculation of modelled CVD risk can also aid individualised patient goal setting and empowerment of self-care.18,38 This analysis provides a reference point for patients, clinicians, and policymakers when considering goals for changes in risk factors early in the course of the disease that account for the diverse cardiometabolic profile present in newly-diagnosed patients. Further analysis characterising CVD risk-factor trajectories could aid in both refining realistic goals for patients and identifying patterns that would allow a more nuanced approach to CVD risk-prevention initiatives.
Notes
Funding
ADDITION-Cambridge was supported by the Wellcome Trust (grant ref:G061895); the Medical Research Council (MRC) (grant:G0001164); the National Institute for Health Research (NIHR) Health Technology Assessment Programme (grant:08/116/300); NHS R&D support funding (including the Primary Care Research and Diabetes Research Networks); and the NIHR. Simon Griffin received support from the Department of Health (DoH) NIHR Programme Grant funding scheme [RP-PG-0606-1259]. The views expressed in this publication are those of the authors and not necessarily those of the UK DoH. Bio-Rad provided equipment for HbA1c testing during the screening phase. ADDITION-Denmark was supported by the NHS in the counties of Copenhagen, Aarhus, Ringkøbing, Ribe and South Jutland in Denmark; the Danish Council for Strategic Research; the Danish Research Foundation for General Practice; Novo Nordisk (NN) Foundation; the Danish Centre for Evaluation and Health Technology Assessment; the diabetes fund of the National Board of Health; the Danish MRC; and the Aarhus University Research Foundation. The trial has been given unrestricted grants from NN AS, NN Scandinavia AB, NN UK, ASTRA Denmark, Pfizer Denmark, GlaxoSmithKline Pharma Denmark, Servier Denmark A/S and HemoCue Denmark A/S. Parts of the grants from NN Foundation, Danish Council for Strategic Research and NN were transferred to the other centres. ADDITION-Leicester was supported by DoH and adhoc Support Sciences; the NIHR Health Technology Assessment Programme (grant:08/116/300); NHS R&D support funding (including the Primary Care Research and Diabetes Research Network, and LNR CLAHRC); and the NIHR. Melanie J Davies and Kamlesh Khunti receive support from the DoH NIHR Programme Grant funding scheme [RP-PG-0606-1272]. ADDITION-Netherlands was supported by unrestricted grants from NN, Glaxo Smith Kline and Merck; and by the Julius Center for Health Sciences and Primary Care, University Medical Center, Utrecht. provision and that treatment overall was offered in relation to underlying CVD risk. Despite a higher proportion of individuals in the highest-risk quartile having left education at a younger age, no association was observed between education or employment status and change in modelled CVD risk. There was no evidence for socioeconomic inequity in changes in risk factors in the overall trial cohort, or when the population was stratified by baseline CVD risk. This suggests that, despite the inequity in risk at diagnosis identified in ADDITION-Europe and in other cohorts with diabetes,39–41 there was no social inequity in the delivery of treatment.
Ethical approval
The study was approved by the ethics committee local to each study centre. All participating patients provided informed consent.
Provenance
Freely submitted; externally peer reviewed.
Open access
This article is Open Access: CC BY 3.0 license (http://creativecommons.org/licenses/by-nc/3.0/)
Competing interests
The authors have declared no competing interests.
Discuss this article
Contribute and read comments about this article: www.bjgp.org/letters
- Received September 24, 2013.
- Revision received October 28, 2013.
- Accepted January 14, 2014.
- © British Journal of General Practice 2014
This is an OpenAccess article distributed under the terms of the Creative Commons Attribution License (http://creativecommons.org/licenses/by/3.0/), which permits unrestricted reuse, distribution, and reproduction in any medium, provided the original work is properly cited.
REFERENCES
In this issue


Jump to section
Keywords
More in this TOC Section
Related Articles
Cited By...

