


Abstract
Background Overweight children are at an increased risk of premature mortality and disease in adulthood. Parental perceptions and clinical definitions of child obesity differ, which may lessen the effectiveness of interventions to address obesity in the home setting. The extent to which parental and objective weight status cut-offs diverge has not been documented.
Aim To compare parental perceived and objectively derived assessment of underweight, healthy weight, and overweight in English children, and to identify sociodemographic characteristics that predict parental under- or overestimation of a child’s weight status.
Design and setting Cross-sectional questionnaire completed by parents linked with objective measurement of height and weight by school nurses, in English children from five regions aged 4–5 and 10–11 years old.
Method Parental derived cut-offs for under- and overweight were derived from a multinomial model of parental classification of their own child’s weight status against school nurse measured body mass index (BMI) centile.
Results Measured BMI centile was matched with parent classification of weight status in 2976 children. Parents become more likely to classify their children as underweight when they are at the 0.8th centile or below, and overweight at the 99.7th centile or above. Parents were more likely to underestimate a child’s weight if the child was black or South Asian, male, more deprived, or the child was older. These values differ greatly from the BMI centile cut-offs for underweight (2nd centile) and overweight (85th).
Conclusion Clinical and parental classifications of obesity are divergent at extremes of the weight spectrum.
INTRODUCTION
The prevalence of childhood obesity has increased significantly in recent years.1–3 In the 2012–2013 school year, 33% of Year 6 pupils (age 10–11 years) in England were overweight or obese.4 Overweight children and adolescents are at an increased risk of cardiometabolic disease and premature mortality in adulthood.5 However, evidence from systematic literature reviews has consistently found that only 40–50% of parents can identify when their child is overweight.6,7 The lack of accurate parental perception of a child’s weight status may limit the effectiveness of interventions aimed at primary prevention of child obesity.1
The National Child Measurement Programme (NCMP) measures the heights and weights of all children in reception (age 4–5 years) and Year 6 (aged 10–11 years) at state schools in England.4 Local authorities are encouraged to provide written weight status feedback to the children’s parents, as well as telephone or in-person feedback to children that are overweight.4 Standard population body mass index (BMI) cutoffs used for NCMP surveillance are the 2nd centile for underweight, 85th centile for overweight, and 95th centile for very overweight; the NCMP uses more stringent clinical cut-offs of 2nd centile for underweight, 91st centile for overweight, and 98th centile for very overweight in its feedback to parents.8
Child obesity cut-offs represent points where the deviation in BMI from a reference population of British children, collected between 1978 and 1990, is assumed extreme enough to infer membership of a different weight status group.9 Parents are known to misclassify their child’s weight status,6,10 and little is known about what weight status cut-offs would look like if they were derived from parental perceptions of their child’s weight status rather than expert opinion based on objective assessment of weight status. As parents may be less likely to act if they do not perceive their child’s overweight as a problem, quantification of the discrepancy between perceived weight status by the parent and objectively measured weight status may help to explore the potential impact of parental weight misclassification on effectiveness of public health interventions aimed at reducing the prevalence of child obesity.
Aims
This study aimed to:
compare parental-perceived and objectively-derived assessment of underweight, healthy weight, or overweight; and
identify socidemographic characteristics that predict parental under- or overestimation of a child’s weight status.
How this fits in
Parental perceptions and clinical definitions of child obesity are known to diverge; however, the extent of the discrepancy has not been documented. This study characterises parental classifications of obesity and identifies sociodemographic characteristics that predict misclassification. Also, BMI centile cut-offs for weight status are established as derived from parental perceptions.
METHOD
The NCMP is an England-wide programme, which aims at measuring the heights and weights of every child in reception and Year 6 at state schools. Parents of all children enrolled in the NCMP in the 2010–2011 school year across the following five primary care trusts (PCTs) were invited to participate: Redbridge, Islington, West Essex, Bath and North East Somerset (Year 6 only), and Sandwell (Reception only). Baseline data from a previously described cohort study were used in this analysis, the protocol for which has been previously published.11 Questionnaires were distributed to parents on the day of the child’s NCMP measurement but before they received weight feedback. Parents were asked to state whether they believed their child was underweight, healthy weight, overweight, or very overweight. PCT records provided the child’s age, sex, ethnic group, school year, NCMP nurse-measured height and weight, and local area deprivation quintile from the Index of Multiple Deprivation (IMD) 2007.12
Primary outcome: parental cut-offs
A multinomial model of parental perceived weight status was used, with three categories: underweight, healthy weight, and overweight (as the number of parents reporting their child as very overweight was low [n = 4], the very overweight and overweight categories were combined). A proportional odds model was rejected in favour of a multinomial model, as the proportional odds assumption was violated. Coefficients did not vary importantly between the two models. The only independent variable was the child’s BMI (calculated from measured weight and height), expressed as a z-score from the UK90 reference population to improve model fit.9 The z-scores were calculated directly from centiles, and represent the distance of a child’s BMI from the reference population mean. Standard errors were adjusted for school-level clustering. Models were initially created by school year (reception or Year 6) within sexes. A lack of variability in the estimates across models suggested that an unadjusted model was appropriate. A post hoc sensitivity analysis showed BMI centile cut points for underweight and overweight in an analogous model adjusted for school year and sex were 0.8 (95% confidence interval [CI] = 0.5 to 1.7) and 99.9 (95% CI = 99.4 to 99.9), respectively.
Using an unadjusted multinomial logistic regression model, cut scores were obtained that represent the points at which a child’s z-score is equally likely to be classified into two adjoining weight status categories, that BMI z-scores were identified at which a child is equally as likely to be described as underweight as healthy weight, or healthy weight as overweight, by their parents. Published equations were used to derive ordinal cut-offs from the univariate multinomial model,13 and verified against the plotted predicted conditional probabilities. To ease interpretation, z-scores were presented as centiles in the results.
Secondary outcome: what predicts misclassification?
Two types of misclassification were defined:
parent-reported weight status (underweight, healthy, overweight, or very overweight) as an underestimate of true weight status (defined using population-level BMI cut-offs), and;
parent-reported weight status as an overestimation.
The effects of ethnic group, IMD quintile, sex, and school year on underestimating weight status versus correctly or overestimating weight status were explored using logistic regression. Overestimating weight status versus correctly or underestimating weight status was explored in a separate, otherwise analogous, model. Standard errors were adjusted for school-level clustering. Because of the low number of overestimations potentially introducing bias,14 the reported results for overestimation were derived from an analogous exact logistic regression model. Central estimates for overestimation were similar to the standard maximum likelihood estimate (MLE) logistic regression.
For the secondary analysis, standard population level (underweight <2nd centile, overweight >85th centile, and very overweight >95th centile), rather than clinical, weight status cut-offs were compared with parent-reported categories. Parents are more likely to have been exposed to these population cut-offs before receiving NCMP feedback on their child’s weight status. Stata (version 12.1) was used for all analyses.
RESULTS
In total, 3397 parents responded to the questionnaire (response rate 15% of all children in the five PCTs). Of these, 139 parents did not complete the question asking about their child’s weight status, and 282 children were not present on PCT records. This left 2976 (88%) children with both parent-reported weight status and a valid NCMP measurement. Responders to the questionnaire were predominantly mothers (87%), followed by fathers (12%), and step- or grandparents (1%). Overall, 68% of responders classified their child into the correct weight status category (Figure 1).

Categorisation of children’s weight status by National Child Measurement Programme (NCMP)-measurement against parent-reported category.
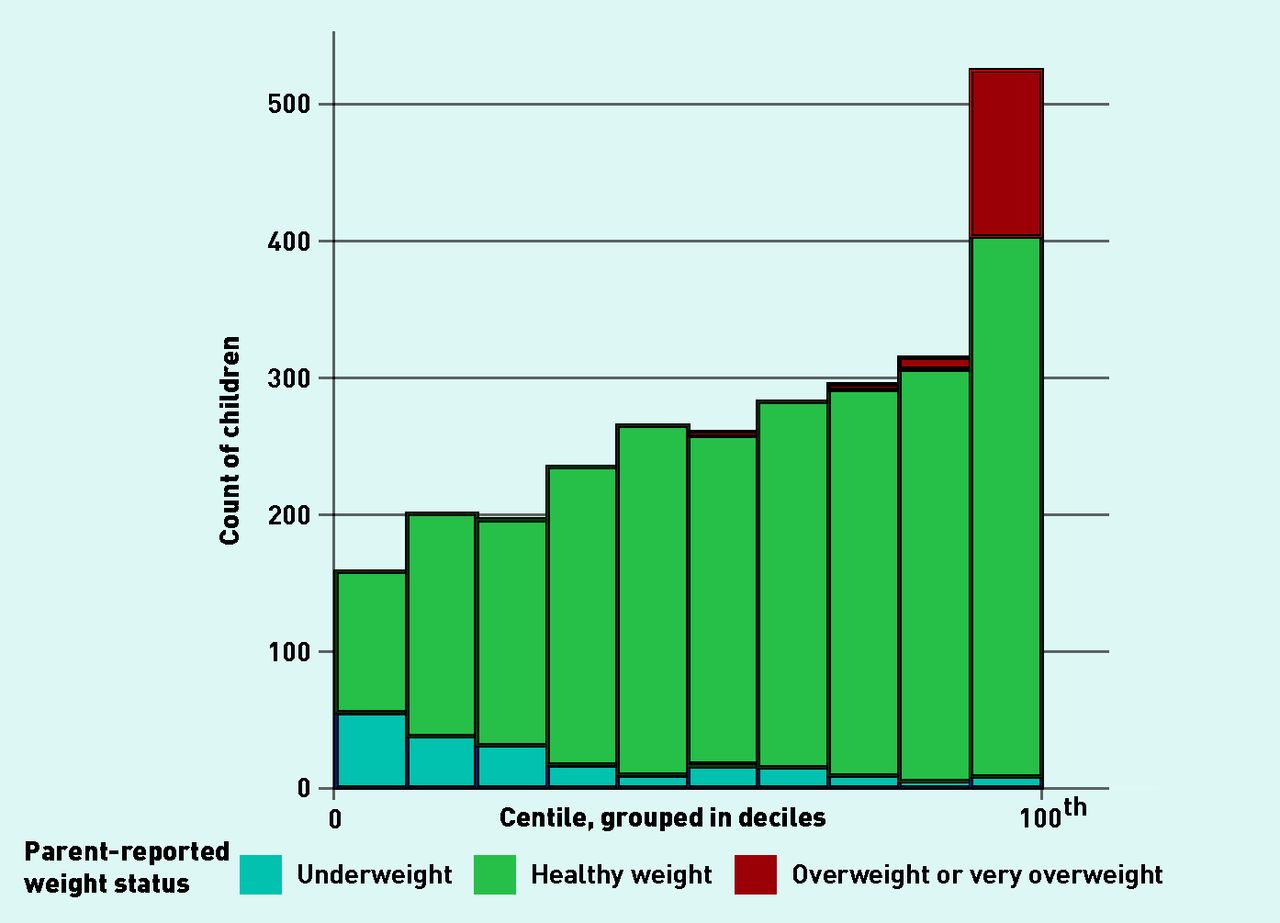
Distribution of body mass index centiles in 2976 children, with bars colour coded by parent-reported weight status within each decile.
The distribution of BMI centiles was skewed, with 20% of children in the highest decile (Figure 2). Four parents described their child as being very overweight, despite 369 being very overweight according to the BMI cut-offs (Figure 1). Using the three level classifications (underweight, healthy weight, and overweight), 72% of parents correctly classified their child.
What do parent-reported cut-offs look like?
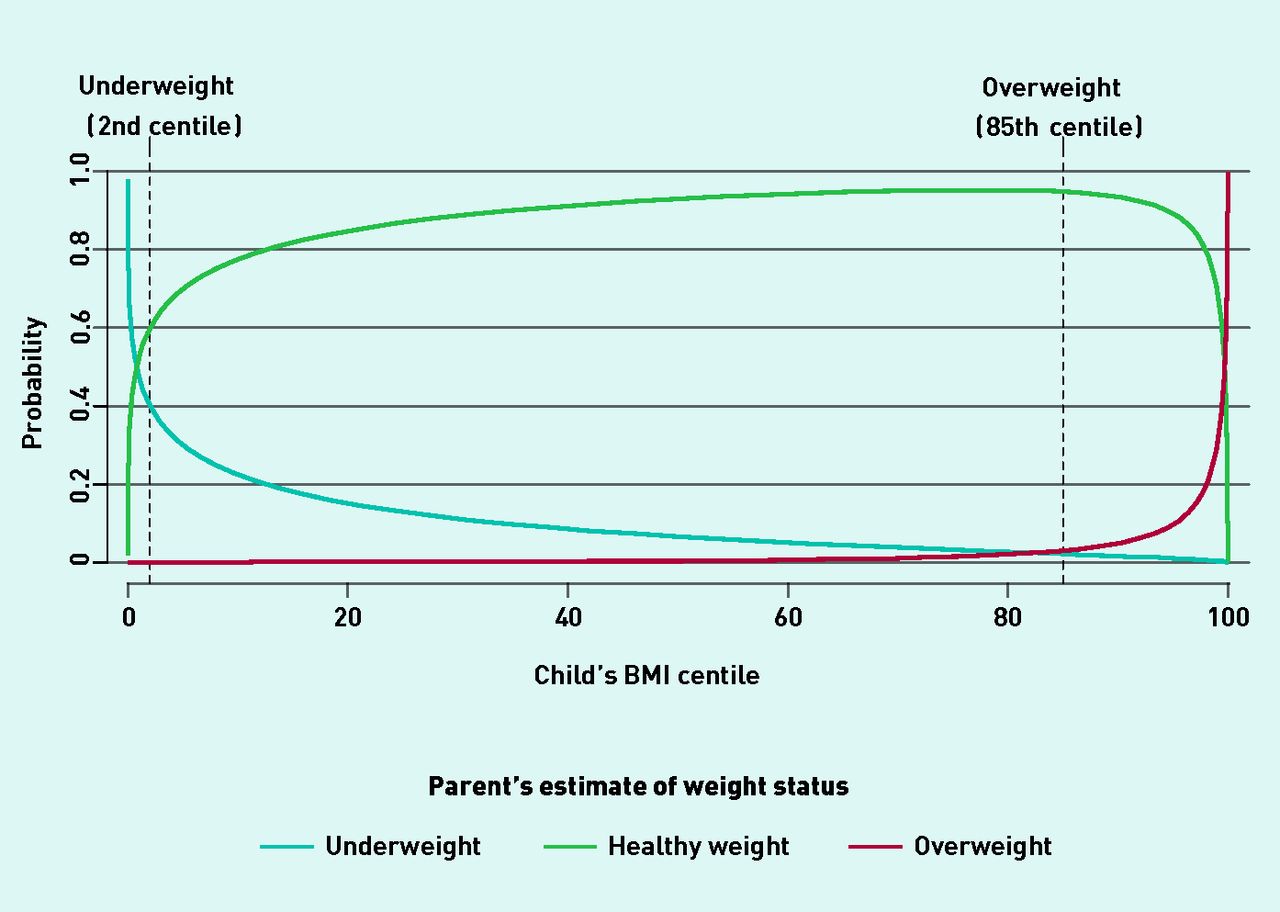
The point at which a parent was equally likely to recognise underweight as healthy weight was when their child had a BMI at the 0.8th (95% CI = 0.4 to 1.1) centile. A parent became more likely to classify their child as overweight, rather than healthy weight, when the child had a BMI ≥99.7th centile (95% CI = 99.3 to 99.9) (Figure 3). As an example, for a child with a BMI at the 98th centile (very overweight), it is estimated that the chance the parent would classify their child as healthy weight is 80% (95% CI = 76 to 83) and there is a 20% (95% CI = 16 to 23) chance of overweight or very overweight. While at the 99.7th centile, a parent has an equal chance of classifying their child as healthy or overweight.
Probability of child’s caregiver classifying their weight as underweight, healthy, or overweight against National Child Measurement Programme (NCMP)-measured body mass index centile in 2976 British children.
What predicts misclassification?
In total, 915 (31%) parents underestimated and 25 (<1%) overestimated their child’s weight status. Parents were more likely to underestimate their child’s weight status if they were black (OR 1.5, 95% CI = 1.1 to 2.1), South Asian (OR 1.6, 95% CI = 1.3 to 2.0), male (OR 1.3, 95% CI = 1.1 to 1.6), or older (OR 1.3, 95% CI = 1.1 to 1.5) (Table 1). Parents from less deprived areas were less likely to underestimate their child’s weight status (IMD quintile, OR 0.8, 95% CI = 0.75 to 0.9). Overestimation of weight status was more likely for 10–11-year-olds than 4–5-year-olds (OR 3.1, 95% CI = 1.2 to 8.5). Ethnic group, deprivation, and sex did not predict parental overestimation of weight status.
Predictors of a parent incorrectly classifying their child’s weight status
DISCUSSION
Summary
Child BMI centile cut-offs were modelled based on parent-reported weight status, and it was found that parents become more likely to classify their children as underweight when they are at the 0.8th centile or below, and overweight at the 99.7th centile or above. These values differ greatly from the BMI centile cut-offs for underweight (2nd centile) and overweight (85th) used widely in the literature, government guidelines, and public health messages. Parents were more likely to underestimate a child’s weight if the child was black or South Asian (versus white), male, more deprived, or the child was older (age 10–11 years versus 4–5 years). Few parents overestimated their child’s weight status, but overestimation was more common among parents of older children.
Strengths and limitations
A large, ethnically and demographically diverse population from five PCTs is represented in this study. Heights and weights for calculation of BMI were measured by trained school nurses as part of the NCMP, which has an exceptionally high participation rate (93% of target population in 2011–2012).8 Although there is concern over using BMI weight status cut-offs for adiposity at an individual level,15 pragmatically, the >98th centile BMI cutoff has moderate sensitivity (71%) and high specificity (98%) relative to clinically measured impedance,15 limiting the number of children being falsely identified as very overweight. Whereas previous studies have found a divergence between parental perception of weight status and objectively measured weight status,6,10,16–18 this study is the first to quantify the disparity between objective cut-offs and cut-offs derived from parental perceptions.
This study assessed parental perception of weight status, and misclassification was explored through comparisons with objectively assessed weight status. As such, it cannot be concluded if the cutoffs reported are specific to parents, or also present in subjective assessments by health professionals.
This study was limited by the low number of parents with very overweight children classifying their children as very overweight, meaning both overweight and very overweight were collapsed into a single overweight category. Few parents overestimated their child’s weight status, and, to reduce bias, methods were used that inflated variance of the estimates, potentially masking smaller associations. Data on parental weight perceptions were collected by postal questionnaire.
The low response rate for the questionnaire introduces the potential for non-response bias: responders to the questionnaire were more likely to be from white ethnic groups and less deprived than the target population (Table 2). The sample characteristics suggest that they were slightly more likely to correctly identify their child’s weight status. Although no substantial changes were seen in the modelled cut-offs stratifying for age and sex, these analyses were underpowered because of small numbers of parents identifying their children as underweight and overweight.
Summary of NCMP population and analysis sample
Comparison with existing literature
The authors are not aware of other studies that have derived BMI cut-offs based on parent-perceived weight status; however, previous studies have shown that parents are more likely to misclassify their child towards the healthy weight category.6,10 In contrast to a literature review of 52 studies that found parents were more likely to misclassify children aged 2–6 years than older children,6 this study found that older children (10–11-year-olds) were more likely to be misclassified than younger children (5–6 years). As has been noted in the literature,16 this study found that parents were more likely to underestimate a boy’s weight status, potentially highlighting sex-specific norms for body composition and appearance. Currently, little is known about parental perceptions of child obesity in Asian communities. In a recent survey of parents with children aged 4–16 years in Liverpool, parental beliefs and attitudes about childhood obesity differed significantly by ethnicity, but this study did not compare parental perceptions with children’s measured weight status.19 In a more methodologically robust study, self-reported weight misclassification did not vary by ethnic group among 11–14-year-olds in a community health survey of an ethnically-diverse population in London.20
Although factors associated with misclassification of weight status have been identified, currently there is limited evidence suggesting mechanisms to explain these differences. Potential explanations may be fear of being judged, unwillingness to label a child as overweight, and shifting perceptions of normal weight because of increases in body weight at a societal level.16
Implications for practice
Parental involvement aids in the promotion of healthy weight maintenance in children.21 A Cochrane Review of interventions for preventing child obesity identified parental support to enact healthy lifestyle changes at home as a promising strategy for weight reduction.21 Evidence suggests that parents who recognise their child’s weight status are more likely to perceive potential health risks.22 Although BMI cut-offs in childhood can be considered arbitrary in some ways (because they are based on population norms rather than specified health risks associated with them), childhood overweight and obesity have been shown to predict adult weight status and the health problems associated with excess weight in adulthood.1,3,5 The parents of some children who are most at risk of health consequences of being overweight, including South Asian boys, appear from these study findings to be least able to detect weight problems in their child.23 Parental perceived weight status cut-offs are judgements based on a diverse range of values, perceptions, and beliefs. If parents are unable to accurately classify their own child’s weight, they may not be willing or motivated to enact changes to the child’s environment that promote healthy weight maintenance.
This study has demonstrated the extreme divergence between clinical and parental classifications of obesity. This discrepancy in perceived weight status is important for policy makers and clinicians to consider in their approaches to obesity prevention; weight management interventions targeted at the parents of overweight children are unlikely to register with the intended audience if few parents consider their child to be overweight. Measures that decrease the gap between parental perceptions of child weight status and BMI cut-offs used by medical professionals may help parents better understand the health risks associated with being overweight and increase uptake of healthier lifestyles.17,22
- Received April 2, 2014.
- Revision requested July 18, 2014.
- Accepted September 9, 2014.
- © British Journal of General Practice 2015
REFERENCES
In this issue


Jump to section
Keywords
More in this TOC Section
Related Articles
Cited By...

