


Abstract
Background Chronic pain and its associated distress and disability are common reasons for seeking medical help. Patients with chronic pain use primary healthcare services five times more than the rest of the population. Mindfulness has become an increasingly popular self-management technique.
Aim To assess the effectiveness of mindfulness-based interventions for patients with chronic pain.
Design and setting Systematic review and meta-analysis including randomised controlled trials of mindfulness-based interventions for chronic pain. There was no restriction to study site or setting.
Method The databases MEDLINE®, Embase, AMED, CINAHL, PsycINFO, and Index to Theses were searched. Titles, abstracts, and full texts were screened iteratively against inclusion criteria of: randomised controlled trials of mindfulness-based intervention; patients with non-malignant chronic pain; and economic, clinical, or humanistic outcome reported. Included studies were assessed with the Yates Quality Rating Scale. Meta-analysis was conducted.
Results Eleven studies were included. Chronic pain conditions included: fibromyalgia, rheumatoid arthritis, chronic musculoskeletal pain, failed back surgery syndrome, and mixed aetiology. Papers were of mixed methodological quality. Main outcomes reported were pain intensity, depression, physical functioning, quality of life, pain acceptance, and mindfulness. Economic outcomes were rarely reported. Meta-analysis effect sizes for clinical outcomes ranged from 0.12 (95% confidence interval [CI] = −0.05 to 0.30) (depression) to 1.32 (95% CI = −1.19 to 3.82) (sleep quality), and for humanistic outcomes 0.03 (95% CI = −0.66 to 0.72) (mindfulness) to 1.58 (95% CI = −0.57 to 3.74) (pain acceptance). Studies with active, compared with inactive, control groups showed smaller effects.
Conclusion There is limited evidence for effectiveness of mindfulness-based interventions for patients with chronic pain. Better-quality studies are required.
INTRODUCTION
Chronic pain is a common condition1 and patients with chronic pain use primary healthcare services up to five times more often than the rest of the population.2 Mindfulness meditation has become an increasingly popular self-management technique for many long-term conditions, including chronic pain. Mindfulness originates from a Buddhist contemplative tradition, and involves self-regulated attention, maintained on immediate experience, and held within an orientation of curiosity, openness, and acceptance.3 The most frequently cited method of mindfulness training is the secular mindfulness-based stress reduction programme (MBSR). Mindfulness meditation practices are taught over 8–10 weeks, with weekly group sessions and daily home practice.4,5 Mindfulness-based cognitive therapy (MBCT) blends features of cognitive therapy with the techniques of MBSR.6 The goal of mindfulness-based interventions is not to alter the experience per se but to change how individuals respond to the experience.7 In this way it may be complementary to medical treatments that target physical symptoms.
There is significant variability in implementation of mindfulness programmes within the NHS. In a UK-wide survey of professionals involved in teaching or implementing mindfulness within the NHS,8 59% of responders reported no or minimal service provision. Where programmes were offered, availability for patients was variable, with recurrent depression the most common eligible condition (78%), reflecting National Institute for Health and Care Excellence (NICE) guidelines.9 Where mindfulness programmes were offered, under half (47%) of responders reported availability for patients with other conditions such as chronic pain or fatigue.8
Previous reviews on mindfulness-based interventions for patients with chronic pain have focused on clinical outcomes.10,11 Humanistic outcomes measure the consequences of a disease or condition on life (for example, physical functioning or health-related quality of life), or moderate the effects of a disease or condition on life (for example, perceived pain control or pain acceptance).12 Only two humanistic outcomes (physical wellbeing and quality of life) have been included previously in a meta-analysis,11 which shows a statistically significant effect of mindfulness on these outcomes. Two recent systematic reviews13,14 have been condition-specific, including only fibromyalgia trials or only low-back pain trials. Meta-analysis14 included quality of life as the only humanistic outcome, and significant improvement was found
How this fits in
Systematic reviews to date on this topic have included both randomised and non-randomised trials, and have focused on clinical outcomes such as pain. Two recent systematic reviews have been condition-specific, including only fibromyalgia trials or only low-back pain trials. This current review looks at management of non-malignant chronic pain as a whole, includes only randomised controlled trials, and uniquely focuses on humanistic outcomes such as pain acceptance and perceived pain control. These are of particular relevance with this self-help technique, as well as clinical and economic outcomes.
Given the goal of mindfulness-based interventions,7 the measurement of humanistic outcomes was considered to be important, and this was explored in this review.
Aim and objectives
The aim of the systematic review was to assess the effects of mindfulness-based interventions for patients with chronic pain on economic, clinical, and humanistic outcomes (ECHO).12
The objectives were to systematically identify randomised controlled studies (RCTs) looking at effects of a mindfulness-based intervention for patients with chronic pain compared with an active or inactive control group, assess these studies on standard quality criteria, carry out a meta-analysis, and describe the effects shown in these studies on the ECHO.12
METHOD
Literature search
The MEDLINE®, Embase, AMED, CINAHL, PsycINFO, and Index to Theses electronic databases were systematically searched to identify eligible studies on 3 April 2013 (see Appendix 1 for search strategy). Search terms including chronic pain conditions and mindfulness were used in various combinations with relevant Boolean operators.
Inclusion and exclusion criteria
Study populations and sites
There were no limitations on age, ethnicity, or sex of study populations, nor sites. Chronic pain was defined as pain persisting for ≥13 weeks.15
To minimise heterogeneity in the sample, studies of patients solely with irritable bowel syndrome, multiple sclerosis, chronic fatigue syndrome, or with malignant pain were excluded.
Interventions
Studies on mindfulness-based interventions for chronic pain were considered if they followed the standard MBSR or MBCT format. Studies using modifications of the standard MBSR or MBCT courses were considered if they included group-based mindfulness meditation tuition and a course length of at least 6 weeks.
Study design
Studies were included if they were RCTs with active or inactive control groups. There were no restrictions on dates, language, or publication status. Also, studies were included that measured any combination of ECHO at the end-of-intervention point.12
Data management
The list of titles and abstracts was screened by one reviewer against the inclusion and exclusion criteria in two separate stages and excluded as appropriate. Full-text articles were retrieved and reviewed against the inclusion criteria, and reasons for exclusion of studies at the full-text stage were recorded for each study.
Outcomes, data extraction, and quality assessment
The effect of mindfulness on outcomes was compared at 8 weeks (that is, at the end of a standard mindfulness programme) between intervention and control groups. A data extraction tool (available from the authors on request) was developed and piloted to be applied to all included studies. This included fields for describing the ECHO and all items from the quality rating scale developed by Yates et al (2005).16 The Yates Quality Rating Scale (YQRS) has been developed to assess the quality of RCTs of psychological trials for chronic pain. Studies were not excluded based on quality. However, study quality was taken into account when discussing outcomes. Independent duplicate data extraction was undertaken for each included study. Discrepancies were resolved through discussion between data extractors and a third independent opinion sought where consensus could not be reached.
Analysis
The standardised mean difference (SMD) using the Hedges’ g formula was calculated as an effect size measure for all outcomes (Hedges’ g is abbreviated to ‘g’ in the remainder of this article). Results were scaled so that a positive effect size means that the study favours the intervention group compared with the control group. Ninety-five per cent confidence intervals (95% CI) were reported for effect sizes. Statistical significance was defined for this review as having a 95% CI that did not include zero.
For the three 3-armed trials,17–19 the pooling formulae20 shown in Figure 1 were used to combine the two control groups, to allow a single between-group SMD to be calculated.

Pooling formulae. (N = sample size, M = mean, 1 = group 1, 2 = group 2, SD = standard deviation).
The pooling formulae were also used to combine results where they were presented only as subgroups.17 For the cluster-randomised study,17 results were adjusted for the effect of clustering, in accordance with standard practice.20
Where data were judged to be of sufficient quality and homogeneity, SMDs were combined in a random-effects meta-analysis using RevMan software. This model was chosen due to the diversity of study designs, chronic pain conditions, and control groups. The level of heterogeneity between study results was measured for each combined result using the χ2 test. The I2 statistic was calculated to represent the impact of heterogeneity.20 Subgroup analyses investigated differences in effect according to whether the control group was active or inactive.
Quality of evidence
The GRADE recommendations21 were used to judge the quality of the evidence and the strength of recommendations given in this review.
RESULTS
Of the 2463 titles identified, 11 studies (12 articles) were eligible for inclusion (Figure 2).17–19, 22–30
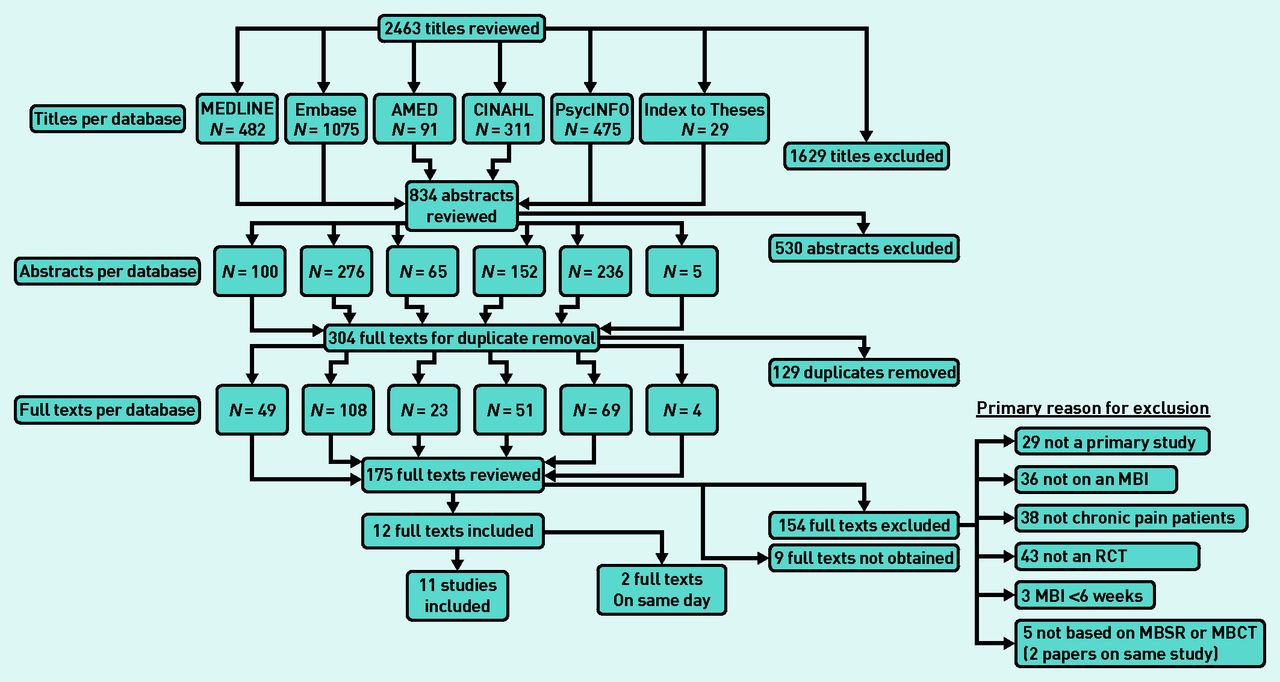
PRISMA flowchart. MBI = mindfulness-based intervention. MBSR = mindfulness-based stress reduction. MBCT = mindfulness-based cognitive therapy. RCT= randomised controlled trial.
Included studies
Of the included studies, eight were conducted in the US,17,18,22–24,26–28 one in Germany,29 one in Hong Kong,30 and one in the UK.25 The majority of participants were female (with the exception of one study26) and white (with the exception of one study30). The mean age of participants ranged from 47–52 years, except the two studies with older adults27,28 (mean age 75 years). The majority of participants had completed secondary education and/or had a college qualification. Where employment status was reported, the majority were either employed or retired.19,22,23,27,28,30 Chronic pain populations studied were fibromyalgia (three studies),19,22–24 rheumatoid arthritis (two studies),17,29 chronic musculoskeletal pain (two studies),18,27 failed back surgery syndrome (one study),26 and mixed aetiology (three studies).27,28,30 Control groups included active comparator (six studies),17–19,24,27,30 waiting list control group (five studies),19,22,23,26,28,29 and standard care (two studies).18,25 Active comparators were educational control group,17,19,24,27 massage,18 multidimensional pain intervention (mainly educational),30 and cognitive behavioural therapy for pain.17 There were three 3-armed studies.17–19 Ten studies were randomised by patient18,19,22–30 and one was cluster randomised.17 Only four studies17,19,22,30 had involved sample size calculations and were adequately powered to detect an effect. Of the remaining seven studies, four were feasibility or pilot studies with small sample sizes,18,26–28 one failed to recruit,29 and two to retain24,25 target numbers. Included studies and their characteristics are displayed in Table 1.
Methodological details of individual randomised controlled trials included (outcome data shown in Figure 3).
Four studies looked at economic outcomes: prescribed and over-the-counter medication use (three studies);19,24,26 use of complementary/alternative therapies (one study);24 doctors’ appointments (two studies);19,24 and sickness absence from work (one study).30
All eleven studies looked at clinical outcomes: pain intensity (eight studies);17,18,24–28,30 and depressive symptoms (six studies).17,19,22,24,29,30 Only three studies27,28,29 specifically collected data on adverse events but in practice none were reported.
Health-related quality of life (six studies)18,19,25,27,28,30 and physical functioning (five studies)19,24,26–28 were the most commonly reported humanistic outcomes. Three studies measured patient-centred outcomes (personal treatment goals,19 personal value of components of intervention,29 global impression of change,27 and perceived success at helping their back problem27). All outcomes measured are shown in Figure 3.
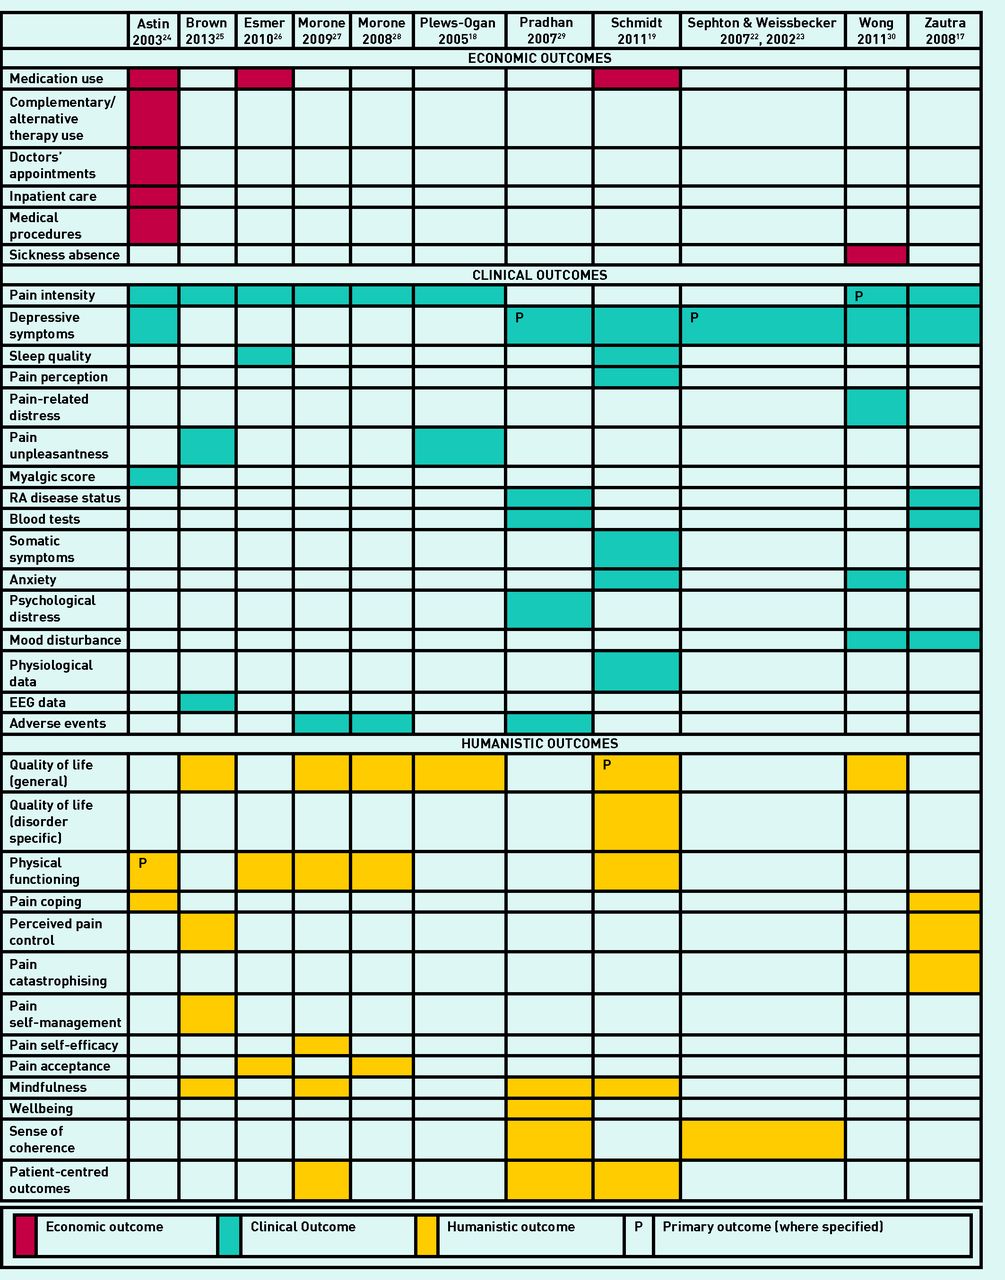
Outcome measures with primary outcomes identified where these are the basis for power calculation. EEG = electroencephalography. RA = rheumatoid arthritis.
Study quality and risk of bias
The YQRS scores of included studies varied from 10–31 points out of 35. The quality criteria commonly not met by studies included: adherence to manual (10 studies18,19,22–30), 6-month follow-up (nine studies18,19,22–29), attrition bias (differential rates of attrition between groups) (eight studies20–22,24–27,29,30), performance bias (differential equivalence in treatment expectations between groups) (eight studies17,18,22–26,28,29), and selection bias (independent allocation bias) (seven studies18,19,22–26,28). The quality rating for each of the studies is illustrated in Figure 4.

Yates Quality Rating of Studies. Items with two cells were allocated 2 points on the Yates Scale. Items with only one cell were allocated 1 point.
There is also the wider issue of publication bias that may have arisen due to dissemination of research findings being influenced by the nature and direction of results.20 Due to the small number of included studies, a funnel plot was not appropriate.
Recruitment and attrition
Recruitment to studies was generally by advertisements (posters, flyers, and at health fairs). An average of 47% of participants assessed and invited were randomised (range 4%25 to 87%26). Rates of attrition from studies are shown in Table 1. Drop-out from the mindfulness intervention ranged from 2%17 to 50%18 (median 20%), and drop-out from the mindfulness 8-week programme was higher than from active control group programmes, with two exceptions.17,24 Loss to follow-up ranged from 8–50% of intervention groups (median 20%) and from 0–52% of control groups (median 11%). Individual studies reported that drop-outs had a lower level of education (P = 0.05),28 were older (P = 0.03),27 and had greater baseline symptom severity (P = 0.005)22,23 and poorer physical functioning (P = 0.05).22,23
Economic outcomes
Only four studies24,26,19,30 reported an economic outcome. In two studies,19,24 the results of economic outcomes were unavailable. In one study30 reporting sickness absence from work, results were non-significant. One small study26 reported significantly reduced analgesic use in the mindfulness group.
Meta-analysis results
The following sections report results of meta-analyses for outcomes reported by more than one study for mindfulness compared with any control group. These are shown in Table 2, which also reports the subgroup analyses.
Meta-analysis results
Clinical outcomes
Physical health outcomes
Pain intensity was the most reported pain outcome (eight studies17,18,24–28,30 with a combined effect size of 0.16 (95% CI = −0.03 to 0.36; I2 = 0%). Two studies19,26 measured sleep quality (combined effect size: 1.32 (95% CI = −1.19 to 3.82) but this meta-analysis had some evidence of heterogeneity (I2 = 95%).
Humanistic outcomes
Health-related quality of life (HRQoL)
Four studies18,24,28,30 reported both a physical health component of HRQoL (combined effect size: 0.16 (95% CI = −0.15 to 0.47; I2 = 8%) and a mental health component (combined effect size of 0.37 (95% CI = −0.07 to 0.82; I2 = 46%).
Physical functioning
Five studies19,24,26–28 reported physical functioning (combined effect size: 0.22 (95% CI = 0.00 to 0.45; I2 = 0%).
Pain-related humanistic outcomes
Pain-related humanistic outcomes were looked at in six studies.17,24–28 There was a combined effect size of 1.58 (95% CI = −0.57 to 3.74) for pain acceptance (two studies26,28) (I2 = 91%) and of 0.58 (95% CI = 0.23 to 0.93) for perceived pain control (two studies17,25) (I2 = 0%).
Individual results and graphs
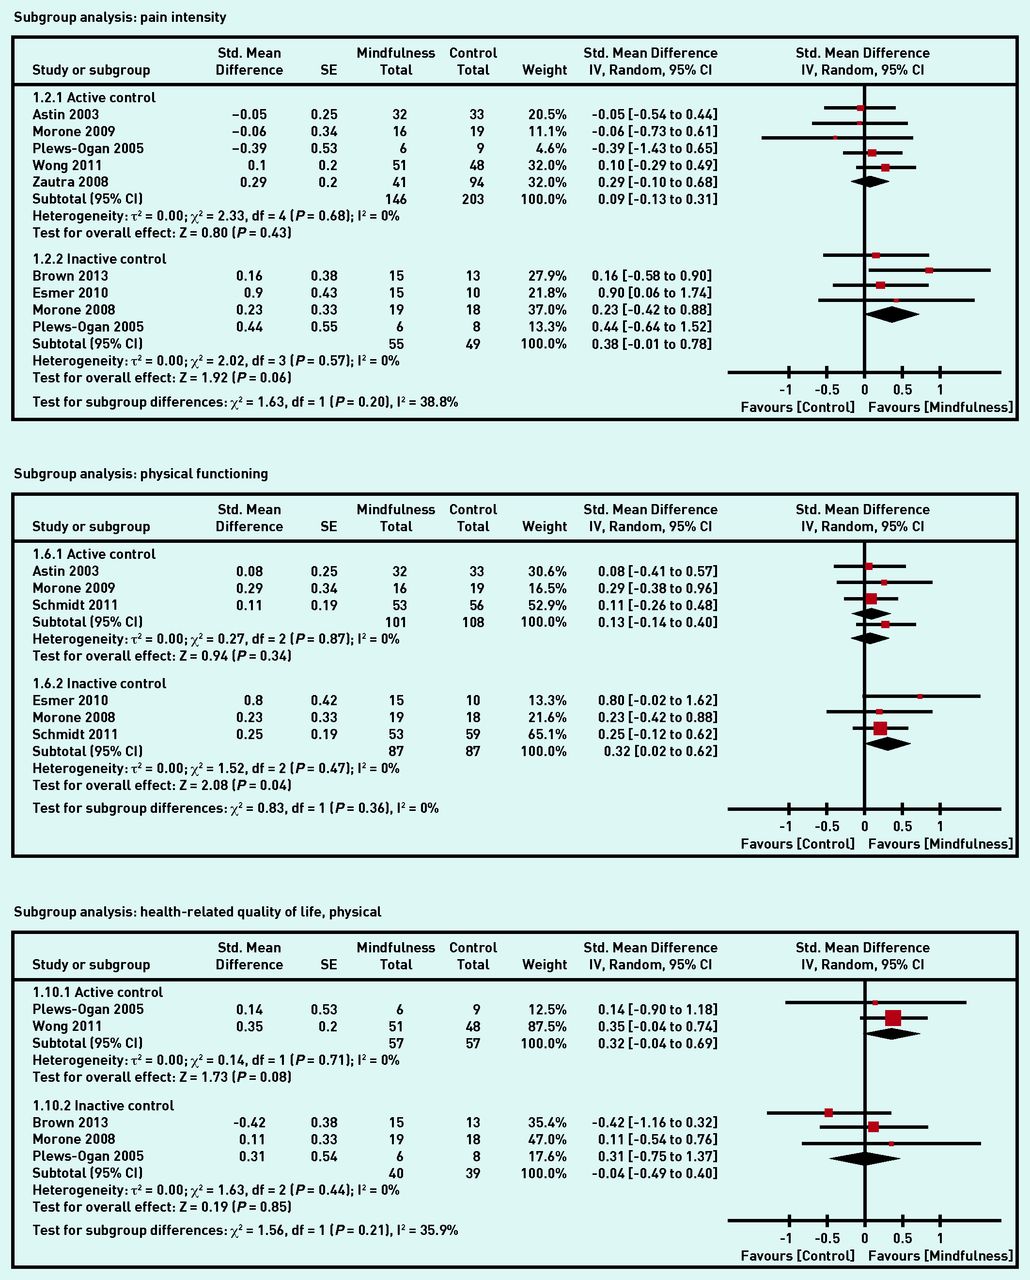
Tables of pre-post and between-group SMD (95% CI) calculated for each individual study outcome are available from the authors on request. See Appendix 2 for Forest plots with meta-analysis data for selected outcomes.
DISCUSSION
Summary
This systematic review found limited evidence for the effectiveness of mindfulness-based interventions in chronic pain. Individual studies were generally small and results for most outcomes were not statistically significant. Meta-analysis revealed that mindfulness-based interventions may have a positive impact on perceived pain control with a moderate effect size (g = 0.58), but there was no evidence of a benefit in terms of clinical outcomes such as pain intensity or depression. Separate subgroup analysis restricted to trials with inactive control groups found some evidence of improved physical functioning and quality of life (mental health component). When studies with active control groups were looked at separately, the effect of mindfulness was generally found to be equivalent to the active comparator. Included studies were of mixed methodological quality.
Strengths and limitations
As with all reviews, despite a rigorous search process some studies may have been missed. Title and abstract screening was carried out by just one reviewer and not duplicated.
Some of the pooled effects were based on small numbers of studies. Trait anxiety, sleep quality, pain acceptance, and perceived pain control were based on combining only two studies each. The random-effects model was selected for the meta-analysis due to the heterogeneity of study designs, outcome measures, and study results. This model may not be appropriate when combining as few as two studies due to the difficulty with estimating between-study variability, but it was thought appropriate to present results using a consistent approach.
Included studies had their own limitations; seven studies18,24–29 had small sample sizes and may have been underpowered to detect an effect. Second, recruitment method and participation rates will have resulted in self-selected samples. Retention in mindfulness-based intervention groups was poor and only four studies19,22,28,30 carried out intention-to-treat (ITT) analysis. Including studies that only analysed programme completers as well as those that used ITT analysis may have resulted in bias favouring treatment.
Fidelity to the intervention as delivered was often not assessed.18,19,22–25 It is unknown whether participants were engaging in daily home practice as recommended. Frequency of practice may affect outcomes as seen in one included study.29 Additionally, not all interventions included all recommended components of an MBSR or MBCT programme. For example, three17,27,28 of the included studies did not involve mindful movement, and six17,18,24,25,27,28 did not include an all-day practice session. Only two19,25 had mindfulness programme facilitators with any specific training or experience in delivering the programme to patients suffering from chronic pain.
Comparison with the existing literature
The previous meta-analysis11 that included other acceptance-based interventions as well as MBSR and non-randomised studies found small effects on pain, depression, and physical wellbeing. This current review including only RCTs and only MBSR found no significant effect on clinical outcomes. It also uniquely found that studies comparing mindfulness with inactive control groups were more likely to show significant effect on humanistic outcomes than comparisons with active control groups.
Implications for research and practice
GRADE recommendations: the strength of the recommendation of mindfulness-based interventions for patients with chronic pain based on effects found in this review is weak. Most effects were not statistically significant when compared with controls and when pooled in meta-analysis. According to GRADE,21 the quality of evidence in this review is low (RCTs were often small, results inconsistent with wide CIs, and heterogeneity between studies).20 Further research is likely to have an important impact on the confidence in the estimate of effect and may change the estimate.
The outcome measures recommended by IMMPACT31 include pain, and the most commonly-reported outcomes in the included studies were pain and depression. It is questionable whether pain intensity and other clinical outcomes are the most appropriate outcomes to measure, given that the goal of mindfulness-based interventions is not necessarily to alter the symptom experienced but rather to increase self-management and coping.7 However, there is some preliminary evidence from small neuroimaging studies that pain perception may be influenced by meditation.32
Evidence for a statistically significant effect of mindfulness was found only for humanistic outcomes. This reinforces the need to choose appropriate outcomes to assess an intervention. Surprisingly, however, this review did not find evidence of statistically significant improvement in pain acceptance or mindfulness. The result of no significant change in pain acceptance was based on two very small studies that had high heterogeneity.26,28 Mindfulness improved in the intervention group over the control in only two19,25 of the four19,25,27,29 included studies that measured it. Three25,27,29 of the studies, however, used the Mindful Attention and Awareness Scale (MAAS) as their measure of mindfulness, which is unidimensional and has been found to be less sensitive to change in novice meditators.33
Suggestions for future research would be: first, to measure humanistic outcomes and outcomes of value to patients; second, to measure mindfulness using a multidimensional scale that is more sensitive to change in novice meditators, such as the Kentucky Inventory of Mindfulness Skills (KIMS) or the Five Facet Mindfulness Questionnaire (FFMQ),34 and, finally, given the high attrition rates from mindfulness-based interventions, research is needed to address retention issues before progressing to an adequately powered, appropriately controlled trial.
Appendix 1. Search strategy example
An example of search terms and strategies applied. (Applied for MEDLINE database on 3 April 2013)
|
Appendix 2. Forest plots with meta-analysis data for selected outcomes.


Notes
Funding
Funding for Fathima L Marikar Bawa was provided by the following NHS Education Scotland fellowships: Scottish Clinical Research Excellence Development Scheme (SCREDS) Clinical Lecturer fellowship; Academic Fellowship in General Practice.
Ethical approval
Not applicable.
Provenance
Freely submitted; externally peer reviewed.
Competing interests
The authors have declared no competing interests.
Discuss this article
Contribute and read comments about this article: bjgp.org/letters
- Received September 22, 2014.
- Revision requested November 28, 2014.
- Accepted February 2, 2015.
- © British Journal of General Practice 2015
REFERENCES
In this issue


Jump to section
More in this TOC Section
Related Articles
Cited By...

