


Article Figures & Data
Figures
- Figure 1.
Flow chart of the study process. 2003–2004 data, Spain. CVD = cardiovascular disease.
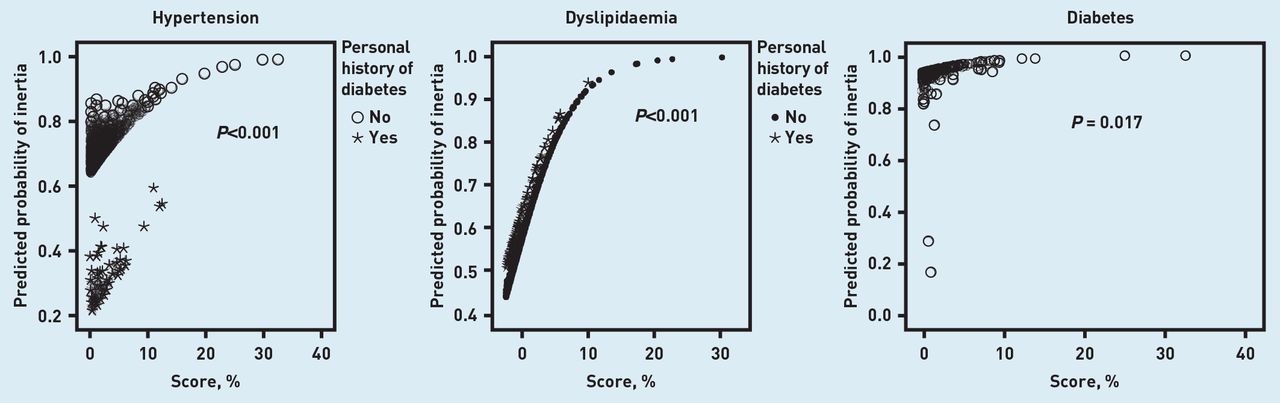
- Figure 2.
Predicted probabilities of diagnostic inertia and their relationship with the SCORE cardiovascular risk in hypertension, diabetes and dyslipidaemia. 2003–2004 data, Spain. P-values correspond to the goodness-of-fit of the multivariate models.


Tables
- Table 1.
Analysis of inertia for recognising cardiovascular risk factors in obese patients at primary healthcare centres
Variable Unknown hypertension with HBP n = 1816 Inertia: n = 1275 Adjusted OR for inertia (95% CI)a Unknown dyslipidaemia with high TC n = 3341 Inertia: n = 1796 Adjusted OR for inertia (95% CI)b Unknown diabetes with high FBG n = 359 Inertia: n = 335 Adjusted OR for inertia (95% CI)c Male sex n (%) 858 (47.2) – 1320 (39.5) – 184 (51.3) – Personal history of hypertension, n (%) – – 750 (22.4) – 116 (32.3) – Personal history of dyslipidaemia, n (%) 169 (9.3) – – – 53 (14.8) – Personal history of diabetes, n (%) 135 (7.4) 0.18 (0.12 to 0.26) 148 (4.4) 1.29 (0.91 to 1.82) – – Personal history of smoking, n(%) 383 (21.1) – 690 (20.7) – 85 (23.7) – Age, years, mean ± SD 53.2±7.1 – 53.1±7.1 – 53.7±7.0 – SBP, mmHg, mean ± SD 144.6±13.4 – 133.2±16.8 – 139.3±19.7 – DBP, mmHg, mean ± SD 88.3±8.8 – 81.9±10.2 – 84.8±11.4 – TC, mmol/L, mean ± SD 5.6±1.0 – 6.0±0.8 – 5.6±1.2 – FBG, mmol/L, mean ± SD 6.0±2.0 – 5.7±1.6 – 8.8±3.2 0.99 (0.99 to 1.00) BMI, kg/m2, mean ± SD 33.4±3.2 1.05 (1.02 to 1.09) 33.3±3.2 1.01 (0.98 to 1.03) 34.5±3.9 0.99 (0.89 to 1.11) SCORE, %, mean ± SD 2.0±2.3 1.11 (1.05 to 1.18) 1.6±2.6 1.25 (1.19 to 1.31) 2.1±2.9 1.16 (0.89 to 1.50) BMI = body mass index. DBP = diastolic blood pressure. FBG = fasting blood glucose. HBP = high blood pressure. FBG = fasting blood glucose. n (%) = absolute frequency (relative frequency). OR = odds ratio. SBP = systolic blood pressure. SD = standard deviation. TC = total cholesterol. For hypertension and dyslipidaemia inertia, OR were adjusted for personal history of diabetes, BMI and SCORE. For diabetes inertia, OR were adjusted for FBG, BMI and SCORE. Sex, hypertension, dyslipidaemia, smoking, age, SBP, DBP, and TC not included in the multivariate model due to collinearity with SCORE. For hypertension and dyslipidaemia inertia, FBG not included in the multivariate model due to collinearity with diabetes. Goodness of fit of the models: hypertension χ2 = 103.9, P < 0.001; dyslipidaemia χ2 = 111.3, P < 0.001; diabetes χ2 = 10.2, P = 0.017.
↵a P-values: personal history of diabetes, <0.001; BMI, 0.005; SCORE, <0.001.
↵b P-values: personal history of diabetes, 0.156; BMI, 0.628; SCORE, <0.001.
↵c P-values: BMI, 0.901; SCORE, 0.266; FBG, 0.008.
In this issue


Jump to section
Keywords
More in this TOC Section
Related Articles
Cited By...

