


Abstract
Background In international studies, greater investment in primary health care is associated with improved population health outcomes.
Aim To determine whether investment in general practice is associated with secondary care utilisation, patient satisfaction, and clinical outcomes.
Design and setting Retrospective cross-sectional study of general practices in England, 2014–2015.
Method Practice-level data were stratified into three groups according to GP contract type: national General Medical Services (GMS) contracts, with or without the capitation supplement (mean practice income guarantee), or local Personal Medical Services (PMS) contracts. Regression models were used to explore associations between practice funding (capitation payments and capitation supplements) and secondary care usage, patient satisfaction (general practice patient survey scores), and clinical outcomes (Quality and Outcomes Framework [QOF] scores). The authors conducted financial modelling to predict secondary care cost savings associated with notional changes in primary care funding.
Results Mean capitation payments per patient were £69.82 in GMS practices in receipt of capitation supplements (n = 2784), £78.79 in GMS practices without capitation supplements (n = 1672), and £84.43 in PMS practices (n = 3022). The mean capitation supplement was £5.72 per patient. Financial modelling demonstrated little or no relationship between capitation payments and secondary care costs. In contrast, notional investment in capitation supplements was associated with modelled savings in secondary care costs. The relationship between funding and patient satisfaction was inconsistent. QOF performance was not associated with funding in any practice type.
Conclusion Capitation payments appear to be broadly aligned to patient need in terms of secondary care usage. Supplements to the current capitation formula are associated with reduced secondary care costs.
- general practice
- health care economics
- health services research
- primary care
- primary care funding
- secondary care utilisation
INTRODUCTION
Primary care is often described as the cornerstone of a strong healthcare system. Starfield et al 1 demonstrated across a wide range of international settings that greater investment in primary health care is associated with improved population health outcomes, reduced secondary care usage, and reduced overall health costs.1–4 In spite of this evidence, funding for primary care in England has reduced by 6% in real terms, 2005–2006 to 2013–2014.5 Over the same period, overall workload has increased by 16%.6 In contrast, real-term secondary care funding has increased by 2% per annum.7
International studies of funding in primary care and outcomes have been hampered by a lack of nationally comparable practice-level funding data. In England, general practice funding consists of several components (Figure 1), the largest of which are capitation-based payments, weighted according to factors affecting GP workload, such as the proportion of older patients or reported prevalence of long-term limiting illness.8,9 In early 2015, the UK Department of Health released the first national summary of general practice funding data, with the promise of further details in future years, including summaries of GP earnings.10 To date, no country outside the UK has released similar funding data. The authors aimed to use these data to explore the association between funding and outcomes. First, they wanted to investigate whether the association seen in international studies between investment in primary care and lower secondary care costs applied at a national level in England.1 The secondary aim was to determine the association between primary care investment, patient satisfaction, and achievement of Quality and Outcomes Framework (QOF) targets.11,12 Finally, the authors aimed to use financial modelling in order to quantify the relationship between notional increases in primary care funding and modelled changes in secondary care costs.13
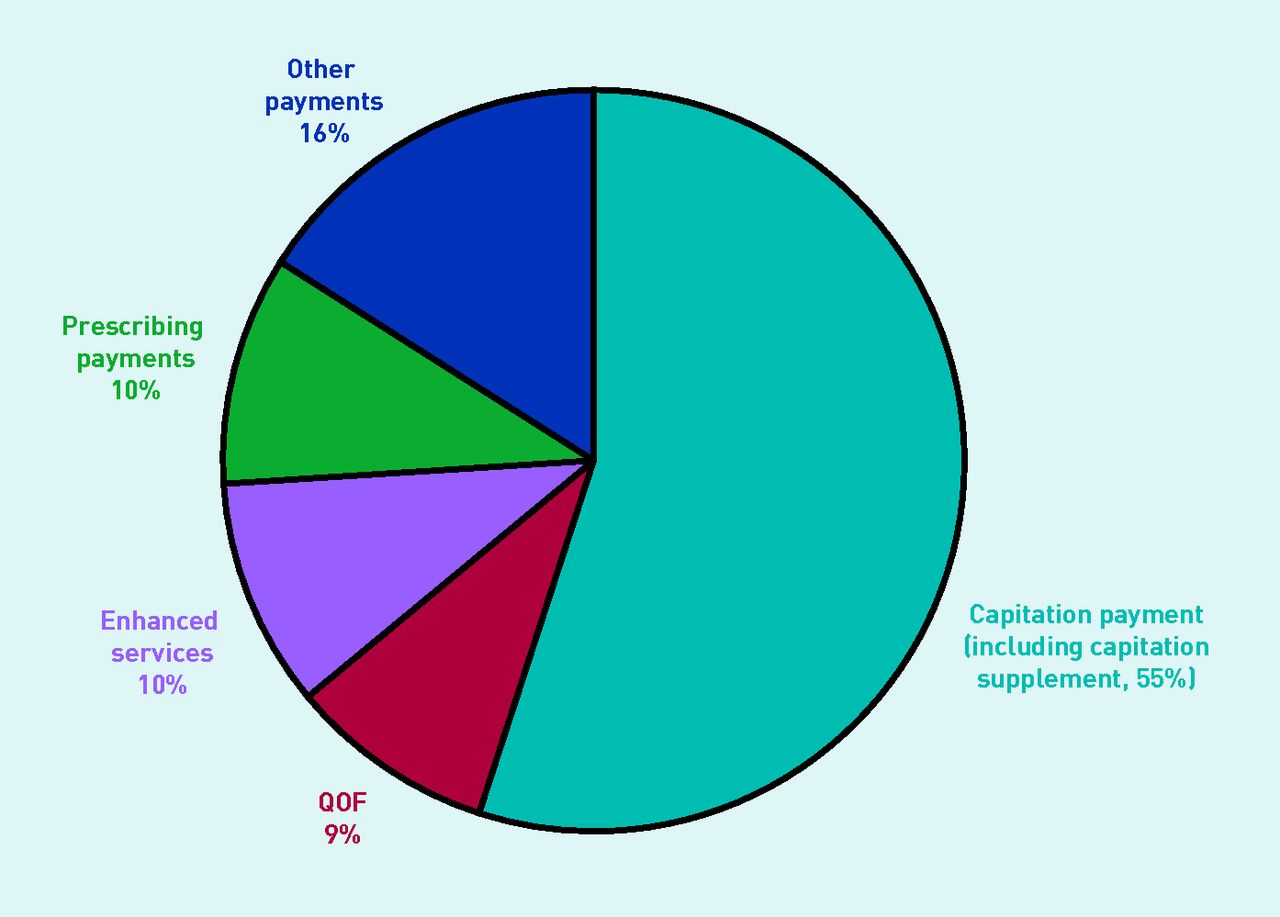
NHS payments to general practices in England for 2014–2015. QOF = Quality and Outcomes Framework.
METHOD
Study design
A retrospective cross-sectional study was conducted using practice-level data for the 2014–2015 financial year. In order to adjust for confounding, the authors obtained practice and demographic characteristics.
Practice data
Descriptive data for all general practices in England were obtained from the General and Personal Medical Services database.14 Variables that the authors considered to be associated with practice achievement and funding were obtained (Table 1). The authors included Index of Multiple Deprivation (IMD 2015) data, calculated using patient data attributed to lower-layer super output areas (LLSOAs). Similarly, the authors included ethnicity data derived from the 2011 national census and allocated to LLSOAs.15,16
Characteristics of general practices and their populations in England, 2014–2015 (n = 7478)
How this fits in
In international studies, greater investment in primary health care is associated with improved population health outcomes and reduced secondary care usage. This is the first national study to explore the relationship between core funding allocated to GP practices and objective measures of practice outcomes, including secondary care utilisation, patient satisfaction, and clinical target achievement. The authors found evidence that increased funding to practices in the form of capitation supplements was associated with lower levels of secondary care utilisation. Financial modelling has been used to illustrate the potential savings in secondary care costs that might be associated with additional investment in capitation funding. Findings related to core funding and patient satisfaction were mixed. There was no relationship with clinical target achievement.
Secondary care outcomes
The authors obtained data for the year 2014–2015 for emergency hospital admissions, hospital admissions for ambulatory care sensitive conditions (ACSCs), accident and emergency (A&E) attendances, and outpatient attendances from hospital episode statistics, a national database of NHS secondary care activity.17
General Practice Patient Survey
The General Practice Patient Survey (GPPS) is an annual survey of patient satisfaction sent to a nationally representative sample of patients registered at all general practices in England, with findings reported at practice level. GPPS unweighted data were obtained for the 2014 calendar year. Weighted data were not used because the analysis adjusted for demographic variables.18
During 2014, 2.6 million questionnaires were distributed, with an overall response rate of 33% (858 381 completed responses). This study focused on responses to the question asking about overall satisfaction with the general practice (Question 28). Responses were scored according to the percentage of patients reporting the most positive of available responses (a ‘very good’ experience).
QOF data
The authors obtained data from the national QOF dataset covering the financial year 2014–2015. For the analysis, the authors used the total QOF score for each practice. This score is based on achievement of a series of both process and outcome targets relating to long-term condition management and public health targets.19
General practice funding data
The authors calculated the 2014–2015 capitation payment for each practice as £ per registered patient. They defined three different types of practice in England according to the method of allocating capitation payments: practices with a national contract (General Medical Services [GMS] practices) that receive capitation payments weighted according to a needs-based formula,20 GMS practices with a national contract that, in addition to their weighted capitation payment, receive a capitation supplement based on higher historical budget allocations (mean practice income guarantee [MPIG] payments),21 and practices with a locally negotiated contract (Personal Medical Services [PMS] practices). A fourth type of practice contract, Alternative Personal Medical Services (APMS), was excluded from the analysis because the authors considered that these short-term contracts may have distorted the relationship between funding and outcomes. The authors analysed capitation payments and capitation supplements separately, in order to determine the relative effects of each type of capitation funding.
Participants
The authors linked practice (n = 7767) with GPPS data (n = 7607 practices), and excluded atypical practices with <750 registered patients (n = 19), or those with <500 patients (n = 22 practices), or >5000 (n = 129 practices) per full-time equivalent GP, following a previously used method.22
Statistical analysis
Univariable analysis was used to identify differences between the three types of general practices included in the study. Linear regression models were used to explore the association between practice funding, adjusted for confounders, and the outcome variables of secondary care usage, patient satisfaction, and QOF achievement (Table 2). Non-normality of outcomes was addressed by re-checking regression models following logit transformation to normalise the distribution. For the QOF analysis, where scores clearly depart from a normal distribution, the authors repeated the analysis using a logit transformed score following the method used previously.23 This made no appreciable difference to the results, therefore the untransformed coefficients are presented here. Model assumptions were tested graphically using Q–Q and P–P plots to test for normality of the residuals.
The relationship between practice funding types and secondary care utilisation, patient satisfaction, and QOF scores: multivariable regression models
Mean funding per patient was entered into the regression models as a predictor variable. Other predictor variables included in the models are shown in Table 2. Funding outliers were removed by excluding the highest and lowest funded 2% of practices. Further sensitivity analysis was conducted by excluding 1% outliers. Multicollinearity was tested using the variance inflation factor (VIF) and variables with a value for VIF >10 were excluded. The authors accounted for local area effects by adjusting for clustering at clinical commissioning group (CCG) level. STATA version 14 was used for all statistical analysis.
For the financial modelling, the authors estimated the effects of a notional 10% increase in capitation funding, or a 100% increase in capitation supplement funding, on the secondary care outcome measures. The higher percentage increase in capitation supplement was chosen for the model because their value per patient is much smaller than for capitation funding. The authors obtained secondary care costs using the Department of Health reference unit costs for the 2014–2015 financial year.24 Regression coefficients were used to estimate the change in secondary care utilisation rates, assuming a notional percentage increase in capitation or capitation supplement funding. These changes were converted into estimates of primary care costs and projected secondary care savings. A worked example is given at the end of Table 3. Data on ACSC hospital admissions were excluded from the modelling assumptions to avoid double counting, because ACSC admission costs may have contributed to emergency hospital admission costs.
Financial modelling showing the relationship between modelled changes in practice funding and secondary care costsa
RESULTS
Following exclusions, the final sample consisted of 7478 practices (96.3% of all practices in England). Of these, 4456 (59.6%) practices held GMS contracts, 2784 [37.2%] practices received capitation supplements, 1672 [22.4%] did not receive capitation supplements, and 3022 (40.4%) practices held PMS contracts. Table 1 describes the main characteristics of general practices included in the study, their registered populations, and demographic features.
The mean funding per patient in GMS practices in receipt of the capitation supplement was £69.82, with an additional £5.72 for the capitation supplement (total £75.54), £78.79 in GMS practices with no capitation supplement, and £84.43 in PMS practices. The models linking funding and outcomes for different practice funding types are illustrated in Table 2.
Secondary care utilisation was not associated, or only weakly associated, with capitation funding in the three types of practices included in the study (Table 2). In contrast, capitation supplements were significantly associated with secondary care utilisation: higher levels of capitation supplement were associated with reduced A&E attendances (B = −0.99; P = 0.04), reduced emergency admissions (B = −0.33; P<0.001), and reduced ACSC admissions (B = −0.05; P = 0.01).
Patient satisfaction was not consistently associated with funding. QOF performance was not associated with funding in any of the models (Table 2).
The financial models are summarised in Table 3. The models only apply to secondary care usage and exclude all non-significant values on regression modelling (Table 2). The only model with substantial savings was based on a notional 100% increase in capitation supplements. This resulted in an additional cost of £5720 in capitation supplements per 1000 registered patients, which was offset by modelled secondary care savings of £6280, representing a saving of 110% of the notional investment in capitation supplements. Much smaller notional savings in outpatient attendance were observed in the only other model that fulfilled the modelling criteria (Table 2).
Practices in receipt of capitation supplements differed from practices not receiving supplements. They had lower weighted capitation payments (Table 2), which was the result of lower Carr-Hill weightings.20 In particular, these practices had fewer registered patients aged ≥75 years (7.69% compared with 8.41% in GMS practices without MPIG, t = −7.35, P<0.001), fewer with limiting long-term illness (index values of 95.8 and 110.4, respectively, t = −22.74, P<0.001), and lower levels of deprivation (IMD 2015 values of 22.52 and 30.38, respectively, t = −14.87, P<0.001).
Sensitivity analyses
The authors repeated the analysis excluding the 1% outliers and obtained almost identical results in terms of the strength and significance of the relationship between funding and each included outcome. They also repeated the analysis on the 2013–2014 dataset, the first year for which funding data was released. Although much data were missing in this sample, the authors found similar strength and significance of relationship between funding and outcomes.25
DISCUSSION
Summary
Of the three models of general practice included in the study, only practices in receipt of capitation supplements (MPIG payments) demonstrated a clear association between higher levels of funding and reduced secondary care utilisation. In these practices, it was additional capitation supplements rather than additional capitation payments that were associated with reduced secondary care use. When applied to practices in receipt of capitation supplements, modelled secondary care savings exceeded the notional cost of additional investment in capitation payments. Practices in receipt of capitation supplements differed from other practices. They had lower weighted capitation payments, indicative of lower ‘needs-based’ funding, a function of a younger, healthier population situated in more prosperous areas, and the likely explanation for lower baseline secondary care utilisation values. These practices had been protected from financial loss through receipt of capitation supplements following the introduction of the 2004 GP contract.26
In PMS practices, the authors found no evidence that additional investment was associated with any of the outcomes included in the study. PMS practices have additional, locally based clinical targets as part of their contract, which the authors were unable to study, reduction of secondary care usage was not one of the stated goals of PMS practices,27 and additional funding may have been redirected to local target achievement. Alternatively, better funded PMS practices may have reached a funding level where additional funding failed to release further secondary care savings. Differences in baseline secondary care utilisation did not appear to provide an explanation because unadjusted utilisation rates were higher in PMS practices, whereas the largest modelled reductions in utilisation were found in practices with lower baseline utilisation. The lack of association between funding and reported patient satisfaction is unexpected. The alignment between PMS practice funding and the need to address local priorities could have been expected to translate into higher satisfaction.
Financial modelling has demonstrated a divergence, in terms of secondary care usage, between modelled increases in capitation payments (in GMS and PMS practices) and capitation supplements (in GMS practices). The authors hypothesise that capitation funding is broadly allocated according to patient need.20 Increased capitation funding would therefore be directed towards the additional demands of patients with greater need for primary care services, thus negating any possible reduction in secondary care utilisation. In contrast, the MPIG acts as a supplement to the capitation payment, based on historical funding rather than an assessment of healthcare needs, and is available as additional primary care investment. For practices in receipt of capitation supplements, modelled savings indicate that these supplements are cost-effective in terms of secondary care savings. Modelled savings are likely to have been underestimated because ACSC admissions had to be excluded from the model and may have made a further contribution to savings. The authors hypothesise that capitation supplements are invested in primary care activity and staff, increasing the capacity of primary care, and correspondingly reducing demand on secondary care.28
Associations were either absent or weak between practice funding and outpatient attendance. Although additional funding might allow the practice more time for elective work, other studies have reported that investment in additional specialist training did not reduce outpatient referrals.29
Similarly, no association was found between additional capitation-based funding and QOF performance, probably because QOF as an incentive scheme is separately funded (Figure 1). Although difficult to cost, and not part of the financial modelling, the authors found some evidence linking additional funding in GMS practices with higher patient-reported satisfaction.
Strengths and limitations
This study is the first to explore the relationship between practice-level funding and secondary care usage. The authors have been able to estimate values for modelled savings and the implication that supplements to capitation payments are invested in supporting the management of patients in primary care who might otherwise have required emergency care or hospitalisation. A variety of sensitivity analyses included in the methodology have confirmed the robustness of the regression modelling.
As with all observational studies, significant associations, even if large, may not be causal. The authors included a wide range of potential confounders in the models, although residual confounding cannot be excluded. There may be other reasons why practices in receipt of MPIG payments demonstrated higher potential secondary care savings in the models. Prior to 2004, these practices had higher income levels than GMS practices not in receipt of this supplement, and at that time practices with higher income were more likely to have been innovative practices investing more in staff, extra services, and equipment, particularly in more deprived areas, thereby producing better outcomes.30,31 Findings in these practices, although they represent a majority of GMS practices, may not generalise to other practices. Finally, these findings relate to capitation-based payments and supplements that only account for 55% of practice funding. Further study is needed on the relationship between other funding sources and measurable primary care outcomes.
Comparison with existing literature
Recent work in Scotland has shown a mismatch between primary care funding and clinical need, providing further evidence of the inverse care law.32 Similarly, GP payments in England have been found to correlate negatively with some healthcare need predictors, such as deprivation, non-white ethnicity, and multimorbidity.33 However, neither study included secondary care outcomes or financial modelling in their analyses. An observational study examining the relationship between funding, contract status, and QOF score in general practices found that GMS practices were the most efficient, achieving higher QOF scores with less funding.34 However, the authors did not report on the role of MPIG payments in their findings, and the study sample was limited to 164 practices. In contrast, this national dataset did not show a relationship between GP funding and QOF. Given the long-term trend for transferring care out of hospitals into the community, and the lack of real increases in general practice capitation funding, more studies are needed on the consequences of these shifts in the locus of care.
Implications for research
There is increasing acceptance from UK policymakers that primary care requires a larger share of healthcare funding.35,36 However, more detailed models are required to guide investment decisions based on economic efficiency. This study provides new evidence that primary care investment could translate into reductions in secondary care costs, although longitudinal evaluation would offer stronger evidence of a causal relationship. The findings suggest that capitation payments are broadly aligned to patient need, at least in terms of secondary care usage. However, supplements to the current capitation formula may produce a reduction in secondary care costs. If these findings are borne out by further studies, proposed reductions in capitation supplements may be counterproductive.
Notes
Funding
None given.
Ethical approval
Not applicable.
Provenance
Freely submitted; externally peer reviewed.
Competing interests
The authors have declared no competing interests.
Discuss this article
Contribute and read comments about this article: bjgp.org/letters
- Received December 11, 2016.
- Revision requested January 19, 2017.
- Accepted March 17, 2017.
- © British Journal of General Practice 2017
REFERENCES
In this issue


Jump to section
Keywords
More in this TOC Section
Related Articles
Cited By...

