


Abstract
Background Population factors, including social deprivation and morbidity, predict the use of emergency departments (EDs).
Aim To link patient-level primary and secondary care data to determine whether the association between deprivation and ED attendance is explained by multimorbidity and other clinical factors in the GP record.
Design and setting Retrospective cohort study based in East London.
Method Primary care demographic, consultation, diagnostic, and clinical data were linked with ED attendance data. GP Patient Survey (GPPS) access questions were linked to practices.
Results Adjusted multilevel analysis for adults showed a progressive rise in ED attendance with increasing numbers of long-term conditions (LTCs). Comparing two LTCs with no conditions, the odds ratio (OR) is 1.28 (95% confidence interval [CI] = 1.25 to 1.31); comparing four or more conditions with no conditions, the OR is 2.55 (95% CI = 2.44 to 2.66). Increasing annual GP consultations predicted ED attendance: comparing zero with more than two consultations, the OR is 2.44 (95% CI = 2.40 to 2.48). Smoking (OR 1.30, 95% CI = 1.28 to 1.32), being housebound (OR 2.01, 95% CI = 1.86 to 2.18), and age also predicted attendance. Patient-reported access scores from the GPPS were not a significant predictor. For children, younger age, male sex, white ethnicity, and higher GP consultation rates predicted attendance.
Conclusion Using patient-level data rather than practice-level data, the authors demonstrate that the burden of multimorbidity is the strongest clinical predictor of ED attendance, which is independently associated with social deprivation. Low use of the GP surgery is associated with low attendance at ED. Unlike other studies, the authors found that adult patient experience of GP access, reported at practice level, did not predict use.
INTRODUCTION
In the UK, emergency departments (EDs) are an important interface between primary and secondary care, with considerable overlap in the conditions presented in both settings.1,2 Rates of attendance at EDs have risen steadily over the past 50 years, from 105 out of 1000 population in 1961 to 241 out of 1000 in 1991.3 By 2015–2016, the national attendance rate was 373 out of 1000 population, with highest attendance in urban areas. Rates for London are higher still at 466 out of 1000, although these numbers include sizeable populations who are not registered with a GP.4,5
Population use of EDs predicts the use of other hospital services. On average, 20% of attenders will be admitted to hospital, and 10% referred to outpatients.5 These rates have changed little over the last 30 years.6
Previous studies have identified population factors that predict ED attendance, and factors in primary care provision that might mitigate this growth in demand. Both national and local studies find that socioeconomic deprivation, levels of population morbidity,6–9 and distance from the ED unit6–8 are the major population influences on attendance.
Studies on factors in general practice that may predict attendance have shown associations between lower rates of ED attendance and measures of satisfaction with access to primary care, derived from the GP Patient Survey (GPPS),7,9,10 and also with measures of continuity of care.11,12
Improvements in the primary care management of people with long-term conditions (LTCs) might be expected to alleviate pressure on EDs, but there is little evidence to support this. Performance in the UK Quality and Outcomes Framework (QOF) does not appear to predict ED attendance.7,9,11
Most previous studies have used aggregated general practice-level data (including practice size, staffing, QOF register size and performance scores, practice Index of Multiple Deprivation [IMD], and GPPS responses) to explore associations between population factors, practice factors, and use of EDs. In contrast, this study uses linked primary and secondary care patient-level data to explore in more detail the characteristics of people who attend EDs.
The aim of this study was to determine whether the association between deprivation and adult ED attendance is explained by multimorbidity and other clinical factors in the GP record, and to quantify the effect of population factors on ED attendance.
METHOD
Design and setting
The study used a retrospective cohort of linked primary care and ED attendance data from 819 590 GP-registered patients. The study was based in the three geographically contiguous East London CCGs of Newham, Tower Hamlets, and City & Hackney, with a combined population of 937 334 people registered at 141 general practices. In the 2011 UK Census, 48% of the population in these three CCGs was recorded to be of non-white ethnic origin,13 and the English indices of deprivation 2015 show that all three feature in the eight most socially deprived boroughs in England.14
How this fits in
Previous practice-based studies have found that population levels of socioeconomic deprivation and long-term conditions are the major influence on ED attendance. Using linked primary and secondary care data the authors show that the population burden of multimorbidity is the strongest predictor of ED attendance, explaining much of the association with social deprivation. Higher use of the GP surgery is associated with higher rates of ED attendance.
Data sources
The target population included all patients registered at the 141 practices on or before 1 July 2013. Primary and secondary care usage data were extracted for each patient for the 2-year study period from 1 January 2014 through 31 December 2015 from the North and East London Commissioning Support Unit (NELCSU), which holds EMIS-Web primary care data linked to hospital Secondary Uses Services (SUS) data.15 Data were extracted on secure N3 terminals using SQL Server Management Studio (2014). All data were anonymous, and managed according to UK NHS information governance requirements. Data from five practices opening or closing during the study period were excluded (Appendix 1).
Clinical measures
To assess multimorbidity, the authors extracted the presence of 16 (QOF) long-term conditions, with an earliest recorded Read Code prior to the start of the study, using version 33 of the QOF business rule set.16 The conditions included were asthma, atrial fibrillation, cancer, coronary heart disease (CHD), chronic kidney disease (CKD), chronic obstructive pulmonary disease (COPD), dementia, depression, diabetes, epilepsy, heart failure, hypertension, learning disabilities, serious mental illness, peripheral arterial disease (PAD) and stroke, and transient ischaemic attack. The authors used the total count of these QOF LTCs per person as the principal measure of multimorbidity in the adult population.17,18 They also explored the effect of different exclusive clusters of LTCs (cardiovascular, respiratory, and mental health) in a sensitivity analysis.
The authors collected routine clinical data on body mass index (BMI) and smoking status as the latest recorded Read Codes prior to the start of the study period. BMI values were categorised (underweight, normal, overweight, and obese), applying the separate ranges for the South Asian population.19
Health service use
The authors extracted a count of contacts with a GP, including surgery consultations, home visits, and telephone contacts, over a 2-year period. This excluded contacts with nurses and other healthcare professionals, as there is considerable variation in the assignment coding of nonmedical consultations to different categories of user.20 Data for each ED visit included ED provider, department type, date, time, referral source, and disposal/discharge code.
Distance to nearest ED provider
To extract distance to nearest ED for each patient in kilometres the authors used the shortest road distance from the population centre of the lower super output area (LSOA) of residence for each patient.8,15 The resulting variable was restricted in the statistical analyses to those patients with LSOAs in the three study CCGs and the five bordering CCGs (Barking & Dagenham, Haringey, Islington, Redbridge, and Waltham Forest).
Sociodemographic variables
Self-reported ethnicity was recorded at the practice during registration or routine consultation. Ethnic categories are based on the 2011 UK census and for this study were combined into three major categories: white (British, Irish, other white), black (black African, black Caribbean, black British, other black, and mixed black), South Asian (Bangladeshi, Pakistani, Indian, Sri Lankan, British Asian, other South Asian, or mixed Asian). The authors used the English indices of deprivation (IMD) 2015 score as a measure of social deprivation. They mapped the IMD score to each patient LSOA and derived internal quintiles for the study population. The authors also mapped the national IMD 2015 quintile value, based on scores across England, to each LSOA.14
Patient experience scores
Based on the findings of previous studies,7,9 the authors included two questions on GP access — satisfaction with opening hours and experience of making an appointment — and one generic question about overall satisfaction from the GPPS 2014.21 The proportion of patients answering positively to each question, by practice, was included in the regression models.
Statistical analysis
The authors’ primary outcome measure was ED attendance per year, per patient at all department types, excluding attendances at walk-in centres.
A secondary outcome measure was derived by identifying attendances classified as ‘no follow-up’ in the ‘disposal/discharge’ coding. The authors considered that these patients had conditions that may have been amenable to management in primary care settings.
All statistical analysis was undertaken in Stata (version 14). The authors used two-level mixed-effect univariate and multivariate regression models where both patient and practice explanatory variables were included in the fixed part of the model, and patients were nested within practices. Separate multivariate models were developed for children and adults.
RESULTS
From a GP-registered population of 937 334, the authors extracted 819 590 (87%) linked records from 136 practices, which formed the study population (Appendix 1). Among this study population, 30.6% of patients had a record of ED attendance, generating 505 868 attendances for analysis over the 2-year study period. Of these attendances, 77% were to a type 1, consultant-led major unit, 6% to a type 2, mono-specialty unit (for example, an ophthalmic hospital), and 17% to a type 3, minor injury and/or urgent care centre. The crude annual attendance rate was 308.6 per 1000 population. Based on recorded discharge codes, 38% had no follow-up, 18% were admitted to hospital, and 15% were discharged to their GP for further follow-up.
The characteristics of the study population, and completeness of data recording, are shown in Table 1. Ethnicity recording was 90% complete, with 54% of children and 45% of adults of black African/Caribbean or South Asian ethnicity. The recorded adult smoking prevalence of 21.6% was above the England average of 16.9%.22
Characteristics of the study population (n = 819 590)
Social deprivation and ED attendance
Figure 1(a) shows the age profile of attendance rates per 1000 population, stratified by internal IMD 2015 quintiles. The pattern of attendance rates by age mirrors that of national figures.23 The effect of increasing social deprivation on ED attendance rates was uniform across all age groups. Overall, there was a 52% increase in crude attendance rates when comparing the most deprived population quintile (attendance rate 366.1 out of 1000) to the least deprived (attendance rate 240 out of 1000). These differences were more pronounced when the national IMD quintiles were applied (attendance rate of 160.2 out of 1000 for the least deprived quintile, and 346.2 out of 1000 for the most deprived quintile [Appendix 2]).
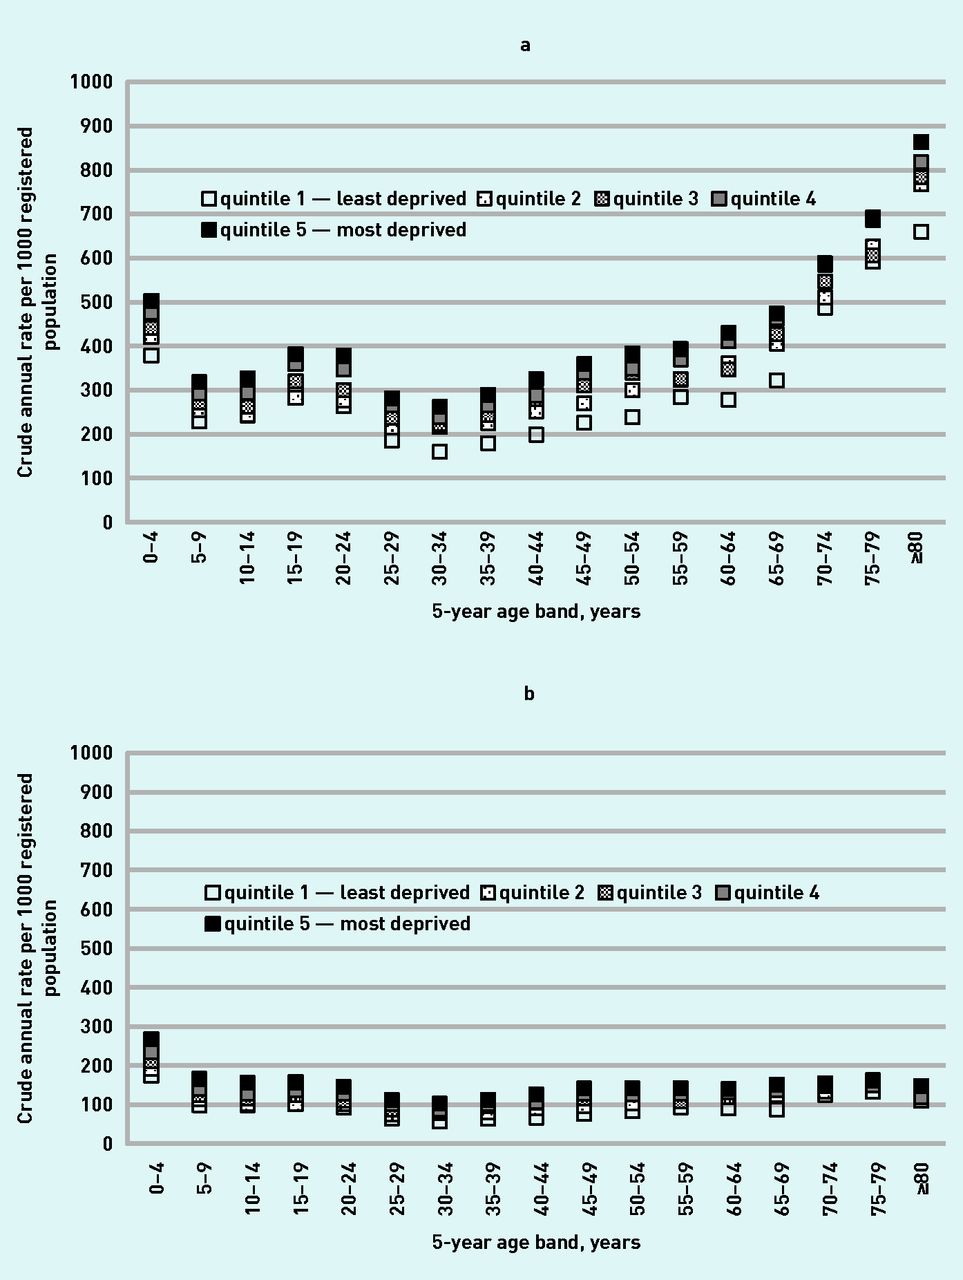
a: Five-year age profile of crude attendance rates per 1000 population by IMD 2015 population quintile (internal). b: Five-year age profile of crude attendance rates with no follow-up per 1000 population by IMD 2015 population quintile (internal). IMD = Index of Multiple Deprivation.
Attendances with a discharge outcome of ‘no follow-up’ (Figure 1b) show little variation by age. However, there is a similar gradient of increased rates of attendance among those with higher levels of deprivation.
The amplification effect of increasing deprivation is consistently observed for other predictor variables of multimorbidity, ethnic group, GP consultations per year, and distance to the nearest ED (Appendix 3).
Multimorbidity
In the adult population, 19.8% had a single LTC, and 2% had four or more LTCs. Figure 2 illustrates the increased prevalence of multimorbidity, by age, for those with one or more attendances at an ED over the study period. The univariate analysis shows a trend of increasing ED attendance with increasing morbidity, with a sixfold increase in attendance rates in those with four or more comorbidities (Table 2).
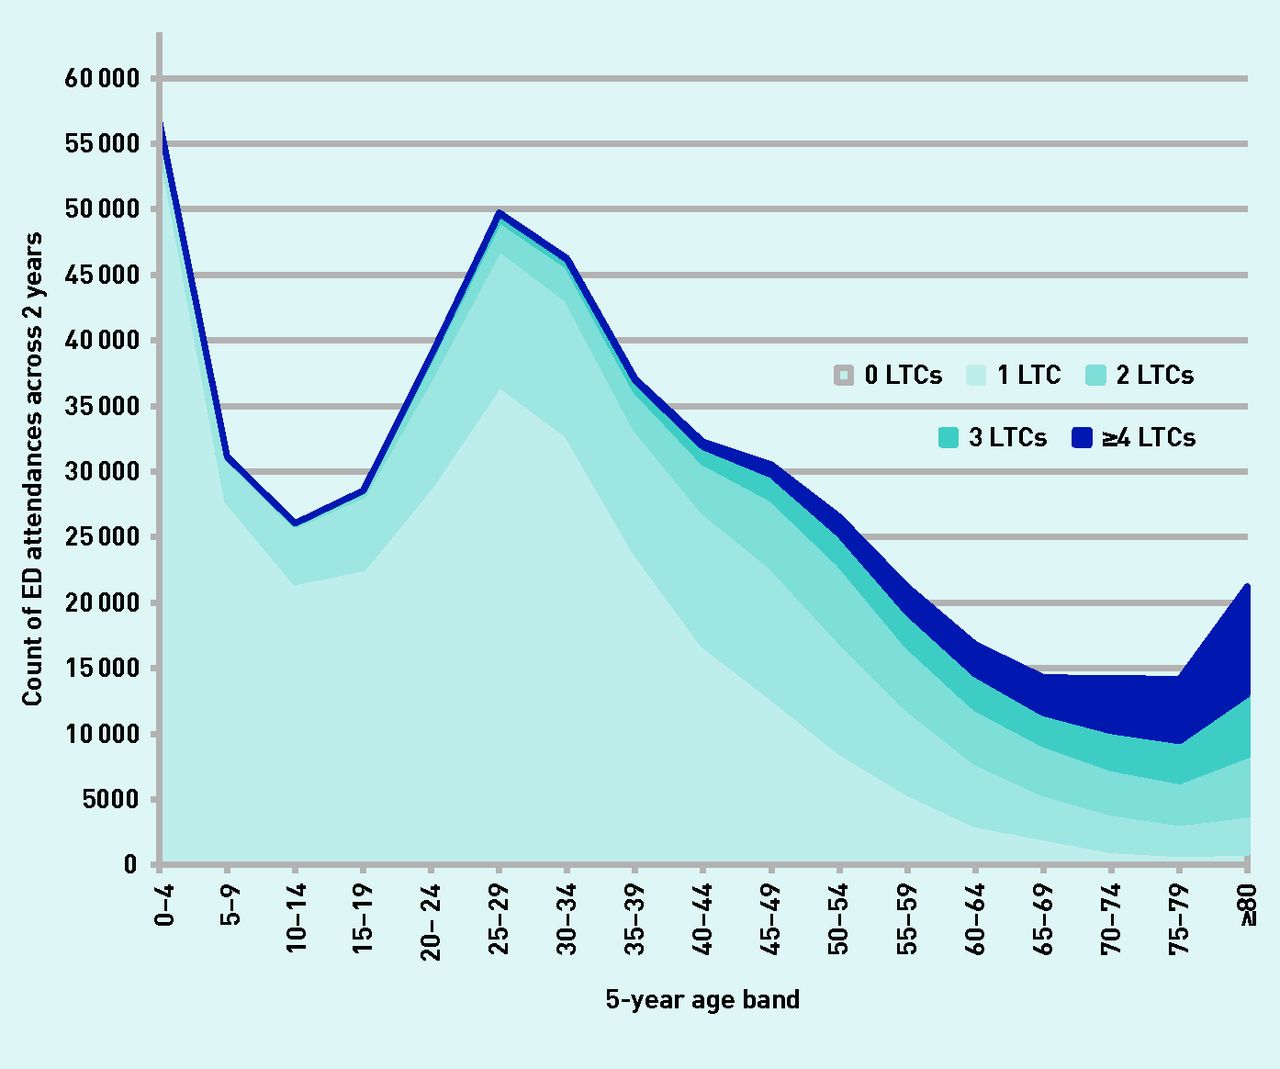
Two-year ED attendance count by multimorbidity profile and 5-year age band. ED = emergency department. LTC = long-term conditions.
Model for predictors of ED attendance for adults aged ≥18 years (n = 548 637 cases contributing to model)a
Ethnicity
Figure 3 shows age-banded crude ED attendance rate by the main ethnic groups in the population. A discrete rise in attendance rates is seen among young adults (ages 20–39 years) in the black African/Caribbean population.
Multivariate analysis: predictors of ED attendance
The multivariate model for adults (Table 2) shows that the most important independent clinical factors predicting attendance were increasing numbers of LTCs and smoking status. Adults who were housebound or in care homes comprised 0.6% of the adult population; these residential settings also predicted attendance. Population factors were significant predictors, with lower rates of attendance among South Asian groups, and higher rates for black African/ Caribbean groups, in comparison with the white adult population. Increasing distance from the ED reduced attendance (see Appendices 3 and 4). Once multimorbidity had been accounted for, there was a small residual effect of increasing social deprivation. The adjusted model showed highest attendance rates in the youngest and oldest adult groups.
The synergistic effect of increasing multimorbidity, social deprivation, and smoking can be quantified. Compared with people living in the least deprived areas with no recorded QOF morbidity and not smoking, people in the most deprived areas with four or more long-term conditions who also smoke had almost three times the odds of ED attendance (OR 2.75, 95% CI = 2.02 to 3.74).
Among the primary care predictive factors, the authors found that patients with no consultations in the previous year have a very low ED attendance. As expected, there is a strong association between higher rates of surgery attendance and ED attendance.2 The authors found no significant relationship between the GPPS responses and ED attendance.
A sensitivity analysis exploring the effect of different LTC clusters (cardiovascular, respiratory, and mental health) on ED attendance did not provide evidence of particular LTCs driving increased attendance.
The multivariate regression model for children is shown in Table 3. Both South Asian and black African/Caribbean children are less likely to attend than the white reference population. Increasing distance from the ED reduces attendance, and increasing social deprivation and increased numbers of GP consultations predict attendance in a comparable way to the adult model.
Model for predictors of ED attendance for children aged 0–17 years, n = 192 607 cases contributing to modela
DISCUSSION
Summary
Using linked primary–secondary patient-level data, the authors show that people with multimorbidity are more likely than people without multimorbidity to attend ED, with a rise in ED attendance for every increase in level of morbidity. The association with age (>65 years) was attenuated after adjustment for multimorbidity, and the residual association may be related to reduced functional status, frailty, and morbidities not captured by the disease domains included in the QOF. Even accounting for physical and mental multimorbidities, which are more common and occur at a younger age among those from socioeconomically deprived areas,21 more socially disadvantaged people still had higher rates of ED attendance. This may be related to unmeasured psychological and social problems. It may also be the case that there are fewer personal, family, and community resources available to these patients.24

Ten-year age profile of crude attendance rates per 1000 population by ethnic group.
The crude annual ED attendance rate for this GP-registered study population was 308.6/1000 population, considerably below the figures for England (373/1000), or London as a whole (466/1000), reflecting the younger age of the study population. The authors found that patients with more attendances at EDs also have higher GP consultation rates. This suggests that the year-on-year rise in ED attendance is not primarily accounted for by poor access to primary care, but rather by increased patient complexity and longevity, a view also suggested by a recent King’s Fund review.25 Those patients with the lowest rates of GP consultations also had low ED attendance. The authors found that responses to the GPPS were no longer a significant predictor of adult attendance once patient level multimorbidity and other clinical factors were accounted for.
Strengths and limitations
The strength of this study lies in the use of linked primary and secondary care data, from a multiethnic population registered with 136 general practices in adjoining CCGs in inner East London. This allows for an accurate identification of the demographic, clinical morbidity, and other risk factors associated with each ED attendance. The almost complete ethnicity recording gives a unique ability to explore ethnicity as a predictor of ED attendance. Although these findings are not generalisable to the entire population, they will be relevant to many inner urban areas with similar levels of material deprivation and ethnic minority populations.
Limitations include the common limitation of using routinely collected clinical data for such research. There will be inaccuracies in the clinical dataset, and it is likely that there will be under-recording of at least some morbidities.
In contrast with other studies of multimorbidity and hospital admission,18,30 which use an extended list of morbidities, the authors used a count of the 16 morbidities identified in the UK pay-for-performance QOF, as these are generally well recorded across practices. Other studies suggest that simple morbidity counts are effective as measures of primary care cost and activity.17 However, the authors were not able to capture any measures relating to severity or social complexity, which may contribute to differential rates of ED use or the decision to attend.
Comparison with existing literature
The findings are consistent with previous studies that have identified population factors, including socioeconomic deprivation, the proportion with a longstanding illness, and distance from the unit, as predictors of ED attendance.6–9,26,27 The findings also reflect data from general practice that show an increase in numbers of consultations, by quintile of deprivation, across the age range.28
Other studies have found that ED attendance varies with ethnicity. Baker et al,9 in a local study based in Leicester, found higher use of ED associated with white ethnicity. Scantlebury et al,7 in a national study, found results similar to these: lower rates among South Asian groups and higher rates among black African or Caribbean groups, in comparison white the white majority adult population. The decision to attend ED is patterned by culture, perception of disease severity, and previous experience. It is notable that the bulge in attendance in the black population is only seen among the young adult population (Figure 3), which may reflect cultural norms for that age group. In contrast, for attendance among children, both South Asian and black African or Caribbean groups have significantly lower rates than the white population. This may reflect differences in family and community support.
A qualitative study by Hunter et al investigating reasons for unscheduled care among patients with LTCs reports that this group of patients found EDs to be reliable, accessible, and with the expertise required for urgent exacerbations of their conditions, and that previous experience reinforced their choice to re-attend an ED.29
Implications for practice
This analysis provides strong evidence that increasing numbers of physical and mental morbidities drive the attendance rate at EDs. This effect is exacerbated by socioeconomic deprivation. In contrast to the popular perception that people use EDs instead of seeing their GP, the authors find that increased use of the ED is associated with higher numbers of GP consultations. This suggests that the GP-registered population is using a combination of both their GP services and ED units as a response to perceived need.
These findings are an important contribution to the continuing debate on whether patient care will benefit from reducing ED units and replacing them with community-based support.31,32 Understanding the factors associated with ED attendance and achieving clarity on which types of attendance are safely and effectively remediable by general practice and community services interventions is the first step. Further investment in such community-based health and social care services will need to be closely aligned to the perceived needs of patients if they are to be successful in reducing the burden of ED use.
Acknowledgments
The authors wish to thank Zaheer Ahmed and staff at CEG for supporting data extraction, as well as all GP practices in East London that have given consent for data sharing to improve care for patients.
Appendix 1. Flow chart.

Appendix 2. Overall rates of ED attendance per 1000 registered population by IMD quintile 2015: internal versus national
| IMD 2015 quintiles | Registered population | Count of ED attendances in 2 years | Annual ED attendance rate per 1000 registered population |
|---|---|---|---|
| Internal | |||
| 1 least deprived | 148 663 | 71 354 | 240.0 |
| 2 | 167 613 | 95 921 | 286.1 |
| 3 | 168 618 | 103 113 | 305.8 |
| 4 | 167 914 | 113 299 | 337.4 |
| 5 most deprived | 166 228 | 121 713 | 366.1 |
| National | |||
| 1 least deprived | 6109 | 1957 | 160.2 |
| 2 | 14 700 | 5579 | 189.8 |
| 3 | 46 632 | 21 389 | 229.3 |
| 4 | 336 160 | 188 770 | 280.8 |
| 5 most deprived | 415 435 | 287 705 | 346.3 |
ED = emergency department. IMD = Index of Multiple Deprivation.
Appendix 3. Effect of IMD population quintile on crude attendance rates per 1000 population, grouped by quintile. IMD = Index of Multiple Deprivation.

Appendix 4. Map describing the annual rate of emergency department attendance per 1000 registered population grouped by middle super output layer (MSOA).

Notes
Funding
None given.
Ethical approval
Not applicable.
Provenance
Freely submitted; externally peer reviewed.
Competing interests
The authors have declared no competing interests.
Discuss this article
Contribute and read comments about this article: bjgp.org/letters
- Received June 26, 2017.
- Revision requested August 1, 2017.
- Accepted August 11, 2017.
- © British Journal of General Practice 2018
REFERENCES
In this issue


Jump to section
- Top
- Article
- Abstract
- INTRODUCTION
- METHOD
- RESULTS
- DISCUSSION
- Acknowledgments
- Appendix 1. Flow chart.
- Appendix 2. Overall rates of ED attendance per 1000 registered population by IMD quintile 2015: internal versus national
- Appendix 3. Effect of IMD population quintile on crude attendance rates per 1000 population, grouped by quintile. IMD = Index of Multiple Deprivation.
- Appendix 4. Map describing the annual rate of emergency department attendance per 1000 registered population grouped by middle super output layer (MSOA).
- Notes
- REFERENCES
- Figures & Data
- Info
- eLetters
Keywords
More in this TOC Section
Related Articles
Cited By...

