


Abstract
Background Test and treatment thresholds have not yet been described for decision-making regarding the likelihood of pneumonia in patients with acute cough.
Aim To determine decision thresholds in the management of patients with acute cough.
Design and setting Set among primary care physicians attending meetings in the US and Switzerland, using data from a prospective cohort of primary care patients.
Method Clinical vignettes were used to study the clinical decisions of physicians regarding eight patients with cough that varied by six signs and symptoms. The probability of community-acquired pneumonia (CAP) was determined for each vignette based on a multivariate model. A previously published approach based on logistic regression was used to determine test and treatment thresholds.
Results In total, 256 physicians made 764 clinical decisions. Initial physician estimates systematically overestimated the likelihood of CAP; 75% estimating a higher probability than that predicted by the multivariate model. Given the probability of CAP from a multivariate model, 16.7% (125 of 749) changed their decision from ‘treat’ to ‘test’ or ‘test’ to ‘rule out’, whereas only 3.5% (26/749) changed their decision from ‘rule out’ to ‘test’ or ‘test’ to ‘treat’. Test and treatment thresholds were 9.5% (95% confidence interval (CI) = 8.7 to 10.5) and 43.1% (95% CI = 40.1 to 46.4) and were updated to 12.7% (95% CI = 11.7 to 13.8) and 51.3% (95% CI = 48.3 to 54.9) once the true probability of CAP was given. Test thresholds were consistent between subgroups. Treatment thresholds were higher if radiography was available, for Swiss physicians, and for non-primary care physicians.
Conclusion Test and treatment thresholds for CAP in patients with acute cough were 9.5% and 43.1%, respectively. Physicians tended to overestimate the likelihood of CAP, and providing information from a clinical decision rule (CDR) changed about 1 in 6 clinical decisions.
- antibiotics
- chest
- chest radiograph
- cough
- decision-making
- decision thresholds
- pneumonia, community-acquired
- radiography
INTRODUCTION
Cough is a common presenting complaint in primary care and emergency department practice.1,2 Signs and symptoms associated with community-acquired pneumonia (CAP) in patients with cough include: fever, shortness of breath, tachycardia, absence of rhinorrhoea, sputum production, and an abnormal lung exam.3–5 A European study of a large series of primary care patients with cough, all of whom received a chest radiograph, found that approximately 4% had CAP.3 In routine clinical practice, however, it would be impractical and costly to obtain a chest radiograph (CXR) in all outpatients with a cough.
The threshold model of clinical decision-making proposes two thresholds for clinical decision-making (Figure 1). Below the test threshold, disease is judged unlikely and neither testing nor treatment are warranted. Above the treatment threshold, the disease is judged likely enough to initiate treatment. More information is needed to judge between the thresholds.6 This information can take the form of additional history or physical examination, diagnostic tests, or observation of the patient over time.

The threshold model of decision-making, showing test and treatment thresholds and suggested action for patients with a probability of disease below the test threshold, between thresholds, and above the treatment threshold.
Previously, the authors of the present study reported a novel approach to determining the probability of disease represented by each threshold.7 This approach presented physicians with a series of clinical vignettes, each with a different plausible, but randomly assigned, probability of the disease in question. Physicians were asked to choose between ruling the disease out, ordering additional tests, and initiating therapy. The probability at which half of the physicians chose to rule out and half to test or treat was the ‘test threshold’, and the probability at which half of the physicians chose to treat and half chose to rule out or test was the ‘treatment threshold’. Both were estimated using a model-based approach. The current study builds on that approach by using more detailed, realistic vignettes and examining the effect of providing the actual probability of disease on physician decisions regarding testing and treatment for pneumonia in patients with acute cough. These effects have not been previously described.
METHOD
Creation of clinical vignettes
Data from a prospective series of 2820 primary care patients with acute cough in 12 European countries were used, all of whom had a chest radiograph as the reference standard test for CAP.3 This study described the following multivariate model using six signs and symptoms, with the dependent variable as diagnosis of CAP (P = probability):
 (Equation 1)
How this fits in
Although test and treatment thresholds are important factors in clinical decision-making, they have not been determined for common conditions. This study used realistic vignettes with systematically varied probabilities of pneumonia among primary care patients with acute cough to calculate a test threshold of 9.5% and a treatment threshold of 43.1%. Providing an accurate estimate of the probability of pneumonia for each vignette altered about 1 in 6 testing or treatment decisions, demonstrating the value of clinical decision support.
Eight separate clinical vignettes were created, corresponding to probabilities of CAP ranging from 1.8% to 62%. Examples of vignettes are shown in Appendix 1.
Participants
US primary care physicians attending continuing education conferences were approached for inclusion. These conferences were sponsored by the Arizona Academy of Family Physicians (Phoenix, AZ), the Cleveland Clinic (Cleveland, OH), the Illinois Academy of Family Physicians (Chicago, IL), and the North Dakota Academy of Family Physicians (Big Sky, MT). At each of these meetings almost all physicians practised in Arizona, Ohio, Illinois, and North Dakota.
Swiss physicians were approached at a symposium during the annual meeting of the Swiss Society of General Internal Medicine. Physicians in training at the Department of Ambulatory Care and Community Medicine in Lausanne were also included.
Study design
Each physician was asked their number of years in practice; whether radiography was available on site, <5 miles away or >5 miles away; and their primary practice site (primary care, urgent care, or emergency department). In the first stage, each physician was presented with three vignettes with different combinations of signs and symptoms. The physician was then asked to estimate the probability of CAP for this patient (0–100%), and then asked to choose one of the following three clinical decisions:
You feel that CAP is adequately ruled out, no CXR is needed.
You order a chest radiograph to evaluate for possible CAP.
You feel that CAP is likely enough to prescribe an antibiotic without a chest radiograph.
In the threshold model, these decisions correspond to being below the test threshold, being between the test and treatment thresholds, and being above the treatment threshold respectively. In the second stage, the physician was given an estimate of the actual likelihood of CAP based on the multivariate model shown above (thereafter referred to as ‘model-based probability’). They were then asked to again choose one of the above three clinical decisions.
Data preparation
When a physician provided a range for the probability, for example, 10–20%, the midpoint of that range was used. Some physicians expressed probabilities as >90% or <20%; in that event the midpoint between 0% or 100% and the specified probability were chosen. Two physicians chose more than one option; their data were excluded.
Analysis
Physician characteristics were summarised descriptively. The self-estimated and model-based probability of CAP3 were compared using a calibration plot. Physicians’ decisions before and after provision of the model-based probability were compared using a reclassification table.
Test and treatment thresholds were determined using the method described by Ebell and colleagues.7 This method is based on a logistic regression analysis of the physician decision with respect to either the model-based or self-estimated disease probability:
 (Equation 2)where P is the probability of not ruling out when the test threshold is being determined and the probability of treating when the treatment threshold is being determined. The value for x is either the model-based probability as obtained with equation 1 or alternatively the disease probability estimated by physicians; a and b are regression coefficients. The test (or treatment) threshold is defined as the disease probability x̄ such that the corresponding probability of not ruling out (or treating) is equal to 0.5. Thus, at this probability, half of respondents would rule out and half would test or treat at the test threshold, whereas half would rule out or test and half would treat at the treatment threshold. When x is the model-based disease probability, the resulting threshold x is called a ‘threshold of model-based probability’. If x is the disease probability estimated by physicians, the resulting threshold x̄ is a ‘threshold of estimated probability’, that is, the physicians’ estimated disease probability corresponding to a probability to test/treat of 0.5.
Solving Equation 2 with respect to x and replacing P by 0.5, one obtains thresholds: x̄ = −â/b̂, â and b̂ being the estimated coefficients of model 2. Considering that in the current study each physician evaluated several vignettes, a random intercept term into equation 2 was also added in order to account for inter-physician variability (mixed-effect logistic regression). Confidence intervals around thresholds were obtained within the model using the covariance matrix of the estimated coefficients.7
This method was applied three times: first, to the physician’s decisions taken before the model-based probability of disease is provided, and with x = the model-based disease probability, giving rise to ‘prior threshold based on model-based probability’; second, to the physician’s decisions taken before the model-based (true) probability of disease is provided, and with x = the estimated disease probability, giving rise to ‘prior thresholds based on estimated probability’; and the third time to updated physician’s decisions after the model-based probability is provided, and with x = true disease probability, giving rise to ‘posterior thresholds based on model-based probability’.
Model 2 was adjusted in turn for practice type (primary care versus non-primary care), radiography proximity (on site versus not on site), years in practice (≤10 versus >10) and physician country (US versus Switzerland), allowing a statistical comparison between test and treatment thresholds for subgroups of population defined by each of these dichotomous variables.
All statistical analysis was performed in the R Core Team software package. Mixed-effect logistic regression was estimated using the function glmer() of the package lme4.
RESULTS
A total of 256 physicians participated in the study, providing their clinical decisions for a total of 764 vignettes. Four physicians did not provide usable data regarding the initial estimate of probability and clinical decision, and 15 did not provide usable data regarding the clinical decision after being provided the true probability. Their characteristics are summarised in Table 1. Most physicians were in a primary care setting, most had chest radiography available on site, and they were fairly evenly split between those practising ≤10 years versus >10 years.
Characteristics of participating physicians
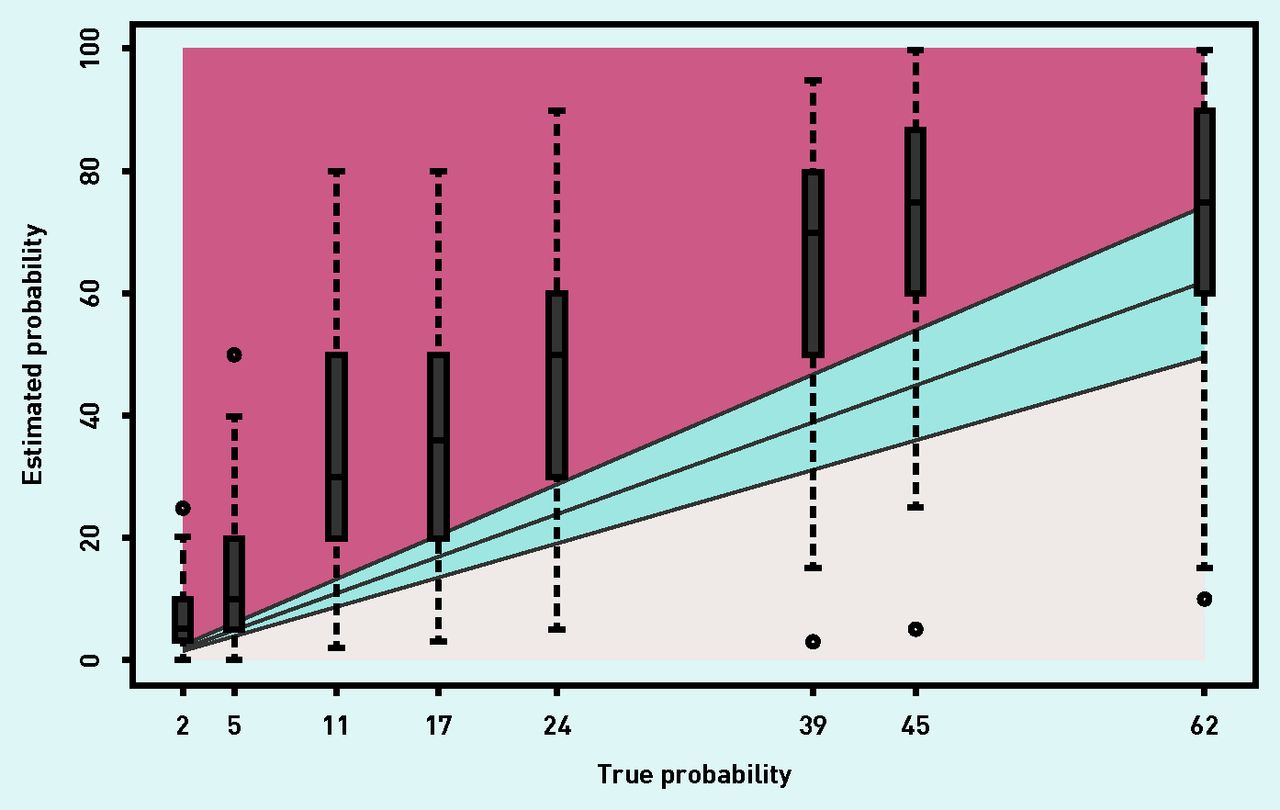
The calibration between the estimated and model-based (true) probabilities of CAP is shown in Figure 2. The two probabilities are strongly correlated, but with a systematic overestimation by physicians of the probability that a patient has CAP. Only 16% of physicians made an estimate of probability in the interval ‘model-based probability +/− 0.2 × model-based probability’ (blue/shaded area of Figure 2). Of the remainder, 9% estimated the probability below the minimum of this range (underestimation), whereas 75% estimated the probability above the maximum of this range (overestimation).

Estimated probability of community-acquired pneumonia versus true probability based on a multivariate model for each clinical scenario. Boxes represent the median, interquartile range, and overall range of estimates for each of the eight distinct clinical vignettes; the thickest black line represents perfect agreement, and the blue/shaded region represents +/–20% of the true probability.
Table 2 summarises data regarding reclassification following the provision of the model-based (true) probability of CAP based on the multivariate model from the GRACE study.3 Among the 749 vignettes for which a second decision was also taken, 598/749 (79.8%) presented the same decision before and after provision of the model-based probability, despite the large amount of overestimation described above in Figure 2. When the decision changed, it most often changed from treat to test (70/749, 9.3%), test to rule out (46/749, 6.1%), or treat to rule out (9/749, 1.2%). In total, 125 of 749 (16.7%) of physicians moved their decision downwards. Only 26/749 decisions (3.5%) moved in the other direction from rule out to test or treat, or from test to treat.
Reclassification table showing the relationship between decision made before and after being provided true probability of CAP based on multivariate model, N = 749 (second decisions taken)
The prior test and treatment thresholds based on the model-based probability for the entire population were estimated at 9.5% (95% confidence interval (CI) = 8.7 to 10.5%) and 43.1% (95% CI = 40.1 to 46.4%). Prior test and treatment thresholds using the physician-estimated probability were estimated at 19.1% (95% CI = 17.1 to 20.8%) and 66.3% (95% CI = 62.6 to 70.6%). Posterior thresholds (after providing the model-based probability of CAP) and based on the model-based probability were estimated at 12.7% (95% CI = 11.7 to 13.8%) and 51.3% (95% CI = 48.3 to 54.9%). In Figure 3, thresholds are derived from the respective probabilities of not ruling out (test thresholds) and treating (treatment thresholds) estimated according to model 2.
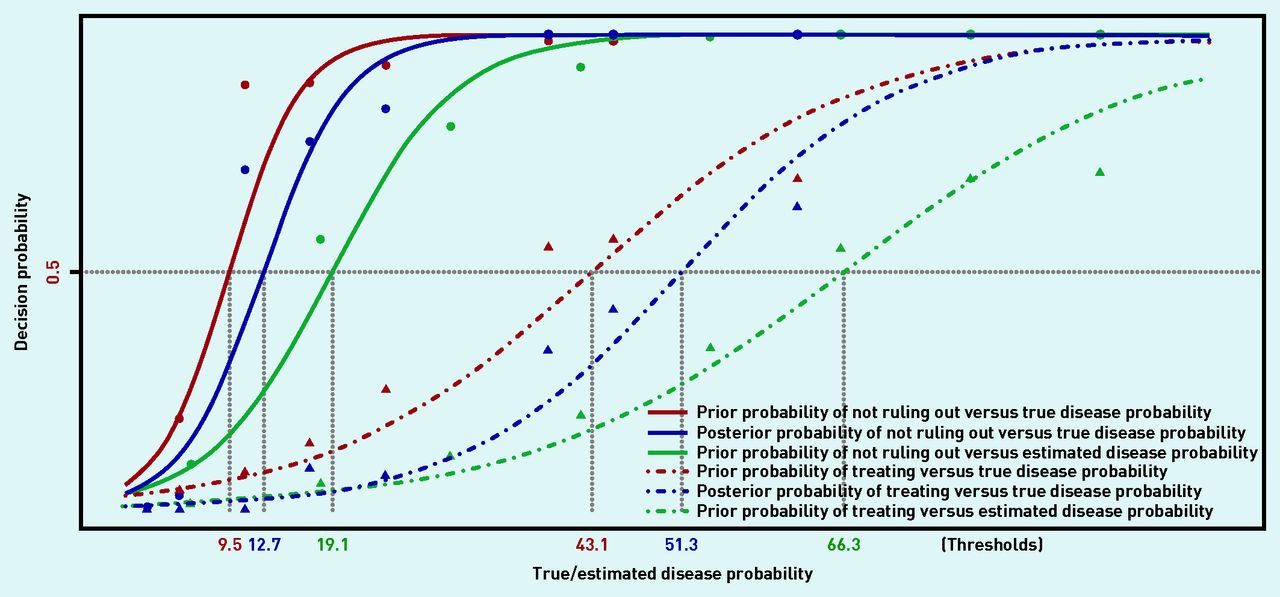
Prior and posterior test (solid lines) and treatment (dashed lines) thresholds based on true probability and prior test (solid lines) and treatment (dashed lines) thresholds based on estimated probability, obtained equalling to 0.5 the prior/posterior probabilities of not ruling out (test thresholds) and treating (treatment thresholds) estimated according to model 2. Points (circles and triangles) represent empirical frequencies of decisions according to the true/estimated disease probability.
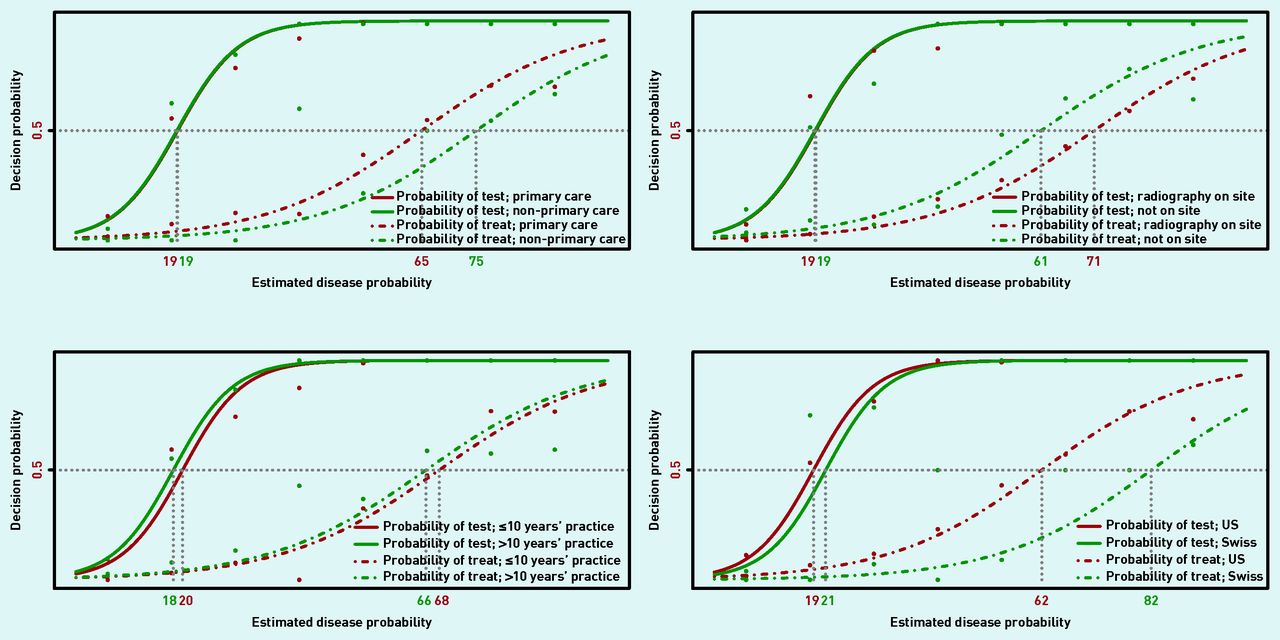
The prior test and treatment thresholds based on model-based disease probabilities were adjusted for country, availability of chest radiography on site, practice type, and years in practice. Results are shown in Table 3 and Figure 4. These factors had little impact on the test threshold, which was 8.8–10.1% for all subgroups. On the other hand, the treatment threshold varied significantly by subgroup, and was higher if radiography was available on site (46.4% versus 39.8%, P = 0.03), for Swiss physicians compared with US (53.9% versus 40.1%, P<0.001), and for non-primary care physicians compared with primary care (53.7% versus 41.2%, P = 0.002). Test and treatment thresholds of estimated disease probabilities are presented in Figure 5 according to subgroups, showing a similar covariates pattern. Covariates effects were also similar when posterior thresholds were considered (results not shown).
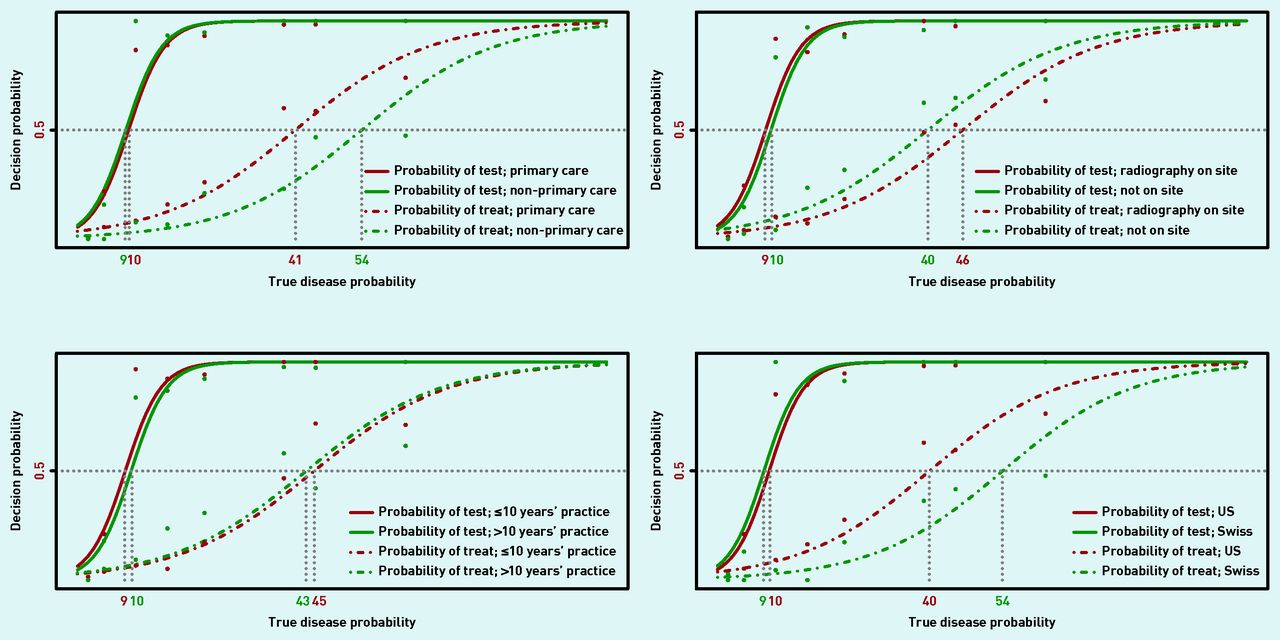
Prior test and treatment thresholds of true probability are shown for the following subgroups: primary care versus non-primary site of care; radiography available on site or not; ≤10 years in practice versus >10 years; and Swiss versus US physicians.

Prior test and treatment thresholds of estimated disease probability are shown for the following subgroups: primary care versus non-primary site of care; radiography available on site or not; ≤10 years in practice versus >10 years; and Swiss versus US physicians.
Test and treatment thresholds by univariate subgroups in comparison with true disease probability
DISCUSSION
Summary
The present study found that primary care physicians in both the US and Switzerland systematically overestimate the probability of CAP when given a clinical scenario. In addition, providing the probability of CAP for that clinical scenario based on a multivariate model generally did not change the clinical decision. When the decision did change, it was generally from treating to testing, and, to a lesser extent, from testing to ruling out CAP and no further testing.
Test and treatment thresholds expressed in terms of physician-estimated probability were higher than corresponding thresholds expressed in terms of model-based probability. This was due to the systematic and large overestimation of CAP probability. Providing the true probability of CAP had little effect on the test threshold, but resulted in higher treatment thresholds and correspondingly greater use of chest X-rays. This was because the majority of decision changes were from treating to testing, meaning that a higher disease probability (threshold) is needed in order to start treating.
The treatment threshold was significantly higher for Swiss physicians than for US physicians. This could reflect a greater value placed on avoiding unnecessary antibiotics by Swiss physicians. The treatment threshold was also higher if radiography was available on site, and for physicians not in the primary care setting. These factors may be related to greater ease of obtaining diagnostic testing, resulting in a higher treatment threshold.
It is interesting that the authors of the GRACE study identified very different thresholds to define low-, moderate-, and high-risk groups than found in the present study. They defined a low-risk group for CAP as <2.5%, and a high-risk group as >20%, significantly different from that found in the present study (but also not explicitly tied to management recommendations). Because the model was calibrated to these lower thresholds, the fit may well be suboptimal for probabilities of 40% and above corresponding to the current study’s estimated treatment threshold.
Physicians only partially change their decision after being given the true probability. Test and treatment thresholds are very useful to conceptualise clinical decision-making, but physician reasoning is somewhat more complex than a binary probabilistic approach, and may include other options such as a short-term return visit to re-evaluate the patient. This may be explained by a number of factors: anchoring to the original estimate, personal experiences in different populations, or the possibility that the GRACE model systematically underestimates the probability of CAP.
Comparison with the existing literature
The authors believe that this is the first study to systematically attempt to determine decision thresholds for patients with acute cough. The authors’ previous study examined decision thresholds for patients with influenza-like illnesses, and found a test threshold of 5% and treatment threshold of 55% for rapid antigen testing for influenza and prescription of oseltamivir, respectively.7
Strengths and limitations
The present study had several strengths and limitations. Strengths include realistic scenarios, a ‘real world’ group of physicians largely in private practice, and a binational group of participants. A limitation is that any study using vignettes rather than directly observing actual physician behaviour is subject to social desirability bias. If physicians believed that avoiding unnecessary antibiotics was important, it could result in a bias toward a higher treatment threshold. Also, it is possible that the true probability determined by the European GRACE model systematically underestimates the probability of CAP in the US population.
However, both US and Swiss physicians systematically overestimated the probability of CAP. To some extent, providing only three options (treat, test, or neither) may not fully capture all management options, such as initiating treatment while ordering a confirmatory chest X-ray. Finally, some physicians may have difficulty assigning a specific number to the probability of CAP, preferring instead more qualitative descriptions. However, these qualitative descriptions would not allow us to determine thresholds.
Implications for research and practice
Future research using this approach should explore the decision thresholds of patients, which may differ from those of clinicians and are important to consider when shared decision-making is the goal. Thresholds can also be based on cost–utility models,6 and it would be interesting to compare thresholds derived in this way that optimise efficiency with the empirically derived thresholds from this current study.
The general approach of identifying low-, moderate-, and high-risk groups corresponding to decision thresholds is not new, and applies broadly to a range of diagnostic evaluations including chest pain, venous thromboembolism, and sore throat.8,9 Results from the present study could also inform the development of future clinical decision rules (CDRs) for the management of CAP, with developers ensuring that the low-, moderate-, and high-risk groups of a CDR correspond to CAP probabilities <10%, 10–40%, and >40% that are consistent with the thresholds that have been identified in this study and the threshold model of decision-making. This would not only potentially increase acceptability of such CDRs, but also their efficiency in terms of guiding test selection and treatment.
Appendix 1. Sample of clinical vignettesa
| Scenario 1: A patient presents with a 3-day history of cough productive of yellowish green sputum and a runny nose. He is afebrile, his heart rate is 72 bpm, and his lung sounds are normal. The probability of community-acquired pneumonia (CAP) is: _____%. Based on this probability, you choose the following management option:
Scenario 2: A patient presents with a 3-day history of cough productive of yellowish green sputum and a runny nose. He is not short of breath, his measured temperature is 100.6°F, his heart rate is 80 bpm, and his lung exam reveals crackles. The probability of community-acquired pneumonia (CAP) is: _____%. Based on this probability, you choose the following management option:
The probability of community-acquired pneumonia (CAP) is:_____%. Based on this probability, you choose the following management option:
| Based on a validated clinical decision rule that uses signs, symptoms, and CRP, the patient’s likelihood of CAP is actually 2%. Based on that revised probability, what is your decision:
Based on a validated clinical decision rule that uses signs, symptoms, and CRP, the patient’s likelihood of CAP is actually 5%. Based on that revised probability, what is your decision:
|
↵a Further vignettes corresponding to probabilities of CAP ranging from 1.8% to 62% are available from the authors on request. CXR = chest radiograph.
Notes
Funding
No funding has been received for this study.
Ethical approval
This study was approved by the Human Subjects Committee of the University of Georgia [Ref: 2013-10249-0], and all participating physicians provided informed consent.
Provenance
Freely submitted; externally peer reviewed.
Competing interests
The authors have declared no competing interests
Discuss this article
Contribute and read comments about this article: bjgp.org/letters
- Received July 4, 2018.
- Revision requested August 1, 2018.
- Accepted August 9, 2018.
- © British Journal of General Practice 2018
In this issue


Jump to section
Keywords
More in this TOC Section
Related Articles
Cited By...

