


Abstract
Background Despite patient preference and many known benefits, continuity of care is in decline in general practice. The most common method of measuring continuity is the Usual Provider of Care (UPC) index. This requires a number of appointments per patient and a relatively long timeframe for accuracy, reducing its applicability for day-to-day performance management.
Aim To describe the St Leonard’s Index of Continuity of Care (SLICC) for measuring GP continuity regularly, and demonstrate how it has been used in service in general practice.
Design and setting Analysis of appointment audit data from 2016–2017 in a general practice with 8823–9409 patients and seven part-time partners, in Exeter, UK.
Method The percentage of face-to-face appointments for patients on each doctor’s list, with the patient’s personal doctor (the SLICC), was calculated monthly. The SLICC for different demographic groupings of patients (for example, sex and frequency of attendance) was compared. The UPC index over the 2 years was also calculated, allowing comparisons between indices.
Results In the 2-year study period, there were 35 622 GP face-to-face appointments; 1.96 per patient per year. Overall, 51.7% (95% confidence interval = 51.2 to 52.2) of GP appointments were with the patients’ personal doctor. Patients aged ≥65 years had a higher level of continuity with 64.9% of appointments being with their personal doctor. The mean whole-practice UPC score was 0.61 (standard deviation 0.23), with ‘usual provider’ being the personal GP for 52.8% and a trainee or locum for 8.1% of patients.
Conclusion This method could provide working GPs with a simple way to track continuity of care and inform practice management and decision making.
INTRODUCTION
Continuity of care is defined as a patient and doctor seeing each other repeatedly and is a proxy for the doctor–patient relationship.1 As the number of consultations a doctor and patient have with each other increases, so does the responsibility that the doctor feels for the patient2 and the trust the patient feels for the doctor.3 Continuity of care in general practice has been shown in numerous studies to be associated with many positive outcomes for patients, doctors,4,5 and health systems.6 These include increased satisfaction in patients,7,8 better adherence by patients to medical advice,9,10 better uptake of personal preventive medicine,11,12 and lower use of hospital outpatients and inpatients.13,14 In 2018, a systematic review found that better continuity of doctor care is associated with lower mortality.15 In a general practice using the personal list system,16 a patient is more likely to have continuity of care with their own doctor17,18 and be more satisfied.19 Conversely, there have been reports of large, combined list practices where continuity is poorer,14 having delayed diagnosis of cancer20 and poor care for patients with mental health problems.21
Despite the known benefits, continuity of care, as perceived by patients, is in decline in English general practice.22 There are many potential reasons behind this, including government policies that prioritise access, increasing numbers of GPs retiring early or working part time,23 and a lack of teaching on general practice subjects such as continuity of care in medical schools.24 Some doctors also believe continuity is only possible in single-GP practices or with full-time GPs, and that continuity is more difficult or expensive. One additional reason for low levels of continuity is that working GPs find it difficult to quantify and, as Drucker described, measurement is necessary for management.25 If practices were able to measure and compare continuity rates for individual doctors, continuity might improve, as has been shown for other performance measures.26,27
There are a number of measures of continuity of care that have been used in general practice research.28,29 These include the Usual Provider of Care (UPC) index,30 which calculates the proportion of appointments that are with the most frequent provider; patient surveys including the GP Patient Survey;31 and several other measures that use appointment data, often from insurance records in the US and other countries to quantify continuity.32,33 The UPC is the most simple and frequently used of these measures. The Royal College of General Practitioners provides a toolkit for measuring continuity within practices by calculating the UPC of a random sample of patients.34 These methods have the drawback of needing enough time for at least a minimum number of appointments (usually two) before they can be applied. They are, therefore, not practical methods of evaluating performance as part of regular audits to encourage and measure improvement in continuity of care.
Therefore a practical method was developed for measuring continuity of care monthly in a general practice that uses personal lists. This method is called the St Leonard’s Index of Continuity of Care (SLICC). This was first used with paper records at the practice in 197416 and has since been used and refined. This study describes this method used in day-to-day general practice.
How this fits in
Continuity of care in general practice benefits patients because it is associated with greater satisfaction, increased adherence to medical advice, better care for chronic illnesses, more evidence-based preventive care, less accident and emergency use, fewer hospital admissions, and lower mortality. Despite the evidence that continuity of care benefits GPs too, most general practices do not measure continuity regularly. A method has been developed for monthly measurement of continuity of care in a personal list in general practice, the St Leonard’s Index of Continuity of Care (SLICC). This study demonstrates that a reasonable level of continuity can be achieved in a general practice where all GPs are part time.
METHOD
This study makes use of regular appointment audit data from St Leonard’s Practice in Exeter, UK. St Leonard’s had, at the time of the study, seven GP partners and one salaried doctor, all part time. The practice is located near to the city centre in Exeter, England. The practice population had a mean 2010 Index of Multiple Deprivation (IMD) score of 17.1 compared with 21.67 for England (high being more deprived).35 The practice is a training practice and usually has one to two registrars working full or part time. There is also one sessional doctor without a list. The practice uses the personal list system16 so that each patient has a named doctor who is one of the GP partners or a salaried doctor. This doctor takes responsibility for their list, and the practice actively encourages patients to book appointments with their own doctor where possible.
Data were collected from the practice database (SystmOne) as part of regular internal audits into appointment numbers, and length and proportion of appointments with personal doctor. Shortly after the end of each month, all appointments for that month were extracted from the database. Data extracted included arrival time, date, appointment duration, flags (includes an indicator of telephone consultation), clinician, patient age, and their registered doctor at the practice (‘usual carer’). Appointments, including home visits, were only counted if indicators showed they were not telephone appointments, if they were booked into appointment slots and lasted >1 minute. Appointments recorded as >1 hour are reset to 15 minutes as these are rarely real durations. A unique SystmOne ID was used to track individual patients (not NHS number). The ID number, age, and sex of all patients on each of the doctors’ personal lists were also extracted each month. Deprivation was also checked using the IMD36 from patients’ postcodes. Data from 1 January 2016 to 31 December 2017 were used.
The practice population was compared with that of the UK’s.37 For GP face-to-face appointments, the demographic breakdown of patients receiving these appointments was investigated. The annual consultation rate was calculated by dividing the number of appointments by the average population over the 2 years and then dividing by 2 (years).
Using Microsoft Excel, for each GP partner’s personal list, the proportion of face-to-face appointments with the patients’ personal doctor was calculated for each month; the SLICC (Box 1). This was also calculated over the 2 years and separately for patients aged ≥65 years. Patients were also grouped into 5-year age bands, by sex, and by IMD quintiles. The proportion of a doctor’s appointments that were with their own patients (own-patient ratio) was also investigated.
|
↵a The patient group would usually be a GP’s personal list/list of registered patients as this allows comparison between doctors within a practice. The specified time period could be as short as a month, to allow regular repeated measurements that build up a picture of delivery of continuity of care in the longer term. SLICC = St Leonard’s Index of Continuity of Care.
How to calculate the SLICC
For each patient at the practice with two or more appointments, the UPC30 was calculated over the same 2 years. This was calculated by dividing the number of a patient’s appointments with the doctor seen most frequently during the study period, by the patient’s total number of appointments during the study period. Patients were categorised by the type of GP most seen (personal doctor, other practice doctor, locum, or registrar).
RESULTS
Practice population
The practice had 8823 registered patients of all ages in January 2016, and 9409 in December 2017, with a total of 10 914 patients registered for at least 1 day of the study period. The age and sex distribution in the mid-point of the study, when there were 9189 patients (31 December 2016) is shown in Figure 1. Comparing Figure 1 with the population of the UK as a whole,37 the practice population had a higher proportion of adults aged 25–44 years (31.8% versus 26.2% nationally) and slightly fewer patients aged ≥65 years (15.1% versus 18.0%). The median registration in December 2016 was 6.6 years (interquartile range [IQR] 1.6–17.7 years) and, in the 2 years of the study, 1610 patients left (including deaths) and 2429 joined (including births).
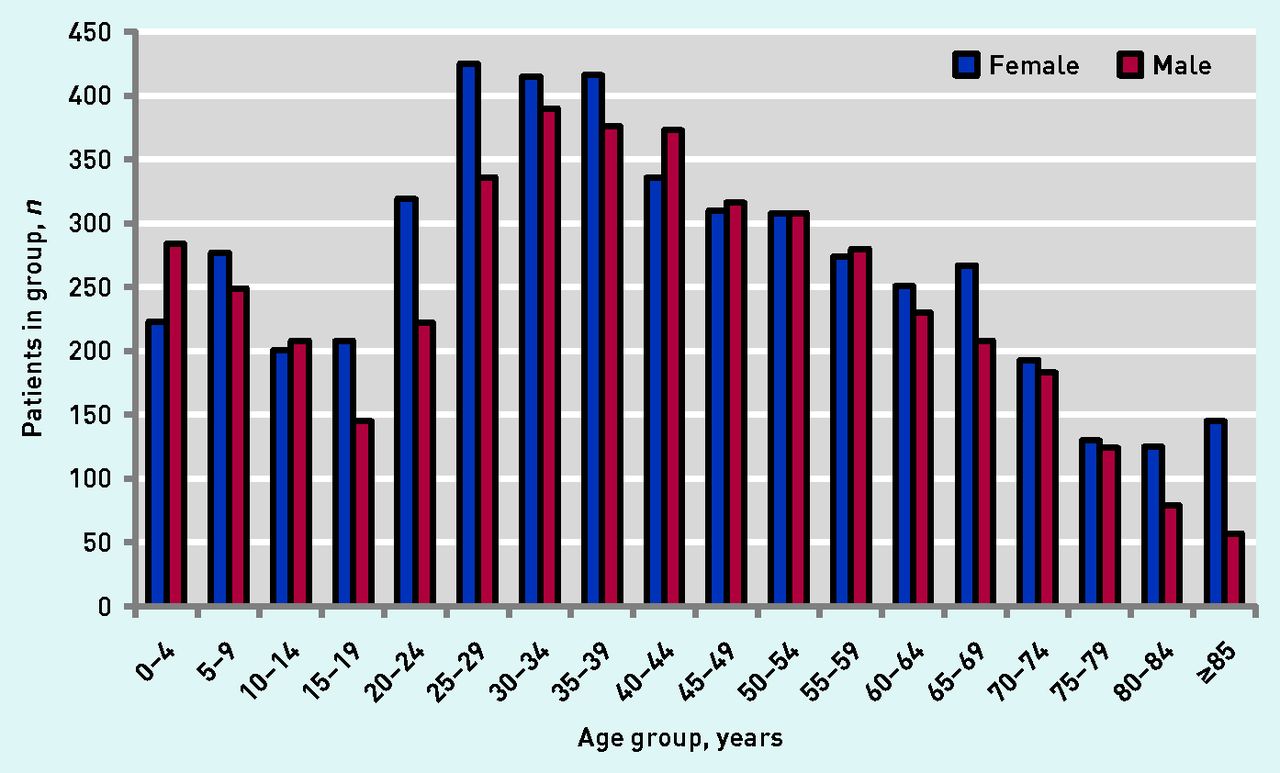
Age and sex distribution of patients registered at St Leonard’s Practice during December 2016.
Appointments
In the 2-year study period, there were 35 622 GP face-to-face appointments. The overall appointment rate was 1.96 appointments per patient per year. Patients with no face-to-face appointments numbered 2941 (26.9%), with 1844 (16.9%) having one appointment, 4833 (44.3%) having two to seven appointments, and 1296 (11.9%) having eight or more. Older patients as a group had more appointments, with 26.9% of appointments being for those ≥65 years, despite them comprising only 15.3% of the practice population (Table 1), giving an annual appointment rate for patients aged ≥65 years of 3.17 per patient.
Summary of patient numbers, appointments, the SLICC, and UPC for different groups of patients
A total of 28 323 appointments (79.5%) were with practice doctors, 6084 (17.1%) with registrars, and 1398 (3.9%) with locums. The mean recorded appointment length was 16.6 minutes (standard deviation [SD] 8.6); when locums and registrars are excluded this is 15.9 minutes (SD 8.3).
GP personal list continuity
Overall using the SLICC it was found that 51.7% (95% confidence interval [CI] = 51.2 to 52.2%) of appointments at the practice were with the patients’ personal doctor. The proportion of patients on each list seeing their own doctor each month is shown in Figure 2. There was a large variation between months and between doctors, from <30% in months where a doctor was on leave, to >70% for one list. The list with the highest SLICC score was the list with a higher proportion of older people (24.4% aged ≥65 years) and also that of the longest-serving GP.
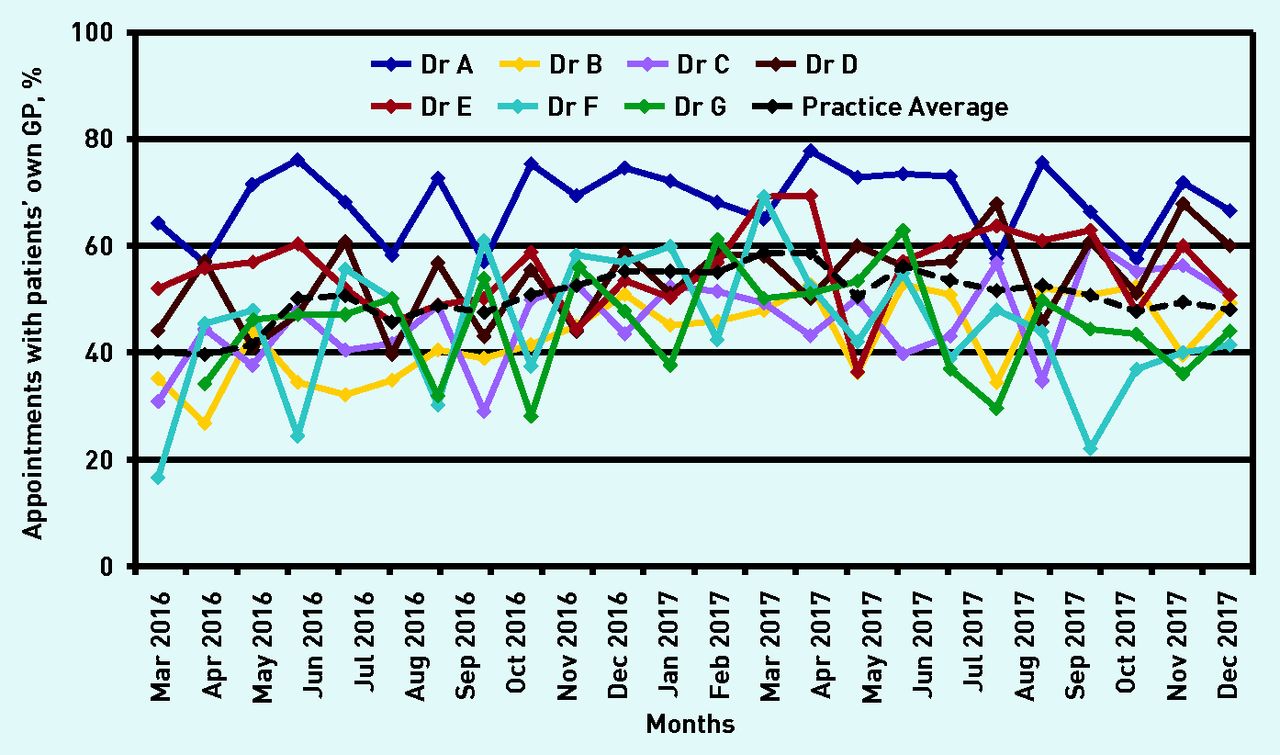
Patient consultations with own GP. The St Leonard’s Index of Continuity of Care (SLICC), which is the percentage of appointments provided for patients on a GP partner’s list that were with that GP, each month. The practice average is the percentage of all appointments in that month that were with the patient’s own GP.
For those patients aged ≥65 years, the SLICC-calculated proportion of patient appointments with a patient’s personal doctor was 65.0% (95% CI = 64.0 to 65.9%). The proportion of appointments that were with the personal GP for each 5-year age band is shown in Figure 3. Older age groups have a higher SLICC, peaking in the 70–74 years age group. More deprived patients, males, and patients with over seven appointments had a higher SLICC (Table 1). Figure 4 shows the proportion of all of each doctor’s appointments that were with their own patients (own-patient ratio). Overall, this proportion was 69.4% of all appointments with doctors who have personal lists. This was higher than the SLICC, as appointments with registrars, the sessional doctor, and locums are not included.
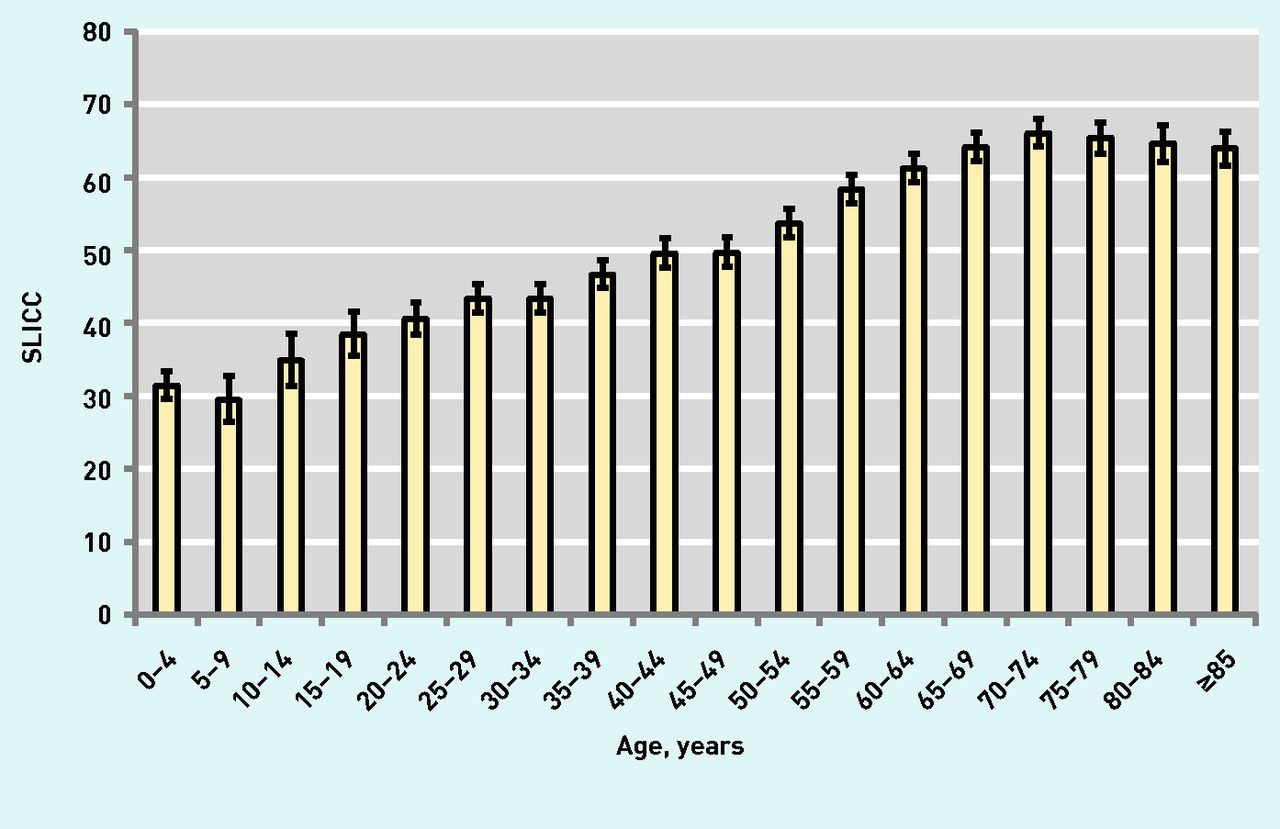
The SLICC (percentage of appointments that are with the personal GP) by age group. Error bars represent 95% CIs. SLICC = St Leonard’s Index of Continuity of Care.

GP appointments with own-list patients. The own-patient ratio is the percentage of appointments with a specific GP partner that were with patients on their own personal list. The practice average uses the number of appointments that were with GPs who have lists as the denominator.
Individual patient continuity using the UPC
For the 6138 patients at the practice with at least two appointments over the study period the mean UPC was 0.61 (SD 0.23).
For 3243 (52.8%) patients, the doctor seen most frequently was also the personal doctor. For 509 (8.3%) this was another practice doctor, 477 (7.8%) a registrar, and 19 (0.3%) a locum. For 1890 (30.8%) patients there were two or more doctors who were seen equally frequently, and for 1190 patients (62.9% of those with more than one usual provider) this included the personal doctor. Therefore 4433 (72.2%) patients had their personal GP as either their sole or shared usual provider. People aged ≥65 years had a significantly (P<0.001) higher UPC (mean 0.69, SD 0.22), than those aged <65 years (mean 0.59, SD 0.23).
DISCUSSION
Summary
Overall, using the SLICC, 51.7% of face-to-face GP appointments were with the personal doctor, despite a large number of appointments with registrars and all GPs being part-time. For those aged ≥65 years, 64.9% of face-to-face GP appointments were with the personal doctor. When using the UPC for comparison, in the majority of patients the most commonly seen GP was their personal doctor.
Strengths and limitations
This study was carried out in a general practice with all GPs at the practice working part time. The method and focus on continuity could therefore be easily replicated elsewhere (further information, including a template Microsoft Excel file to assist with this, is available from the authors).
The data rely on GPs accurately recording appointments. However, as these audits are carried out within the practice, the data are checked at the time of extraction, ensuring that the majority of appointment types are correct and that few are missed out. GPs know that these audits take place and are used for internal workload monitoring, an incentive for accurate recording. The measurement of appointment duration is subject to additional error as it depends on the GP opening a patient record at the start of a consultation, then closing it at the end as in other studies.38
Patients can choose their personal doctor and occasionally move between GP’s lists, which may affect the counting of appointments with the personal doctor in the month of switchover. Patients also choose to have appointments with another GP, particularly female patients with a male personal doctor requesting consultations with a female doctor. This may be why male patients have a statistically significantly higher SLICC.
As the study was carried out in a single practice, the results may be different in other areas with different practice populations. The SLICC has not yet been applied to other practices’ data although this is planned and it has been used both with SystmOne and with VAMP/Vision practice software at St Leonard’s, therefore it should be transferable.
The SLICC measure described here has some major advantages for GPs (Box 2). It is a simple measure and, as it uses the entire registered list, it is applicable to short periods of time and includes patients who only have one appointment, unlike the UPC which is predicated on patients with more appointments. In addition, the UPC has a floor effect as it is not possible to have a value of zero, because the doctor it refers to is the doctor most frequently seen. Indeed, when there are only two appointments, the lowest value possible is 0.5. With the SLICC a value of 0% is possible and occurs for a doctor’s list in months when they are on long-term leave. The UPC can also take a locum or registrar as the usual doctor: 8.1% of the time in this study.
| UPC | SLICC | |
|---|---|---|
| Developed by | Academic unit | Service general practice |
| Intended use | Continuity of care research | Regular continuity measurement in day-to-day general practice |
| Unit of measurement | Patient | Appointment |
| Specificity to personal doctor | Generally used so that the most frequent provider is the ‘usual’ doctor. This may be another doctor, for example, a locum or trainee | Registered personal doctor only. This is a requirement |
| Most-seen GP | UPC can score a doctor as usual provider when they provide a minority of the appointments, just more than other doctors. More than one doctor can be the most-seen provider | Gives a percentage of appointments that are with the personal doctor |
| Range of scores | A score of 0 is impossible. Consistently higher than SLICC | Can be 0–100% |
| Timeframe | At least two and ideally more appointments required. This can take several years in relatively healthy patients | A measure for monthly audits |
| Selection bias | Includes only patients with a minimum number of appointments (usually two) | Includes all appointments |
| Ability to take into account team continuity | No, individual provider | No, individual provider |
| Ability to compare patient groups | Yes, although patients with few appointments are often excluded | Yes, especially between GP lists and including infrequent attenders |
| Ability to obtain scores for individual patients | Yes | No |
| Ease of use | Simple proportion easy to calculate and interpret | Simple proportion/percentage easy to calculate and interpret |
SLICC = St Leonard’s Index of Continuity of Care. UPC = usual provider of care.
Comparison of the UPC index and the SLICC
Comparison with existing literature
Continuity of care is in decline in English general practice.22 To manage and improve continuity of care, GPs need to be able to measure it effectively. The UPC, used in research14,28–30,33 and in the RCGP toolkit,34 measures continuity at a patient level and requires a certain number of consultations, excluding patients who consult less frequently. It also usually requires a longer time period, whereas when using the SLICC it is possible to measure continuity on a monthly basis, as well as to make comparisons between individual doctors (Box 2 shows comparison of methods).
The requirement, in England, for a named doctor, introduced for patients aged ≥75 years in 2014 and for all patients in 2015,39 had little effect on continuity of care or patient outcomes, at least over 9 months.40 However, if, as intended, personal lists16 are used effectively by practices and continuity is actively measured, there may be more of an impact. The SLICC could be applied to the named doctor if there is no personal list.
Continuity has benefits for patients, doctors, and health systems.2–15 Comparing the St Leonard’s appointment rate of 1.96 face-to-face GP appointments per patient per year to the national average consultation rate of 3.1841 equates to 11 057 fewer appointments each year. Although the demographic of the practice population42 and the length of appointments offered could also contribute to this, the focus on continuity of care at the practice may also be having an effect.
Implications for practice
Having 52% of appointments with a personal doctor may seem low at first glance; however, with an average of two face-to-face appointments per patient per year and a median length of registration of 6.6 years, a patient will have around six or seven appointments of over 15 minutes each with their own doctor. This means 1.5 hours in which the doctor and patient can get to know each other.43 This is likely to be even longer for older patients, for whom continuity is particularly important,44 as they have both higher continuity levels and more appointments. This method provides working GPs with a simple way to track GP continuity of care monthly. As continuity of care has multiple benefits, it is hoped that this system will be adopted in many practices.
Acknowledgments
The authors would like to thank the doctors, staff, and patients of St Leonard’s Practice, Exeter, UK.
Notes
Funding
No funding was received for this project.
Ethical approval
None required as the study used previously collected, anonymised audit data.
Provenance
Freely submitted; externally peer reviewed.
Competing interests
The authors have declared no competing interests.
Discuss this article
Contribute and read comments about this article: bjgp.org/letters
- Received October 16, 2018.
- Revision requested November 7, 2018.
- Accepted December 10, 2018.
- © British Journal of General Practice 2019
REFERENCES
In this issue


Jump to section
More in this TOC Section
Related Articles
Cited By...

