


Abstract
Background Blood pressure (BP) measurement is increasingly carried out through home or ambulatory monitoring, yet existing cardiovascular risk scores were developed for use with measurements obtained in clinics.
Aim To describe differences in cardiovascular risk estimates obtained using ambulatory or home BP measurements instead of clinic readings.
Design and setting Secondary analysis of data from adults aged 25–84 years in the UK and the Netherlands without prior history of cardiovascular disease (CVD) in two BP monitoring studies: the Blood Pressure in different Ethnic groups (BP-Eth) study and the Home versus Office blood pressure MEasurements: Reduction of Unnecessary treatment Study (HOMERUS).
Method The primary comparison was Framingham risk calculated using BP measured as in the Framingham study or daytime ambulatory BP measurements. Statistical significance was determined using non-parametric tests.
Results In 442 BP-Eth patients (mean age = 58 years, 50% female [n = 222]) the median absolute difference in 10-year Framingham cardiovascular risk calculated using BP measured as in the Framingham study or daytime ambulatory BP measurements was 1.84% (interquartile range [IQR] 0.65–3.63, P = 0.67). In 165 HOMERUS patients (mean age = 56 years, 46% female) the median absolute difference in 10-year risk for daytime ambulatory BP was 2.76% (IQR 1.19–6.39, P<0.001) and only 8 out of 165 (4.8%) of patients were reclassified.
Conclusion Estimates of cardiovascular risk are similar when calculated using BP measurements obtained as in the risk score derivation study or through ambulatory monitoring. Further research is required to determine if differences in estimated risk would meaningfully influence risk score accuracy.
INTRODUCTION
Current UK and international guidance recommends that high blood pressure (BP) (hypertension) is diagnosed through 24-hour ambulatory blood pressure monitoring (ABPM), or week-long home monitoring.1–5 Furthermore, many patients with hypertension also monitor their BP at home.6 Consequently, BP measurements obtained in several settings may be used to manage hypertension and estimate cardiovascular risk.7,8
Risk assessments are recommended to treat those at highest risk of cardiovascular disease (CVD). The majority of published cardiovascular risk scores, including the Framingham,9 QRISK2 (risk of developing a heart attack or stroke over the next 10 years),10 and systematic coronary risk evaluation (SCORE)11 equations, were developed using BP measurements obtained in a clinic setting and, ideally, should be used with measurements obtained similarly. Despite this reflecting the original derivation of the scores, use of clinic BP measurements may systematically over- or underestimate risk in patients with large discrepancies between clinic and out-of-office BP (white-coat12,13 or masked effects14). This is because home and ambulatory BP measurements are stronger predictors of CVD than clinic readings.15–17
Although masked and white-coat hypertension may only affect a minority of the population,18,19 the extent to which this problem affects risk estimates and subsequent clinical decisions has been little studied. One previous study examined a related problem of end-digit preference in clinic BP readings in the Framingham risk score,20 but was limited to a single risk score and used simulated data. Hence, this current study aimed to describe differences in estimated cardiovascular risk when using ambulatory or home instead of clinic BP measurements and to determine how clinical decisions may be affected by these differences. The authors used data from the Blood Pressure in different Ethnic groups (BP-Eth) study21 and the Home versus Office blood pressure MEasurements: Reduction of Unnecessary treatment Study (HOMERUS).22
METHOD
Study population
The BP-Eth cohort has been described in full previously.21,23 Briefly, this cross-sectional study compared clinic, home, and ambulatory BP in UK patients aged 40–74 years, with or without hypertension, who were white British, white Irish, South Asian, or African–Caribbean. For this analysis, patients with a prior history of cardiovascular disease were excluded. Clinic measurement used the BpTRU sphygmomanometer.24 Measurements on both arms were taken at the first visit and on the higher reading arm at subsequent visits. ABPM (Spacelabs 90217 monitor)25 used half-hourly measurement from 08.00 to 23.00 and hourly measurement overnight. Home BP measurements were obtained twice in the morning and evening over 7 days.
How this fits in
Out-of-office blood pressure (BP) measurement is increasingly common but cardiovascular risk scores were developed using clinic BP measurements. It is unclear how estimates of cardiovascular risk may be affected by the use of out-of-office measurements in risk prediction algorithms. The present study has shown that differences in risk are generally small and few patients are reclassified across treatment thresholds when using different BP measurements. Extra care on the part of clinicians may be warranted in subgroups with large BP differences or those with risk estimates close to risk thresholds.
HOMERUS was a randomised trial in patients with essential hypertension aged >18 years from the Netherlands. Patients with a history of cardiovascular disease or other severe disease were excluded. Patients were randomised into an office or home monitoring group with antihypertensive treatment adjusted accordingly. Three office BP measurements were taken in the non-dominant arm at each visit using an automated oscillometric device (Omron 705, Japan).26 Home BP measurements (three in the morning and evening over 7 days) were made with the same monitor before each study visit. ABPM was carried out at the beginning and end of the study (following treatment washout and at optimal titration respectively) with readings every 15 minutes from 07.00–23.00 and every 30 minutes overnight. For this analysis, patients aged 25–84 years from the intervention arm only were included, due to the age restrictions of the QRISK2 risk equation.
Statistical analysis
The authors estimated cardiovascular risk using the Framingham, QRISK2, and SCORE risk equations,9–11 which are commonly used in UK general practice.27 The authors compared risk estimates calculated using systolic BP values obtained using different measurement techniques in the clinic, at home or through ABPM (Box 1). The primary comparison was risk calculated using BP measured as in the derivation study of each risk score with risk calculated using daytime ambulatory BP (due to its recommended use in diagnosis of hypertension).1 The authors calculated Framingham risk in primary analyses as BP measurement in the Framingham study was consistent across patients and well documented.28 Comparatively, BP measurement in the QRISK2 and SCORE derivation studies varied across patients.10,11
| Clinic blood pressurea |
|
| Home blood pressure |
|
| Ambulatory blood pressure |
|
↵a Clinic BP was measured in the non-dominant arm in HOMERUS. Where measurement techniques specify a measurement arm, this was implemented in BP-Eth as specified. In HOMERUS this was implemented using the available measurements, disregarding measurement arm. BP = blood pressure. BP-Eth = Blood Pressure in different Ethnic groups study. HOMERUS = Home versus Office blood pressure MEasurements: Reduction of Unnecessary treatment Study. QRISK2 = risk of developing a heart attack or stroke over the next 10 years. SCORE = systematic coronary risk evaluation.
Summary of different blood pressure measurement techniques considered for comparison
Absolute differences in risk were summarised by medians or interquartile ranges (IQRs) and were compared using the non-parametric Wilcoxon signed-rank test. Clinical significance was determined by calculating the proportion of people reclassified above or below the threshold for statin treatment (10% for all CVD and 5% for CVD mortality) and scatter plots. Analyses were carried out in the BP-Eth and HOMERUS cohorts separately using Stata (version 14.2).
Missing data
Analysis was restricted to patients who had complete covariate data and had at least three BP readings at visit one in BP-Eth (when measurements were taken in both arms) and visit 10 in HOMERUS (when concurrent ABPM and cholesterol measurement occurred). Twelve home BP readings measured on at least 3 days, and 19 ABPM readings (14 daytime and five night-time) were required.1,29 Cholesterol data were not collected in BP-Eth, so were simulated from a normal distribution using means and standard deviations in each age–sex strata from the Health Survey for England 2011.30 Townsend deprivation data (a UK measure of material deprivation based on employment, car ownership, home ownership, and household overcrowding)31 were not available in HOMERUS and hence patients in HOMERUS were assigned non-risk-modifying values of deprivation.
RESULTS
A total of 442 patients from the BP-Eth cohort and 165 patients from the HOMERUS cohort were included. Patient characteristics are shown in Table 1. Patients in the BP-Eth cohort were older and were from a mix of ethnic backgrounds by design. HOMERUS patients were less likely to have risk factors for cardiovascular disease, but had higher clinic BP values. Average differences in BP measurements were small, but there were large differences for some individuals, especially in the HOMERUS cohort (scatter plots are available from the authors on request).
Characteristics of the BP-Eth and HOMERUS cohorts
Differences in Framingham risk using ambulatory, home, or clinic BP measurements
In the BP-Eth cohort, comparing estimates of Framingham risk calculated using BP taken to be the mean of second and third measurements on the left arm or an alternative measure revealed that observed risk differences were generally small. Median absolute differences were <2% for all comparisons except night-time ambulatory BP measurement (Table 2). There were no significant differences in Framingham risk when calculated using daytime ambulatory BP (median absolute difference = 1.84%, IQR = 0.65–3.63, P = 0.67), home BP excluding the first day’s readings (P = 0.08), or BP measured according to current guidance (P = 0.26).
Differences in Framingham risk estimates using alternative summary measures of mean blood pressure in the BP-Eth cohort
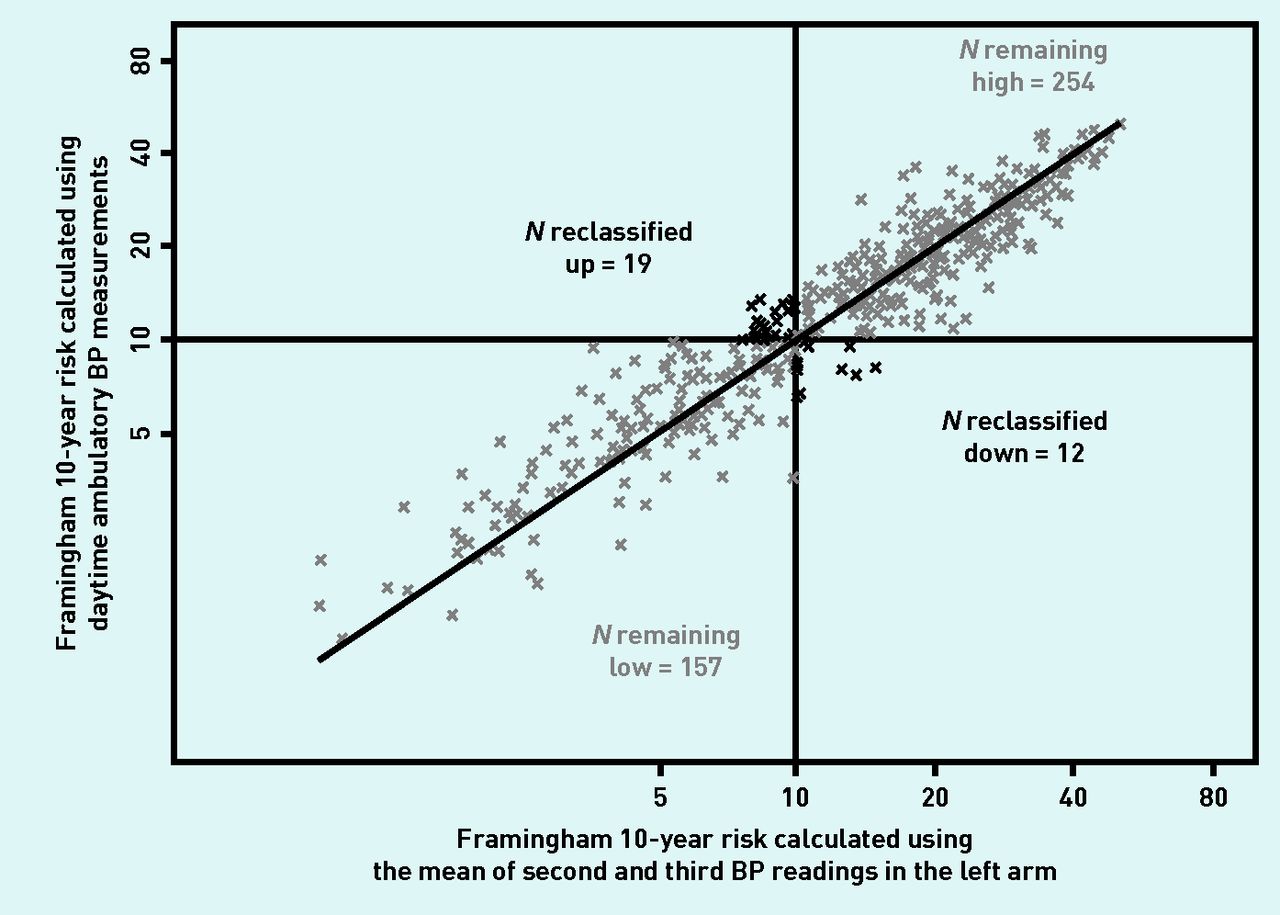
Figure 1 shows the number of BP-Eth patients reclassified across the 10% 10-year risk threshold when Framingham risk was calculated using daytime ambulatory BP compared with the mean of second and third clinic measurements on the left arm. In total 31 out of 442 (7.0%) of patients were reclassified and those reclassified had risk estimates close to the threshold. Patients were reclassified upwards or downwards if their ambulatory BP was higher or lower than their clinic BP respectively, reflecting the increased risk associated with higher BP. The largest differences in risk were observed for those already at high risk, but this pattern was not apparent when considering risk on the log-scale. Similar patterns were seen when calculating risk using home or guideline-recommended clinic BP (scatter plots are available from the authors on request).

Framingham risk estimates in the BP-Eth cohort calculated using BP measurements obtained as in the Framingham study or through daytime ABPM. ABPM = ambulatory blood pressure monitoring. BP = blood pressure. BP-Eth = Blood Pressure in different Ethnic groups study.
In the HOMERUS cohort, compared with the BP-Eth cohort, larger median absolute differences in risk were observed when using home or ambulatory BP in the Framingham risk score (Table 3). Differences were statistically significant when using BP measured through daytime ABPM (median absolute difference = 2.76%, IQR = 1.19–6.39, P<0.001), home monitoring excluding the first day’s readings (P<0.001), or according to current guidance (P = 0.006). As in the BP-Eth cohort, small numbers of people were reclassified across the 10%, 10-year risk threshold when calculating risk with daytime ambulatory BP (8 out of 165, 4.8% reclassified, Figure 2), although estimated risk was lower in the majority of patients. Similar patterns were observed when calculating risk using home or guideline-recommended clinic BP (scatter plots are available from the authors on request).
Differences in Framingham risk estimates using alternative summary measures of mean blood pressure in the HOMERUS cohort

Framingham risk estimates in the HOMERUS cohort calculated using BP measurements obtained as in the Framingham study or through daytime ABPM. ABPM = ambulatory blood pressure monitoring. BP = blood pressure. HOMERUS = Home versus Office blood pressure Measurements: Reduction of Unnecessary treatment Study.
Differences in QRISK2 risk using ambulatory, home, or clinic BP measurements
Median absolute differences in estimated QRISK2 risk were <1.5% in the BP-Eth cohort when using any alternative measures of BP (compared with a single clinic measure) and IQRs were narrower than observed for Framingham risk. This suggests that the contribution of BP to overall risk is lower in the QRISK2 equation compared with the Framingham equation. Though differences in risk were statistically significant when using BP measured through ambulatory monitoring (P<0.001), home monitoring excluding the first day (P<0.001), or as in current guidance (P<0.001), fewer people were reclassified across the 10-year risk threshold compared with those observed when using the Framingham equation. Similar results were observed in the HOMERUS cohort, with the majority of patients having lower estimated risk when using ambulatory BP (results tables and scatter plots are available from the authors on request).
Differences in SCORE risk using ambulatory, home, or clinic BP measurements
Finally, differences in SCORE risk estimates in the BP-Eth cohort were also small (<0.5%). Differences across risk scores were not directly comparable, because the SCORE equation estimates risk of CVD mortality and absolute risk levels are lower. Differences in risk were statistically significant when calculated using BP measured through ambulatory or home monitoring, or according to current guidance (P<0.001 in all cases). In the BP-Eth cohort <10% of patients were reclassified above or below the 5% 10-year CVD mortality risk threshold. The relative variation in risk observed was comparable with or more than that observed for the Framingham and QRISK2 equations respectively, reinforcing the suggestion that BP contributes less to the risk estimate in the QRISK2 equation. In the HOMERUS cohort, use of ambulatory BP primarily resulted in a reduction in estimated risk. No patients were reclassified upwards but 26 out of 165 (15.8%) patients were reclassified from high to low risk (results tables and scatter plots are available from the authors on request).
DISCUSSION
Summary
The present analysis has shown that using BP measurements obtained through ambulatory or home instead of clinic monitoring may have little effect on CVD risk estimates obtained from the Framingham, QRISK2, or SCORE risk equations. Where differences did occur, <1 in 6 people were reclassified across risk thresholds for treatment and those reclassified tended to have risk estimates close to the thresholds. The relative contribution of BP to risk appeared to be lower in QRISK2 compared with the Framingham or SCORE equation.
This study has shown that differences in cardiovascular risk estimates, when calculated using BP measurements obtained in a clinical research setting different from that of the risk score derivation studies, are likely to be small in most cases.
Strengths and limitations
The results of this study have been demonstrated in two populations from distinct countries with differing cardiovascular risk profiles and therefore have good face validity. Findings can be considered generalisable to other populations due to the different ethnic composition of the two studies. Results were also similar across the three risk scores studied.
A limitation of this analysis was that outcome data were not available to allow comparison between estimated and observed risks. Hence, the authors could not determine whether using one type of BP measurement rather than another resulted in more accurate risk assessment. However, as most patients remained at high or low risk, the ability of risk equations to detect those at high risk (discrimination) is likely to be similar regardless of the type of BP measurement used. Calibration, agreement between predicted and observed risk, may well differ and this requires further assessment in formal validation studies.
Data for cholesterol had to be simulated in the BP-Eth dataset, Townsend deprivation scores were fixed at non-risk-modifying values in the HOMERUS dataset, and only complete case analyses were carried out. As such, the authors have described possible changes in risk estimates across a range of risk values and BP differences. Further research would be required to estimate risk differences at the population level.
Clinic BP measurements in both cohorts were obtained using automated devices, which most likely limited the presence of white-coat effects compared with routine practice.32 The researchers attempted to mimic routine clinic measurement as far as possible by studying recommended protocols (which have been shown to be followed in a majority of cases in UK primary care33) and single BP readings. Larger differences in estimated risk may be observed routinely.
Comparison with existing literature
Previous research carried out in New Zealand examined differences in Framingham risk estimates when BP measurements were subject to zero end- digit preference. The study found that the mean difference in risk was 0.16% and that 2.4% of individuals were reclassified across the 20% risk threshold.20 The present study is a generalisation of the same problem: using BP measurements with differing levels of bias or measurement error from those used in risk score derivation, and results from this study support the previous findings.
The results of this analysis are also in line with the previous work of several authors, aiming to modify CVD risk scores for use with home instead of clinic BP measurements.34 Modifications to existing equations were modest and differences in risk between the modified equations and existing risk equations were small. Results presented here indicate that any changes to risk scores for use with ambulatory measurements would be similarly modest.
Although home and ambulatory BP is predictive of CVD risk over and above clinic BP,15,16 adding daytime ambulatory BP measurements to the Framingham risk score in a cohort of older males did not improve its accuracy.35 This suggests that the type of BP measurements included in risk scores may have little influence on accuracy. The small differences in risk observed in the present study again support these previous findings.
Implications for research and practice
Broadly, results from the present study indicate that healthcare professionals may not need to be unduly worried about which BP measurements to use when calculating cardiovascular risk and the choice of risk score may be of greater importance. However, there were differences in results between the HOMERUS cohort (a population selected based on high clinic BP) and BP-Eth (a mixed population of normotensive and hypertensive patients). This suggests that greater care may be warranted in those known or likely to have large white-coat or masked effects and in those with estimated risk close to treatment thresholds, as this combination of characteristics is most likely to lead to reclassification above or below treatment thresholds respectively.
Although average risk differences were small, up to 1 in 6 people were reclassified in some analyses. If such results are borne out in wider-scale analyses, this could have potentially important implications when extrapolated to the population level. However, a recent UK-based study showed that a minority of patients identified at high risk of CVD between 2010 and 2013 were initiated on treatment,36 indicating that such clinical decisions are influenced by several factors.
The apparent lower contribution of BP to risk in QRISK2 should be further explored. QRISK2 includes more risk factors than Framingham or SCORE, including a term for treated hypertension that may capture part of the BP effect. This is consistent with the relatively smaller hazard ratio for BP in QRISK2: 1.20 per 20 mmHg for CVD events,10 compared with hazard ratios of at least 1.49 for coronary heart disease and stroke mortality from observational studies,37 and 1.60 in primary prevention groups from BP-lowering trials.38
Further research is required to determine whether meaningful clinically important differences occur in subgroups and at the population level in daily practice.
Acknowledgments
The authors would like to acknowledge the investigators responsible for the design and conduct of the original BP-Eth and HOMERUS studies.
Notes
Funding
Sarah Lay-Flurrie was funded by the National Institute for Health Research School for Primary Care Research (NIHR SPCR). The views expressed are those of the author and not necessarily those of the NHS, the NIHR, or the Department of Health.
Ethical approval
No ethical approval was required for this secondary analysis of anonymised data.
Provenance
Freely submitted; externally peer reviewed.
Competing interests
Richard McManus has received blood pressure monitoring equipment for research purposes from Lloyds Pharmacies and Omron. The other authors have declared no competing interests.
Discuss this article
Contribute and read comments about this article:bjgp.org/letters
- Received July 18, 2018.
- Revision requested August 9, 2018.
- Accepted September 7, 2018.
- © British Journal of General Practice 2019
REFERENCES
In this issue


Jump to section
More in this TOC Section
Related Articles
Cited By...

