


Abstract
Background Financial incentives in the UK such as the Quality and Outcomes Framework (QOF) reward GP surgeries for achievement of nationally defined targets. These have shown mixed results, with weak evidence for some measures, but also possible unintended negative effects.
Aim To look at the effects of a local intervention for atrial fibrillation (AF) and hypertension, with surgeries rewarded financially for work, including appointing designated practice leads, attendance at peer review workshops, and producing their own protocols.
Design and setting A controlled before–after study comparing surgery performance measures in UK primary care.
Method This study used published QOF data to analyse changes from baseline in mean scores per surgery relating to AF and hypertension prevalence and management at T1 (12 months) and T2 (24 months) for the intervention group, which consisted of all 58 surgeries in East Lancashire Clinical Commissioning Group (CCG), compared to the control group, which consisted of all other surgeries in north-west England.
Results There was a small acceleration between T0 (baseline) and T2 in recorded prevalence of hypertension in the intervention group compared to the controls, difference 0.29% (95% confidence interval [CI] = 0.05 to 0.53), P = 0.017, but AF prevalence did not increase more in the intervention group. Improvement in quality of management of AF was significantly better in the intervention group, difference 3.24% (95% CI = 1.37 to 5.12), P = 0.001.
Conclusion This intervention improved diagnosis rates of hypertension but not AF, though it did improve quality of AF management. It indicates that funded time to develop quality-improvement measures targeted at a local population and involving peer support can engage staff and have the potential to improve quality.
INTRODUCTION
Since 2004 a significant proportion of income for UK primary care has come from pay-for-performance quality-improvement schemes such as the Quality and Outcomes Framework (QOF).1–4 Their effectiveness in providing large-scale quality improvement has been questionable, with a Cochrane Review in 2011 concluding that there was not enough evidence to either support using or not using such schemes.5 Finding a meaningful control group for comparison of national schemes is often impossible, and though time-series analysis did appear to show a small initial acceleration in improvement of certain standards after the introduction of QOF, this was short lived.6–8 Negative effects on quality have also been reported relating to a lack of a holistic approach, reduced patient-centredness, and time away from clinical care to complete paperwork.5,8–13
Alternative quality-improvement methods have been suggested that both focus on local health needs and avoid pay-for-performance measures.1,12,14–16 This study aimed to measure the effects of one such intervention used across East Lancashire, where recorded rates of atrial fibrillation (AF) and hypertension were lower than expected,17 which funded surgeries to design and reflect on their own quality-improvement programmes for these conditions, tailored to local needs.
METHOD
Study design and setting
The authors conducted a controlled before–after study looking at the effects on patients of a quality-improvement intervention that aimed to improve diagnosis and management of AF and hypertension within the intervention group, which consisted of all surgeries in East Lancashire Clinical Commissioning Group (CCG) compared to a control group, which consisted of all other surgeries in north-west England. Both groups continued to participate in, and provide data through QOF. The authors excluded two out of 1174 (0.17%) surgeries for which published data existed at baseline — both newly opened control surgeries — as they either did not have any patients registered with AF or hypertension, or had a list size of <10 patients. All surgeries in East Lancashire CCG participated in the intervention, which is described in Box 1.17 Representatives from each surgery attended 3-monthly quality-improvement workshops for the first year, aimed at sharing ideas about best practice. Reminders on surgeries’ clinical systems were allowed in both groups, which are mainly triggered by absent QOF indicators such as no recent CHA2DS2-VASc, no recent blood pressure (BP) reading, or decision needed on whether to anticoagulate. Additional prompts for relevant non-QOF indicators such as checking pulse rhythm in patients aged ≥65 years were promoted during workshops for surgeries in the intervention group but remained optional.
| Clinical area (remuneration) | Agreed standards | Required outcomes |
|---|---|---|
| Atrial fibrillation | ||
| (0.35 GBP per weighted head of total population on books) |
|
|
| Hypertension | ||
| (0.25 GBP per weighted head of population) |
|
|
AF = atrial fibrillation. BP = blood pressure. ECG = electrocardiogram. QOF = Quality Outcomes Framework.
Intervention: agreed standards and required outcomes of family practices for improvement in management and diagnosis of patients with atrial fibrillation and hypertension
| Over the last 10 years new quality-improvement interventions such as the NHS health check have struggled to engage UK general practice. This study shows that facilitating a locally designed intervention tailored to the needs of the local population, without the burden of targets, may lead to higher levels of engagement by GP surgeries. Previous studies looking at quality-improvement interventions for diagnosis and management of atrial fibrillation (AF) and hypertension have been mixed in their findings, and interpretation has been difficult owing to limitations of time-series analyses or controls based in different healthcare systems. This study compares results with a local control group and demonstrates a statistically significantly higher increase in diagnosis rates of hypertension but not AF. Improvement in quality of management of AF showed a statistically significantly higher increase, though this was not demonstrated for control of hypertension. |
How this fits in
Outcome measures
Outcome measures are summarised in Box 2. Data are available for the end of each QOF year (31 March)18–20 at surgery and CCG level. These were obtained for 31 March 2016 (T0: the day before intervention started), 31 March 2017 (T1: 12 months), and 31 March 2018 (T2: 24 months) for all surgeries in north-west England. CCG-wide prevalence data were also obtained for QOF years before the intervention: 31 March 2013 (T–3), 31 March 2014 (T–2), and 31 March 2015 (T–1) to allow time-series analyses. All patients excepted for QOF data (unsuitable, no consent to investigate, or treat) were included in all outcome measures to prevent bias arising from different surgery policies on excepting patients.
| Clinical group | Outcome/QOF indicator code | Numerator | Denominator |
|---|---|---|---|
| Atrial fibrillation | AF001 | Patients recorded as having AF | Whole population of surgery |
| DQAF1 | Patients with AF treated successfully as per QOF indicators AF006 and AF007, by having a previous CHA2DS2-VASc score of ≥2 and being on anticoagulation, or having an up-to-date CHA2DS2-VASc score of <2 in the past 12 months | Total number of patients with AF within surgery (AF001)a | |
| Hypertension | HYP001 | Patients recorded as having hypertension | Whole population of surgery |
| HYP006 | Patients with hypertension whose BP is treated successfully to ≤150/90 mmHg in the past 12 months | Total number of patients with hypertension within surgery (HYP001)b | |
| BP002 | Patients aged 45 years who have a recorded BP reading in the past 12 months | Whole population of surgery aged ≥45 yearsc | |
↵a QOF data excludes patients newly (within the past 3 months) diagnosed or registered with the surgery.
↵b QOF data excludes patients newly (within the past 9 months) diagnosed or registered with the surgery.
↵c QOF data excludes patients newly (within the past 3 months) registered with the surgery. AF = atrial fibrillation. BP = blood pressure. QOF = Quality Outcomes Framework.
Atrial fibrillation and hypertension outcome measures
The primary outcome measures looked at two improved rates of diagnosis. These were the change in mean prevalence of AF; and the change in mean prevalence of hypertension, at T1 and T2 compared to baseline. Secondary outcome measures looked at quality of management of AF and hypertension, and in assessing patients at risk of hypertension. The QOF indicator DQAF1 combined the two QOF measures that look at subgroups of patients with AF, in order to assess the quality of management across the whole AF population.
Statistical analysis
Primary analysis included patient data from all surgeries in north-west England, based on the practice code to avoid loss of data owing to renamed surgeries. Surgeries with no data for outcome measures at T1 or T2 (surgery closed down, merged without maintaining practice code or opted out of QOF), were excluded from calculations relating to these time points. Independent t-tests were used to compare changes in the intervention group to those in the control group for all outcome measures. Time-series analyses provided further evaluation of changing prevalence rates by assessing the net annual changes in prevalence per CCG from T0 to T2 compared to before the intervention (T–3 to T0). SPSS (version 24) was used for all statistical analyses and Excel for graphs.
RESULTS
Flow of surgeries in the intervention and control groups is shown in Figure 1. The intervention commenced 1 April 2016 with the workshops and local protocol design occurring in the first 12 months. Data were analysed for all 58 surgeries in the intervention group and all 1114 in the control group. Loss of follow-up owing to closure, being amalgamated into a larger surgery, or opting out of QOF, was small with 1 (1.7%) surgery lost to follow-up in the intervention group and 33 (3.0%) lost to follow-up in the control group.
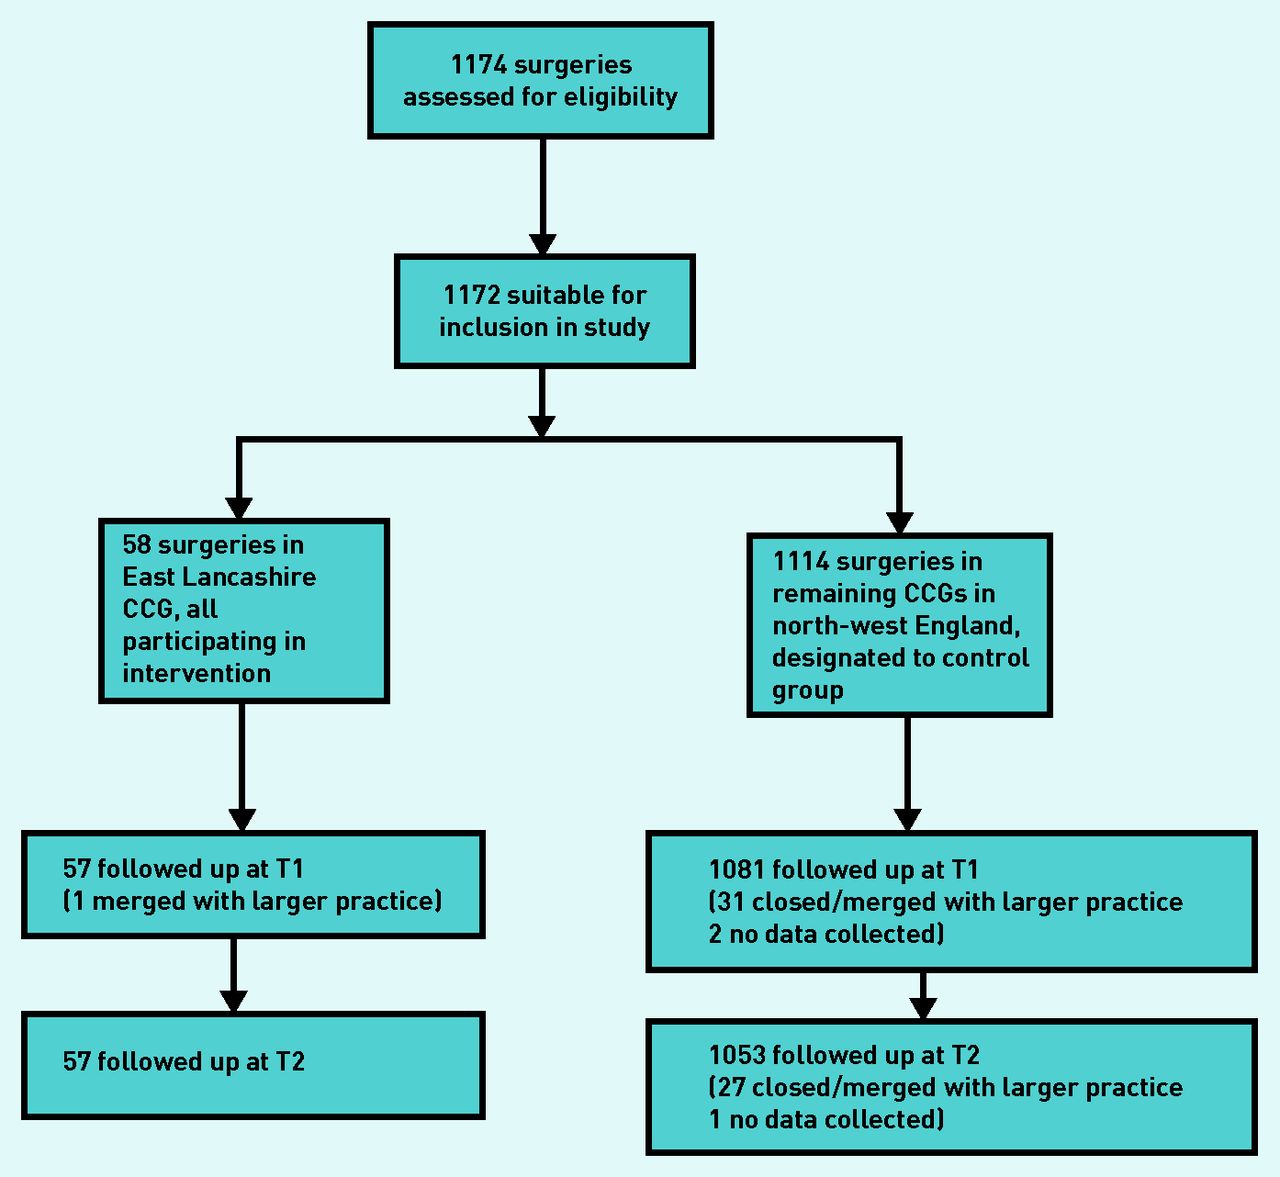
Flow diagram showing participation and flow through the study. CCG = clinical commissioning group. T1 = 12 months from baseline time. T2 = 24 months from baseline time.
The QOF provides limited data relevant to disease populations from which baseline demographics can be taken. However, the data do show similar percentages in age/sex groups recorded by QOF in the two study groups, and identical mean list size (Table 1). Estimated actual disease prevalence data based on demographics such as age, sex, and deprivation indices, were also similar: disease prevalence 2.46% for the intervention group, compared to 2.47% for the control group for AF, and 23.88% and 24.30% respectively for hypertension21,22 (data not shown).
Baseline demographics
Table 2 shows the mean values for each outcome measure per surgery at T0 (baseline), T1 (12 months), and T2 (24 months) within the control and intervention groups, and compares the P-values for the change from baseline between the groups. From T0 to T2, mean hypertension prevalence in the intervention group increased from 13.80% to 14.35%, mean change per surgery 0.59%, and in the control group, it increased from 14.50% to 14.74%, mean change 0.30%. This gives a difference between groups of 0.29% (95% confidence interval [CI] = 0.05 to 0.53), P = 0.017. Using Benjamini–Hochberg correction for multiple comparisons to assess significance of any changes at an individual time point ( ), this remains statistically significant. Mean AF prevalence in the intervention group increased from 1.55% to 1.81%, mean change 0.26%, and in the control group, it increased from 1.77% to 1.99%, mean change 0.22%. This gives a statistically non-significant mean change between groups of 0.04% (95% CI = −0.03 to 0.12).
Surgery-level summary of outcome measures determined from published QOF data before and 12 months following introduction of intervention
There were no data available for the control group on pulse checks performed for people aged ≥65 years without known AF in the past year as it does not form part of QOF, and no baseline data for the intervention group. Analysis within the intervention group (for people ≥40 years as the local intervention targeted a slightly lower age range than QOF) at 15 months and 27 months respectively (the closest available to T1 and T2) showed improving standards with a mean rate per surgery of 37.67% (95% CI = 32.84 to 42.50) at 15 months, and 45.85% (95% CI = 41.24 to 50.46) at 27 months, an increase of 8.18% (95% CI = 1.57 to 14.80) over 12 months, P = 0.016 (data not shown).
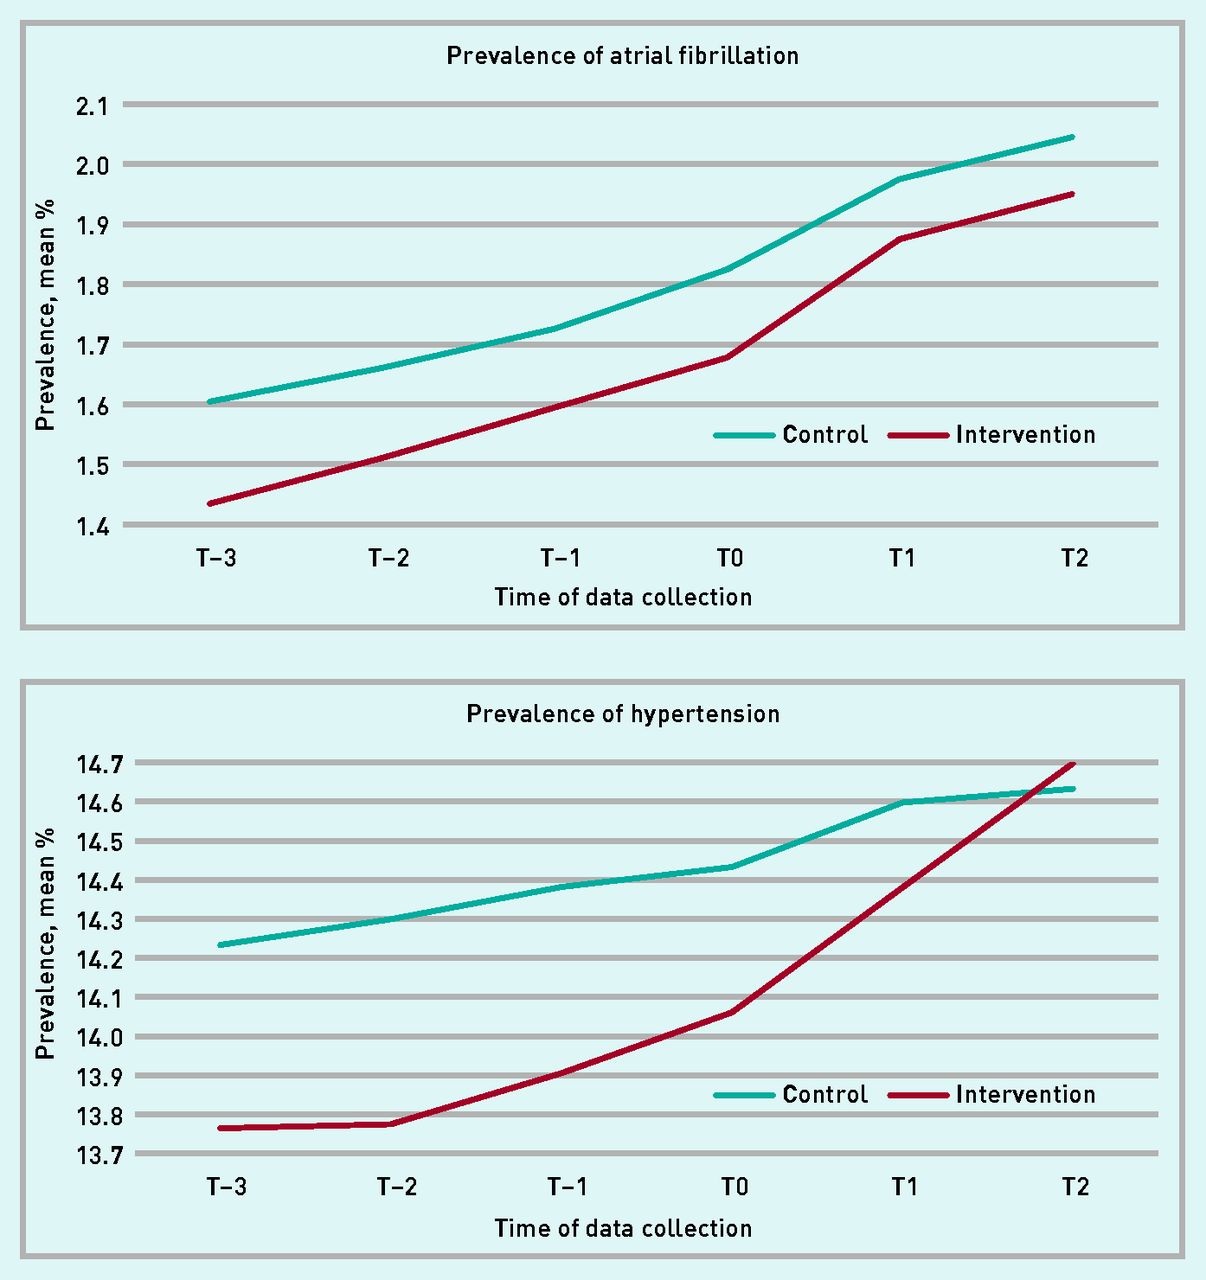
Time-series analyses for mean recorded prevalence of AF and hypertension per CCG are shown in Figure 2, comparing the 2 years since the study commenced to the 3 previous years. For hypertension, the annual rate of increase increased by 0.18% per year more in the intervention group than in the control group (95% CI = −0.25 to 0.61), but this was statistically non-significant (P = 0.40). The change in rate of annual increase of AF prevalence was very similar (0.02% per year higher in the intervention group).
Prevalence of AF and hypertension per CCG. AF = atrial fibrillation. CCG = clinical commissioning group. T–3 = 36 months before baseline. T–2 = 24 months before baseline time. T–1 = 12 months before baseline time. T0 = baseline time. T1 = 12 months from baseline time. T2 = 24 months from baseline time.
DQAF1, a marker of quality in management of patients recorded as having AF, showed a significant increase in the intervention group compared to the control group. In the intervention group, it increased from 73.25% at T0 to 82.86% at T2, mean change 9.58%, Table 2. The mean in the control group increased from 78.48% at T0 to 84.77% at T2, mean change 6.34%. This gives a mean change between groups of 3.24% (95% CI = 1.37 to 5.12), P = 0.001. The difference in BP002 at T2 compared to T0 was 0.55% in the intervention group and 0.10% in the control group, giving a mean change between groups of 0.45% (95% CI = 0.04 to 0.86), P = 0.03. These differences in the change from baseline remained statistically significant when correcting for multiple measures using the Benjamini–Hochberg correction. The mean change in HYP006 at T2 compared to T0 was 0.43% in the intervention group and −0.22% in the control group, giving a statistically non-significant mean change between groups of 0.65% (95% CI = −0.06 to 1.93).
At the same time as the presented intervention, there was a pharmacist-led scheme for patients in East Lancashire CCG with a diagnosis of AF who were taking direct oral anticoagulants (DOACs). In order to assess whether this might be the main driver behind improvements in DQAF1, the authors used study data (available for the intervention group only) on the proportion of patients with AF who were taking DOACs. Bivariate Pearson correlation found no statistically significant relationship between the change in DQAF1 and the proportion of patients taking DOACs (P = 0.22 at both T1 and T2).
DISCUSSION
Summary
In this controlled before–after study compared to the control group, there was a statistically significant increase in mean prevalence rate of hypertension but not AF in surgeries carrying out an intervention, which included appointing surgery leads for AF and hypertension, sending representatives to quarterly quality-improvement workshops, and producing surgery protocols. Time-series analyses at CCG level looking at annual changes in recorded AF and hypertension prevalence before and during the intervention showed this was unlikely to be due to pre-existing trends differing between the two groups.
The increase in percentage of patients diagnosed with AF who received optimal care and management relating to anticoagulation was statistically significantly larger in the intervention group. Local work outside of the intervention aimed at improving management of patients with AF taking DOACs did not seem to be the main driver behind this, though could have had an incremental effect as part of a multidisciplinary response. There was a small significant increase in the intervention group in the percentage of patients aged ≥45 years with a BP check in the past 5 years, though there were no significant differences in the change in quality of care for patients with hypertension, as measured by BP ≤150/90 mmHg.
Strengths and limitations
This study eliminates selection bias when GP surgeries except patients — seen in all seven studies looked at by the Cochrane Review5 — and provides a well-matched control group in the same timeframe and region as the intervention group, eliminating potential bias seen in other studies.1,10,12 Similarities in baseline measures and expected prevalence rates in the present intervention and control groups,21,22 provide confidence that the two groups are likely to be similar populations. Engagement in the intervention appeared good with 100% invited surgeries agreeing to take part, and nearly half of targeted patients per surgery receiving an annual pulse rhythm check, with significant improvements demonstrable between 15 and 27 months.
The main drawback of this study’s control group was that other CCGs may have run their own schemes on top of usual care, and measures of standards, such as rates of pulse checks, were unavailable from the control group. However, effects from a single CCG are minimised by the control group consisting of 30 CCGs. There is also risk of contamination from patients registering with a different surgery and so moving between groups, or away from the region completely. This effect is likely to be small as there is <2% annual change in numbers of patients registered within the intervention group, which closely follows the national trend for population growth, taking into account mortality rates of 0.97% in the intervention group and 0.92% in the control group.18–20,23
Analysis of QOF data is limited by data being recorded only once a year, and it is possible that more data points would have demonstrated a short-lived significant benefit to AF prevalence rates, as the difference approached significance after 12 months but was smaller by 24 months.
Comparison with existing literature
In recent years, new GP quality-improvement schemes have seen lower participation rates than QOF, for example the Learning Disabilities Health Check Scheme with 65% uptake, and high variability between populations, for example the NHS Health Check uptake per local authority ranging from 9.5%–53.0%. Reasons suggested for these include lack of resources, incentive size, and poor population engagement.24,25 However, this study shows that if these can be overcome, there can still be high engagement.
The present finding that a primary care hypertension intervention can cause a statistically significant increase in recorded prevalence rates differs from the three previous primary care hypertension studies, all of which showed no significant difference.26–28 Better engagement by patients enabled by local design of protocols to fit practices’ own populations may have aided this finding in this study. Time-series analysis of a similar but uncontrolled intervention performed in London, showed an acceleration in AF prevalence rate during the intervention,29 but acceleration seen in the control group of the present study showed how this can be caused by external factors. An earlier randomised controlled trial (RCT) did show a significantly higher rate of new AF detection within an opportunistic screening group.30 It is unclear whether the present findings of no statistically significant increase in recorded AF prevalence differ owing to reduced response to computer prompts, reduced effectiveness of pragmatic studies, competing external factors, or a short-lived effect not detectable at T1 or T2.
Previously reported clinical effectiveness of quality-improvement schemes such as QOF in improving measurable outcomes has been mixed, for both chronic diseases generally and hypertension.5,8–12,15,31–33 The quality-improvement scheme for AF analysed in this article bore similarities to a scheme previously used in three London primary care trusts, which used clinician education, workshops involving peer feedback, and computer prompts.34 In that observational study, time-series analysis showed improvements in quality measures of management of AF in relation to anticoagulation, and by comparison with a valid control group; the current study provides evidence that improvements demonstrated are likely to be due to the intervention itself and not the result of external influences. Three RCTs in primary care, all in Europe, have looked at the use of computer prompts alone without any other intervention, and only the Swedish study demonstrated any statistically significant benefit (P = 0.013).35–37
Implications for research and practice
This study demonstrates that GP surgeries can engage in new funded quality-improvement schemes that use interventions tailored to local needs, avoid target-driven payments, and involve peer sharing of best practice. Research comparing these to existing schemes such as QOF are needed to check that effects of performance loss seen following removal of some other financial incentivised QOF targets did not outweigh any benefits of a new scheme.38
Questions are raised by this study about the effectiveness of simple opportunistic schemes to increase AF diagnosis, as recommended by some recent commentators.39,40 More research is needed to understand which real-world interventions are best placed to increase diagnosis rates, and what components or incentives may be crucial in facilitating this. Initiatives outside of traditional healthcare settings such as community health days at work, shops, or recreational places may yield better results. It is worth noting, especially for hypertension, that quality of diagnosis does not necessarily equal quantity, although overall it does appear that it is under diagnosed in north-west England.22 The 2011 National Institute of Care and Excellence guidelines suggested an increased use of home and ambulatory BP monitoring to reduce inappropriate diagnoses in people who have a ‘white-coat effect’41 Future research may wish to look at improved specificity of these investigation methods in diagnosing hypertension rather than viewing any increase in diagnosis rates as better, but this was not possible using QOF data.
There may be benefits from recording new diagnosis rates in the QOF and research studies looking at how to avoid effects on prevalence of AF and hypertension from external factors, such as increasing life expectancy and geographical mobility (the incidence of changing GP surgeries). Future refinement of QOF may ensure that measures of chronic disease management more fully reflect quality of care. DQAF1 seems a more accurate way of monitoring quality outcomes for the whole population of patients with AF than the QOF outcome measures AF006 and AF007, which look at success among subgroups of patients with AF only. With these, interpretation of year-on-year changes in quality of care is difficult; a high previous achievement in AF006 would decrease the current denominator size for AF006, while high achievement in AF006 in this or previous years would be likely to increase the subgroup denominator size for AF007.
Recent views on the impact of financial incentives to improve outcomes for patients with chronic diseases have tended to suggest a move away from payment for meeting targets.10,13,42 The present study demonstrates that there is potential to improve quality of care using an intervention without targets, though it may not be applicable to all types of chronic disease.
Further research is needed to understand why benefits were shown for quality of AF management but not for hypertension control. Impact on clinicians’ practices may have been bigger for AF than for hypertension, as it has been shown that clinicians tend to underestimate the potential benefit of anticoagulation (for AF) and overestimate the risks.43 Education may have increased confidence in prescribing anticoagulants, whereas skills in treating BP had less room for improvement. Surveys of clinicians attending workshops may be useful to assess whether this is the case.
Acknowledgments
The authors would like to thank all staff at GP surgeries within East Lancashire, especially those who attended the AF and hypertension quality-improvement workshops.
Notes
Funding
This research received no specific grant from any funding agency, commercial or not-for-profit sectors.
Ethical approval
Not applicable.
Provenance
Freely submitted; externally peer reviewed.
Competing interests
Umesh Chauhan is a partner at Pendle View Medical Centre, a GP surgery in East Lancashire, and is research lead for East Lancashire CCG. Timothy Smith has worked on a salaried/sessional basis at three of the other GP surgeries in East Lancashire.
Discuss this article
Contribute and read comments about this article: bjgp.org/letters
- Received April 8, 2019.
- Revision requested May 10, 2019.
- Accepted May 28, 2019.
- © British Journal of General Practice 2019
REFERENCES
In this issue


Jump to section
Keywords
More in this TOC Section
Related Articles
Cited By...

