


Article Figures & Data
Figures
- Figure 1.
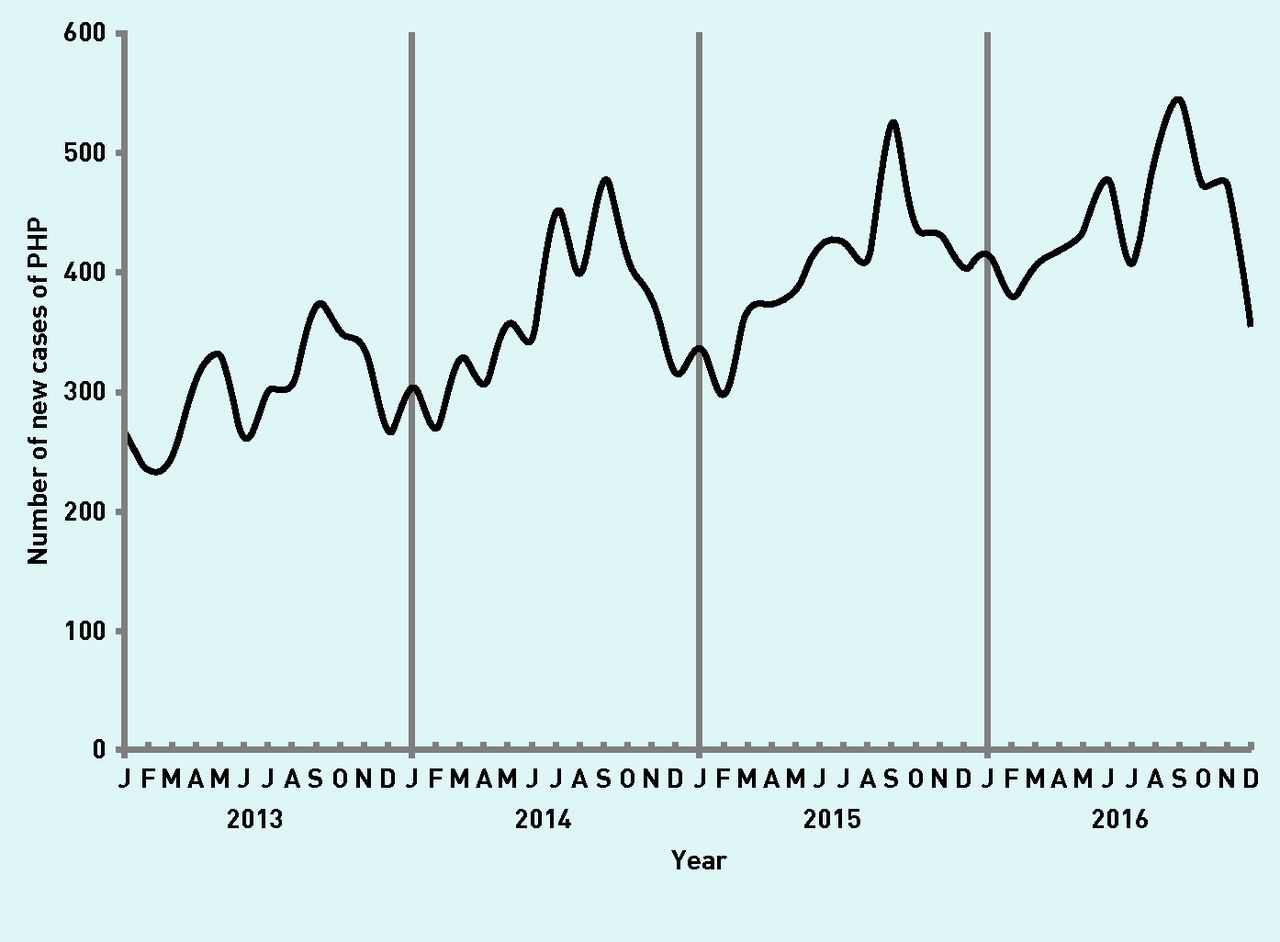
Incidence of plantar heel pain (PHP) during the study period (1 January 2013 – 31 December 2016).
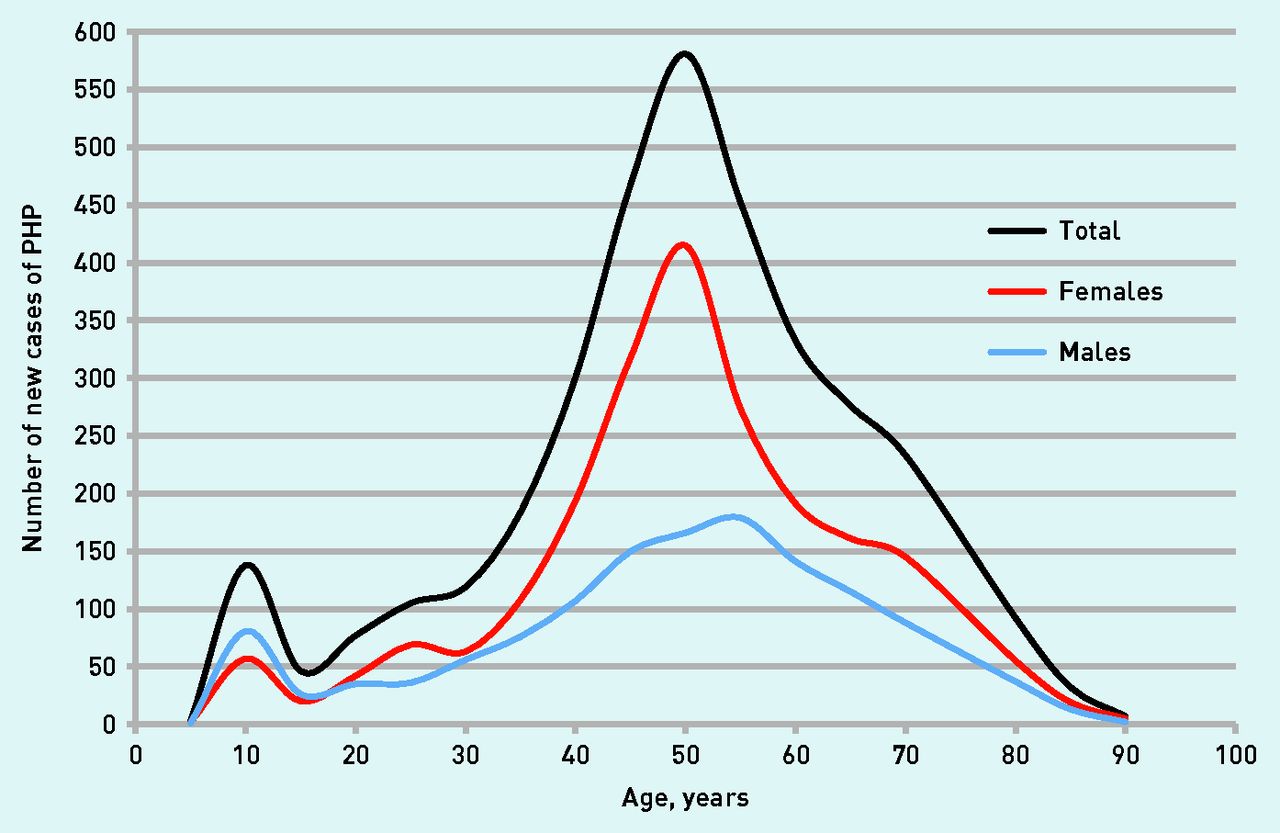
- Figure 2.
Age distribution in a cohort of 18 004 patients with incident plantar heel pain (PHP).

Tables
How this fits in
An average GP sees about 8 new cases with plantar heel pain (PHP) per year, which makes it a common foot complaint, typically encountered in middle-aged females who are overweight. This study found a seasonal change in the incidence of PHP, since a peak in incidence of PHP was seen in September and October of each examined calendar year. The clinical course of PHP is considered favourable, though this study showed that a large variety of treatments are applied and vary greatly among GPs, with non-steroidal anti-inflammatory drugs, referral to a paramedical podiatric specialist, and insoles as the most commonly applied interventions. About one-third of patients included in the present study had multiple consultations with their GP for PHP within 12 months of the first diagnosis. More knowledge on the effectiveness of these applied treatments seems mandatory as evidence on the effectiveness is lacking. - Table 1.
Different policies and interventions provided during the first consultation (N = 933)
Policy during first consultation for PHP Number of times policy or intervention was provided to a patienta, n (%) (N= 933) Patients receiving the policy during a follow-up consultation per age categorya, n (%) <18 years, n (%) (N = 62) 18–40 years, n (%) (N= 164) 41–65 years, n (%) (N = 546) >65 years, n (%) (N= 161) Wait-and-see 168 (18.0) 13 (21.0) 23 (14.0) 97 (17.8) 35 (21.7) Diagnostics 80 (8.6) 3 (4.8) 10 (6.1) 51 (9.3) 16 (9.9) Interventions Exercises 91 (9.8) 5 (8.1) 15 (9.1) 58 (10.6) 13 (8.1) Shoe advice 51 (5.5) 6 (9.7) 7 (4.3) 31 (5.7) 7 (4.3) Insoles 153 (16.4) 10 (16.1) 26 (15.9) 90 (16.5) 27 (16.8) Other orthotic device 73 (7.8) 4 (6.5) 15 (9.1) 42 (7.7) 12 (7.5) NSAID 186 (19.9) 1 (1.6) 50 (30.5) 116 (21.2) 19 (11.8) Other medication 58 (6.2) 1 (1.6) 9 (5.5) 29 (5.3) 19 (11.8) Injection with corticosteroids 13 (1.4) 0 1 (0.6) 9 (1.6) 3 (1.9) Other intervention 4 (0.4) 0 0 3 (0.5) 1 (0.6) Referrals Referral to paramedical podiatric specialist 184 (19.7) 21 (33.9) 40 (24.4) 100 (18.3) 23 (14.3) Referral to physiotherapist 47 (5.0) 5 (8.1) 6 (3.7) 24 (4.4) 12 (7.5) Referral to orthopaedic surgeon 17 (1.8) 0 2 (1.2) 11 (2.0) 4 (2.5) Other referral 26 (2.8) 2 (3.2) 4 (2.4) 12 (2.2) 8 (5.0) Referrals total 274 (29.4) 28 (45.2) 52 (31.7) 147 (26.9) 47 (29.2) ↵a Patients could receive >1 intervention per consultation or no intervention in case of a wait-and-see policy, therefore number of patients in these cells does not total 933. NSAID = non-steroidal anti-inflammatory drug. PHP = plantar heel pain.
- Table 2.
Differences in policies during the first consultation for duration of complaints (N = 933)
Policies, consultations, and interventions Acute (N = 162) Subacute (N= 269) Chronic (N= 32) Unknown (N= 470) χ2/F-statistic Post-hoc analysis P-value Wait-and-see, n (%) 40 (24.7) 37 (13.8) 2 (6.3) 89 (18.9) 11.47 (P = 0.009) acute: 0.015;
subacute: 0.031NSAID, n (%) 52 (32.1) 53 (19.7) 6 (18.8) 75 (16.0) 19.71 (P<0.001) acute: <0.001 Referral, n (%) 20 (12.3) 96 (35.7) 13 (40.6) 145 (30.9) 30.26 (P<0.001) acute: <0.001;
subacute: 0.007Number of interventions during first consultation, mean (SD) 1.06 (0.90) 1.04 (0.75) 0.78 (0.55) 0.90 (0.67) 3.711 (P = 0.011) – Number of total consultations for PHP in 12 months, mean (SD) 1.56 (1.11) 1.56 (0.93) 1.78 (1.36) 1.47 (1.03) 1.258 (P = 0.287) – Total number of interventions for PHP in 12 months, mean (SD) 1.50 (1.39) 1.49 (1.03) 1.25 (0.88) 1.28 (1.06) 2.822 (P = 0.38) – NSAID = non-steroidal anti-inflammatory drug. PHP = plantar heel pain. SD = standard deviation.
- Table 3.
Differences in policies during the first consultation for localisation of complaints (N = 933)
Policies, consultations, and interventions Unilateral (N = 635) Bilateral (N= 122) Unknown (N= 176) χ2/F-statistic Post-hoc analysis P-value Wait-and-see, n (%) 111 (17.5) 13 (10.7) 44 (25.0) 10.41 (P = 0.005) bilateral: 0.023 NSAID, n (%) 137 (21.6) 12 (9.8) 37 (21.0) 9.00 (P = 0.011) bilateral: 0.003 Referral, n (%) 174 (27.4) 47 (38.5) 53 (30.1) 6.16 (P = 0.046) bilateral: 0.017 Number of interventions during first consultation, mean (SD) 1.00 (0.77) 0.93 (0.62) 0.88 (0.71) 2.023 (P = 0.133) – Number of total consultations for PHP in 12 months, mean (SD) 1.51 (1.02) 1.64 (1.04) 1.49 (1.08) 0.935 (P = 0.393) – Total number of interventions for PHP in 12 months, mean (SD) 1.40 (1.10) 1.40 (0.96) 1.31 (1.24) 0.477 (P = 0.621) – NSAID = non-steroidal anti-inflammatory drug. SD = standard deviation. PHP = plantar heel pain.
- Table 4.
Different policies and interventions provided during follow-up consultations (N = 288)
Policy during follow-up consultations for PHP Patients receiving policy during a follow-up consultationa, n (%) (N= 288) Patients receiving policy during a follow-up consultation per age group,a n (%) <18 years (N= 12) 18–40 years (N= 34) 40–65 years (N= 191) >65 years (N= 51) Wait-and-see 85 (29.5) 6 (50.0) 10 (29.4) 53 (27.7) 16 (31.4) Diagnostics 34 (11.8) 1 (8.3) 3 (8.8) 32 (16.8) 7 (13.7) Interventions Exercises 15 (5.2) 0 3 (8.8) 11 (5.8) 1 (2.0) Shoe advice 6 (2.1) 0 0 6 (3.1) 0 Insoles 23 (8.0) 1 (8.3) 1 (2.9) 13 (6.8) 8 (15.7) Other orthotic device 14 (4.9) 0 0 12 (6.3) 2 (3.9) NSAID 70 (24.3) 0 7 (20.6) 49 (25.7) 14 (27.5) Other medication 19 (6.6) 1 (8.3) 3 (8.8) 11 (5.8) 4 (7.8) Injection with corticosteroids 26 (9.0) 0 3 (8.8) 19 (9.9) 4 (7.8) Referrals Referral to paramedical podiatric specialist 74 (25.7) 3 (25.0) 11 (32.4) 46 (24.1) 14 (27.5) Referral to physiotherapist 32 (11.1) 0 2 (5.9) 25 (13.1) 5 (9.8) Referral to orthopaedic surgeon 55 (19.1) 2 (16.7) 7 (20.6) 38 (19.9) 8 (15.7) Other referral 16 (5.6) 0 3 (8.8) 11 (5.8) 2 (3.9) >1 referral 18 (6.3) 0 1 (2.9) 12 (6.3) 5 (9.8) ↵a Patients could receive >1 intervention per consultation or no intervention in case of a wait-and-see policy, therefore number of patients in these cells does not total 288. NSAID = non-steroidal anti-inflammatory drug. PHP = plantar heel pain.
- Table 5.
Policies and interventions provided during subsequent consultations for PHP (within 12 months) depending on what happened during the first consultation (N = 933)
Policy or intervention during first consultationa Patients returning for multiple consultations, n (%) Patients with wait-and-see policy during follow-up consultation, n (%) Patients receiving a referral during follow-up consultation, n (%) Total interventions provided, mean (SD) Total consultations with GP in 12 months, mean (SD) Any (n= 933) 288 (30.9) 85 (9.1) 160 (17.1) 1.38 (1.11) 1.52 (1.03) Diagnostics (n = 80) 73 (91.3) 33 (41.3) 33 (41.3) 1.09 (1.07) 2.28 (1.04) Wait-and-see (n = 168) 54 (32.1) 13 (7.7) 31 (18.5) 0.48 (0.99) 1.60 (1.21) Referral to paramedical podiatric specialist (n = 184) 31 (16.8) 8 (4.3) 19 (10.3) 1.48 (0.78) 1.32 (0.83) Referral to physiotherapist (n = 47) 7 (14.9) 4 (8.5) 4 (8.5) 1.38 (0.77) 1.28 (0.85) Exercises (n = 91) 19 (20.9) 5 (5.5) 9 (9.9) 2.16 (1.07) 1.34 (0.87) NSAID (n = 186) 60 (32.3) 19 (10.2) 33 (17.7) 2.06 (1.33) 1.58 (1.12) NSAID = non-steroidal anti-inflammatory drug. PHP = plantar heel pain. SD = standard deviation.
↵a Patients could receive multiple interventions/diagnostics/policies, therefore number of patients in these cells does not total 933.
In this issue


Jump to section
More in this TOC Section
Related Articles
Cited By...

