


Article Figures & Data
Figures
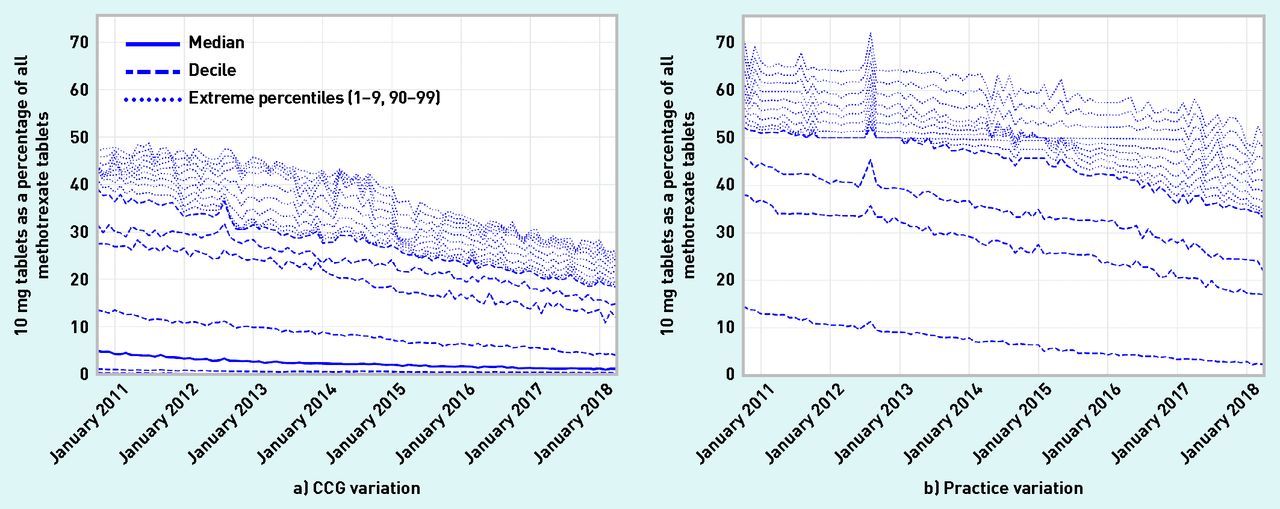
- Figure 1.
Prescribing of 10 mg tablets as a proportion of all methotrexate tablets prescribed across CCGs and practices in England, October 2010–April 2018. CCG = clinical commissioning group.
- Figure 2.
Variation between CCGs of 10 mg items as a proportion of all methotrexate tablets in a) London and b) England, excluding London, May 2017–April 2018. CCG = clinical commissioning group.

Tables
How this fits in
In the UK, it is recommended that, when prescribing oral methotrexate tablets, only 2.5 mg tablets should be used; this is to minimise the risk of accidental overdose, which can be fatal. This study shows that breaches of this guidance are common, and vary widely between practices: 9.5% (n = 697) of all practices (n = 7349) give ≥14.3% of their methotrexate as 10 mg tablets; and 1% of practices (n = 66) give ≥52.4% as 10 mg tablets. Twenty-one deaths caused by methotrexate poisoning have been reported in England and Wales from 1993 until 2017. Anyone can view monthly data on all general practices breaching national methotrexate safety guidance (openprescribing.net/measure/methotrexate), supporting audit and review of current practice. - Table 1.
Top 10 CCGs prescribing 10 mg items as a percentage of all methotrexate tablets prescribed, May 2017–April 2018
CCG Measure of prescribing of 10 mg items as a proportion of all methotrexate tablets, % NHS Dartford, Gravesham, and Swanley CCG 37.6 NHS Milton Keynes CCG 29.8 NHS Bexley CCG 28.6 NHS Enfield CCG 26.2 NHS Leeds CCG 25.6 NHS Waltham Forest CCG 21.4 NHS Greenwich CCG 20.8 NHS Central London (Westminster) CCG 17.9 NHS Hounslow CCG 17.7 NHS Hillingdon CCG 17.3 CCG = clinical commissioning group.
- Table 2.
Absolute proportion of 10 mg methotrexate prescribing, stratified by various practice factors, along with odds ratios from a univariable and multivariable logistic regression model.
Variable Practices with >10% 10 mg methotrexate prescribing, % Univariable logistic regression Multivariable logistic regression OR 95% CI OR 95% CI Patients aged >65 years, %a 0–10.9 27.2 Reference Reference 10.9–15.5 19.3 0.64 0.54 to 0.76 0.76 0.59 to 0.99 15.5–18.9 13.6 0.42 0.35 to 0.51 0.63 0.45 to 0.89 18.9–22.5 8.1 0.23 0.19 to 0.29 0.36 0.24 to 0.55 22.5–92.2 5.4 0.15 0.12 to 0.20 0.27 0.16 to 0.45 Patients aged <18 years, %a 0–17.8 11.6 Reference Reference 17.8–19.6 10.7 0.92 0.73 to 1.16 0.85 0.62 to 1.17 19.6–21.2 12.9 1.13 0.90 to 1.41 0.69 0.49 to 0.95 21.2–23.6 17.6 1.63 1.32 to 2.01 0.71 0.51 to 0.99 23.6–53.6 20.8 2.01 1.63 to 2.46 0.68 0.48 to 0.96 Patients with a long-term health condition, %a 16.5–47.0 23.6 Reference Reference 47.0–51.5 18.4 0.73 0.61 to 0.87 0.88 0.69 to 1.12 51.5–55.3 12.7 0.47 0.39 to 0.58 0.87 0.66 to 1.15 55.3–59.7 10.6 0.38 0.31 to 0.47 0.81 0.60 to 1.09 59.7–96.0 8.3 0.29 0.24 to 0.37 0.78 0.56 to 1.09 Single-handed practice No 14.6 Reference Reference Yes 15.9 1.11 0.87 to 1.42 1.21 0.87 to 1.70 Urban/rural setting Urban, with major conurbation 24.1 Reference Reference Urban, with minor conurbation 1.3 0.04 0.02 to 0.11 0.12 0.02 to 0.62 Urban, with city and town 10.2 0.36 0.30 to 0.42 0.18 0.10 to 0.35 Urban, with significant rural 9.3 0.32 0.25 to 0.41 0.13 0.06 to 0.26 Largely rural 5.3 0.18 0.13 to 0.25 0.15 0.07 to 0.31 Mainly rural 5.0 0.17 0.11 to 0.24 0.15 0.07 to 0.33 Index of Multiple Deprivation quintile 5 (least deprivation) 12.0 Reference Reference 4 12.5 1.05 0.84 to 1.31 1.04 0.75 to 1.44 3 16.5 1.46 1.18 to 1.80 0.98 0.69 to 1.38 2 16.9 1.49 1.21 to 1.84 0.99 0.67 to 1.46 1 (most deprivation) 15.7 1.37 1.11 to 1.69 1.19 0.77 to 1.84 Quality and Outcomes Framework scorea 14–523 19.0 Reference Reference 523–541 17.3 0.89 0.74 to 1.07 0.89 0.69 to 1.14 541–550 13.8 0.68 0.56 to 0.83 0.77 0.59 to 1.00 550–557 13.1 0.64 0.52 to 0.78 0.80 0.61 to 1.04 557–559 10.0 0.47 0.38 to 0.58 0.65 0.48 to 0.88 Composite OpenPrescribing scorea,b <38.7 15.3 Reference Reference 38.7–43.5 14.5 0.94 0.76 to 1.15 1.26 0.96 to 1.66 43.5–47.8 13.4 0.86 0.70 to 1.05 1.39 1.04 to 1.87 47.8–52.4 13.8 0.89 0.72 to 1.09 1.96 1.44 to 2.67 >52.4 16.4 1.09 0.89 to 1.33 3.28 2.35 to 4.57 Computer system EMIS (Egton Medical Information Systems) 14.1 Reference Reference Evolution 1.7 0.11 0.01 to 0.78 1.57 0.15 to 16.58 SystmOne 13.9 0.98 0.85 to 1.13 0.97 0.70 to 1.34 Vision 29.5 2.56 2.03 to 3.24 1.68 1.07 to 2.65
Supplementary Data
SUPPLEMENTARY DATA
Supplementary material is not copyedited or typeset, and is published as supplied
by the author(s). The author(s) retain(s) responsibility for its accuracy.
Video_10.3399_bjgp20X710993
In this issue


Jump to section
More in this TOC Section
Related Articles
Cited By...

