


Article Figures & Data
Figures
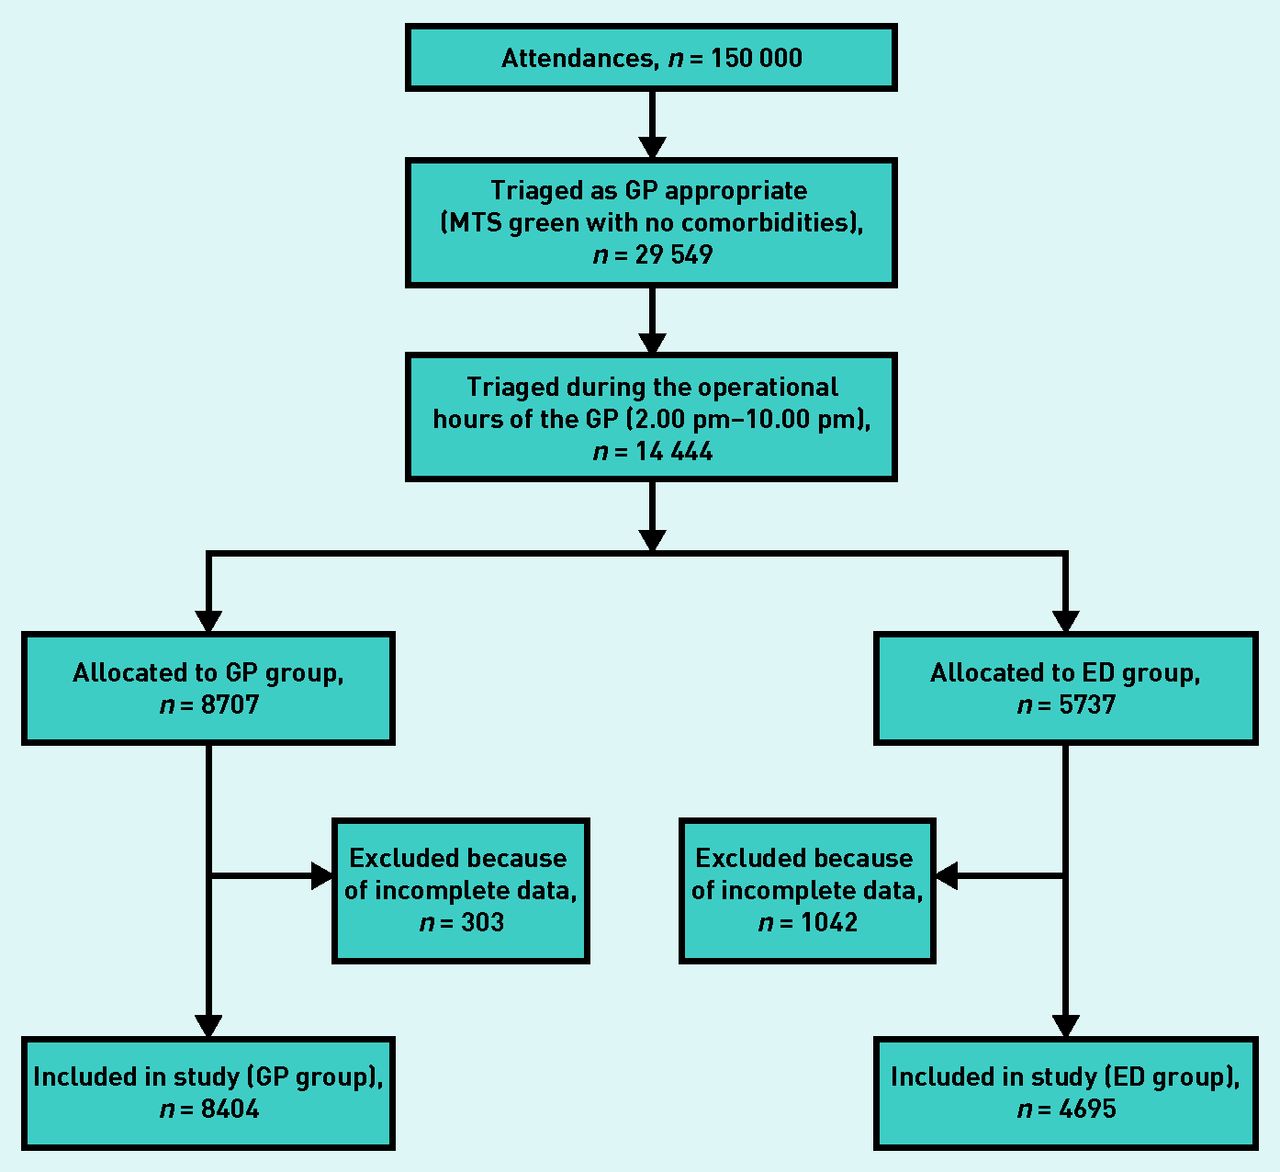
- Figure 1.
Study recruitment process.
ED = emergency department. MTS = Manchester Triage System.
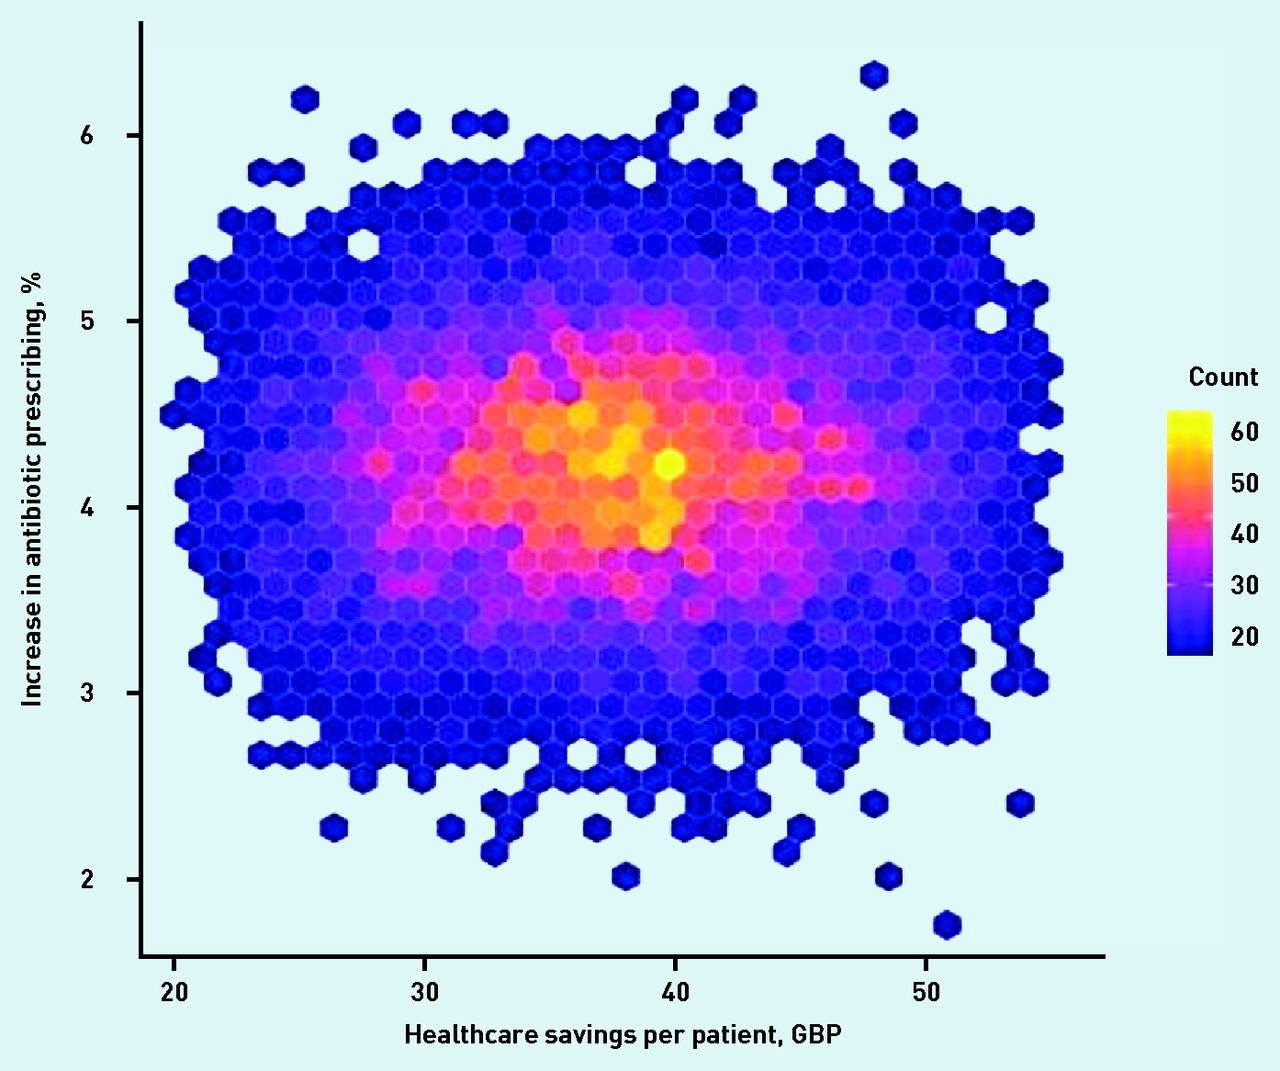
- Figure 2.
Variability in health service savings and antibiotic use following introduction of GP to emergency department.
Count = number of Monte Carlo simulations in which the cross-section of the x - and y -axis occurred. GBP = Great British Pound.
Tables
How this fits in
Many emergency department (ED) attendances are non-urgent, putting pressure on services and increasing caseloads. Having a GP available in the ED to manage non-urgent cases has previously been shown to improve efficiency and patient satisfaction, but it is unclear whether this demonstrates value for money. This large, non-randomised, observational study shows that children seen by the GP in the ED waited less time to be seen, had fewer inpatient admissions, and incurred lower healthcare costs, but experienced higher antibiotic prescribing than those managed by ED teams. As the demand for children’s emergency services is increasing, having a GP present in the ED may have a positive effect on how non-urgent paediatric cases are managed. Further research is, however, required. - Table 1.
Characteristics of patients triaged as ‘GP appropriate’, attending the emergency department
Variable GP group, N = 8404 ED group, N = 4695 Total, N = 13 099 P-value Sex, n (%) 0.206a Male 4268 (50.8) 2541 (54.1) 6809 (52.0) Female 4136 (49.2) 2154 (45.9) 6290 (48.0) Age category, n (%) 0.785a <3 months 613 (7.3) 319 (6.8) 932 (7.1) 3–6 months 538 (6.4) 291 (6.2) 829 (6.3) 7–12 months 1277 (15.2) 714 (15.2) 1991 (15.2) >1–3 years 3177 (37.8) 1779 (37.9) 4956 (37.8) 4–10 years 2017 (24.0) 1174 (25.0) 3191 (24.4) ≥11 years 782 (9.3) 418 (8.9) 1200 (9.2) Age, years, median (IQR) 2.2 (0.90–5.50) 2.15 (0.87–5.50) 2.17 (0.88–5.50) 0.624b Deprivation quintiles, n (%)c 0.656a 1 (least deprived) 208 (2.5) 106 (2.3) 314 (2.4) 2 456 (5.4) 253 (5.4) 709 (5.4) 3 833 (9.9) 504 (10.7) 1337 (10.2) 4 898 (10.7) 528 (11.2) 1426 (10.9) 5 (most deprived) 5378 (64.0) 3058 (65.1) 8436 (64.4) Diagnosis, n (%) n/a Respiratory conditions 2070 (24.6) 1076 (22.9) 3146 (24.0) Gastrointestinal conditions 1410 (16.8) 695 (14.8) 2105 (16.1) Infectious disease 1194 (14.2) 695 (14.8) 1889 (14.4) Diagnosis not classifiable 530 (6.3) 946 (20.1) 1476 (11.3) ENT conditions 679 (8.1) 227 (4.8) 906 (6.9) Local infection 561 (6.7) 305 (6.5) 866 (6.6) Dermatological conditions 302 (3.6) 99 (2.1) 401 (3.1) Urological conditions (including cystitis) 256 (3.0) 128 (2.7) 384 (2.9) Allergy (including anaphylaxis) 263 (3.1) 100 (2.1) 363 (2.8) Head injury 190 (2.3) 45 (1.0) 235 (1.8) Fever 1289 (15.3) 643 (13.7) 1932 (14.7) Pulse, beats/minute, median (IQR) 127 (109–143) 125 (109–140) 126 (109–142) 0.864b Temperature, ºC, median (IQR) 37 (36.6–37.6) 37 (36.6–37.6) 37 (36.6–37.6) 0.767b Oxygen saturation, %, median (IQR) 99 (97–100) 99 (97–100) 99 (97–100) 0.558b Attended ED in last 5 days, n (%) 0.14a Yes 160 (1.9) 103 (2.2) 263 (2.0) No 8244 (98.1) 4592 (97.8) 12 836 (98.0) Attended ED on a weekday, n (%) 0.84a Yes 5824 (69.3) 3301 (70.3) 9125 (69.7) No 2580 (30.7) 1394 (29.7) 3974 (30.3) Attended ED during holiday period, n (%)d 0.134a Yes 2958 (35.2) 1592 (33.9) 4550 (34.7) No 5446 (64.8) 3103 (66.1) 8549 (65.3) ↵a χ2.
↵b Mann–Whitney U test.
↵c Deprivation data were based on postcodes. Many of the children attending the ED either had no postcode on file, incomplete postcodes, or were classed as Travellers, with postcodes that did not link to the Office for National Statistics database. N-values for GP group, ED group, and Total are 7773, 4449, and 12 222, respectively.
↵d Holidays were in line with the English academic year and included half terms, Easter, Christmas, and winter holidays. ED = emergency department. ENT = ear, nose, and throat. IQR = interquartile range.
Discharge status GP group,a n (%) ED group,b n (%) Total,c n (%) Own GP follow-up 2312 (27.5) 287 (6.1) 2599 (19.8) Discharged with no further action 5745 (68.4) 3282 (69.9) 9027 (68.9) Admitted 117 (1.4) 374 (8.0) 491 (3.7) Outpatient 107 (1.3) 103 (2.2) 210 (1.6) ED clinic 3 (<0.1) 59 (1.3) 62 (0.5) Community follow-up 1 (<0.1) 0 (0.0) 1 (<0.1) Left before seen 100 (1.2) 455 (9.7) 555 (4.2) Left following advice 1 (<0.1) 5 (0.1) 6 (<0.1) Left refusing treatment 6 (0.1) 117 (2.5) 123 (0.9) Other 5 (0.1) 13 (0.3) 18 (0.1) N/A 7 (0.1) 0 (0.0) 7 (0.1) Variable Costs, GBP Antibiotics, % 4-hour target, % Inpatient, % GP group ED group All P-value GP group ED group All P-value GP group ED group All P-value GP group ED group All P-value Working diagnosis Fever, n = 1926 93.78 69.76 86.69 <0.001 27.1 16.7 23.5 <0.001 98.5 87.5 94.6 <0.001 1.1 4.5 2.3 <0.001 Infectious disease, n = 1889 92.18 123.29 103.94 <0.001 5.7 5.9 5.7 0.578 98.7 89.1 94.7 <0.001 0.7 9.9 4.4 <0.001 Gastrointestinal, n = 2105 89.49 120.77 104.76 <0.001 0.5 0.6 0.6 0.891 98.8 86.2 94.4 <0.001 1.0 8.6 3.9 <0.001 Respiratory n = 3146 87.52 89.40 88.16 0.897 16.2 10.2 14.3 <0.001 98.9 86.3 94.3 <0.001 0.5 6.5 2.7 <0.001 Local infection, n = 866 92.97 88.26 91.34 0.521 40.3 39.9 40.2 0.978 98.4 86.4 93.9 <0.001 0.7 4.1 2.0 <0.001 ENT, n = 906 86.78 111.90 92.30 <0.001 41.5 35.7 40.1 0.298 97.8 86.8 95.0 <0.001 0.0 2.8 0.7 <0.001 Age <3 months, n = 932 99.49 242.54 152.88 <0.001 5.2 5.6 5.4 0.947 99.2 87.9 95.2 <0.001 1.2 14.3 6.2 <0.001 3–6 months, n = 829 135.55 196.38 162.38 <0.001 8.8 8.2 8.6 0.935 98.5 90.1 95.2 <0.001 2.3 7.1 4.5 <0.001 6–12 months, n = 1991 101.04 95.29 100.60 <0.001 13.1 8.6 11.5 0.012 98.4 89.5 94.4 <0.001 1.6 7.8 4.2 <0.001 1–3 years, n = 4956 99.83 116.47 109.70 <0.001 18.2 11.5 15.7 <0.001 98.6 87.6 94.2 <0.001 1.1 7.1 3.6 <0.001 4–10 years, n = 3191 118.36 130.14 132.08 <0.001 16.8 13.4 15.5 0.037 98.6 89.5 94.6 <0.001 1.4 5.7 3.3 <0.001 ≥1 years, n = 1200 115.39 238.72 157.93 <0.001 13.9 10.4 12.9 0.07 98.5 86.0 93.8 <0.001 1.6 7.7 3.9 <0.001 Deprivation quintile 1 (most deprived), n = 8436 111.56 150.61 126.23 <0.001 15.4 10.3 13.5 <0.001 98.6 87.3 94.3 0.005 1.4 7.8 3.8 <0.001 2, n = 1426 108.43 150.48 124.33 <0.001 16.6 11.5 14.7 0.009 99.4 88.6 95.4 <0.001 1.2 8.9 4.2 0.003 3, n = 1337 94.17 170.70 124.10 <0.001 14.8 11.0 13.3 0.047 98.3 88.8 94.6 <0.001 1.7 7.7 4.0 <0.001 4, n = 709 104.17 92.69 99.98 <0.001 12.7 12.9 12.8 0.921 98.2 88.9 94.8 <0.001 1.5 5.7 3.1 <0.001 5 (least deprived), n = 314 115.55 189.99 141.29 <0.001 14.9 17.3 15.7 0.582 97.6 89.1 94.7 <0.001 1.4 10.9 4.7 <0.001 a Significance determined via Mann–Whitney U test. ED = emergency department. ENT = ear, nose, and throat. GBP = Great British pound.
Supplementary Data
SUPPLEMENTARY DATA
Supplementary material is not copyedited or typeset, and is published as supplied
by the author(s). The author(s) retain(s) responsibility for its accuracy.
In this issue


Jump to section
More in this TOC Section
Related Articles
Cited By...

