


Article Figures & Data
Figures
- Figure 1.
Patient experience with making an appointment.
FTE = full-time equivalent.
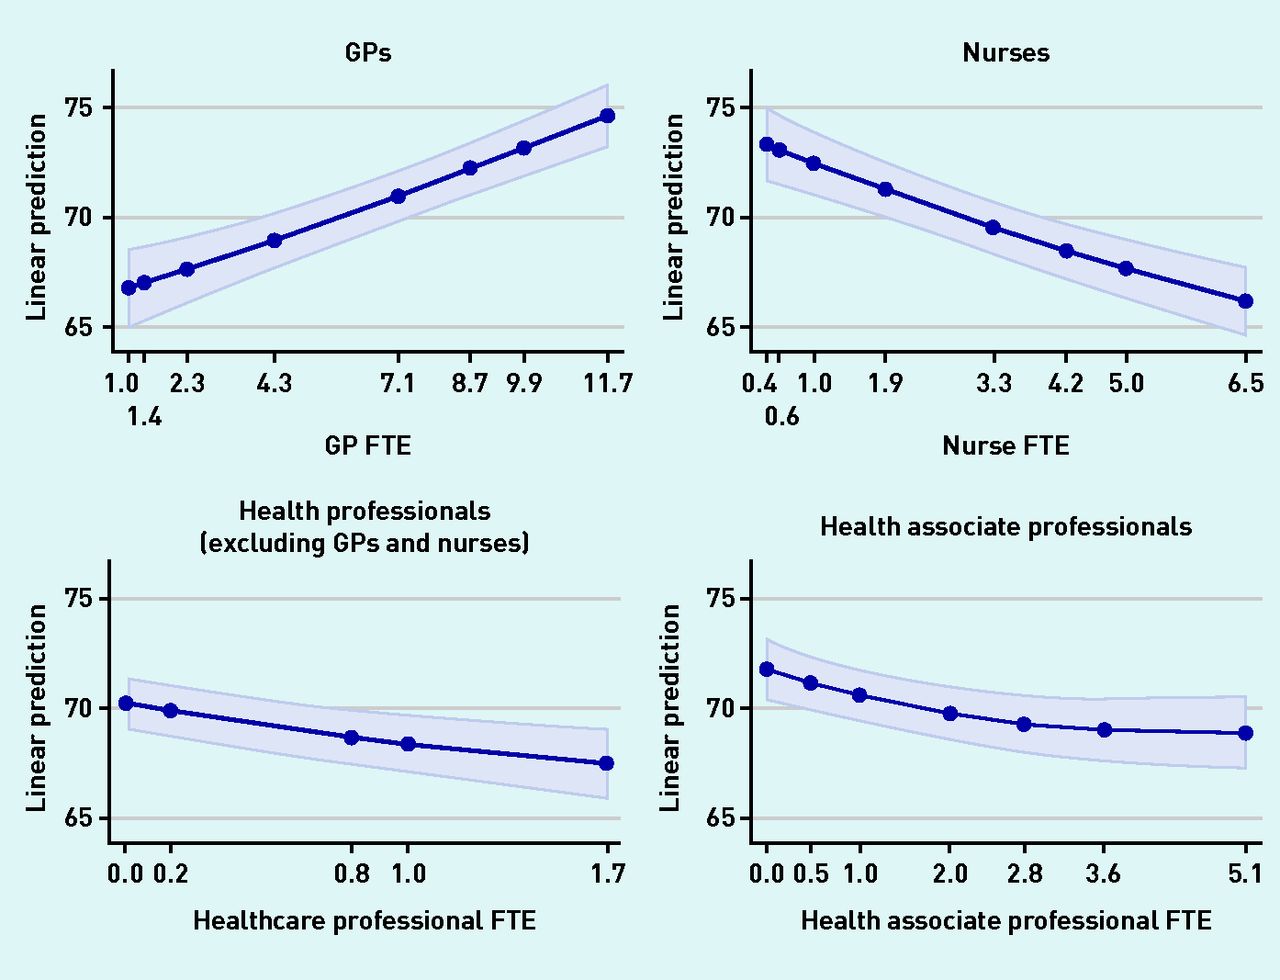
- Figure 2.
Overall patient experience of practice.
FTE = full-time equivalent.


Tables
How this fits in
The increasing number of staff from diverse healthcare backgrounds is changing the general practice workforce in England. These changes provide a new opportunity to investigate whether, and how, workforce composition may be associated with outcomes. This analysis indicated that professional, population, and system outcomes show a variety of associations with primary care workforce composition. The findings demonstrated that different types of health professionals are not substitutes for each other, and the quantity and quality of primary care services delivered will depend on who is employed to work in this setting. WHO classification NHS roles used in General Practice Workforce statistics GPs Partners Salaried GPs Locum GPs Registrar GPs, Foundation 1–2, Specialty 1–4 Retainer GPs Nurses Practice nurses Advanced and specialist nurses Trainee nurses Healthcare professionals Pharmacists Physiotherapists Physician associates Paramedics Podiatrists Counsellors Occupational and other therapists Other allied health professionals Healthcare associate professionals Dispensers Healthcare assistants Nurse associates Pharmacy technicians Psychological wellbeing practitioners Social prescribing link workers Apprentices (therapists, pharmacists, physiotherapists, and others) WHO = World Health Organization.
Staff group Mean SD Percentilea 5 10 25 50 75 85 90 95 GPs 5.14 3.76 1.00 1.37 2.34 4.29 7.06 8.66 9.88 11.73 Nurses 2.50 2.33 0.40 0.56 1.00 1.91 3.26 4.19 4.96 6.47 Healthcare professionals 0.30 0.77 0.00 0.00 0.00 0.00 0.16 0.80 1.00 1.71 Health associate professionals 1.57 1.94 0.00 0.00 0.48 1.00 1.97 2.77 3.23 5.15 ↵a Percentiles show the distribution of staff FTE in the core sample. Percentile values are the same used in the plots included in Supplementary Appendix S5. FTE = full-time equivalent. SD = standard deviation.
- Table 3.
Associations between staff type and population, professional, and system outcomesa
Outcome n Mean (SD) Estimated effects of one additional FTE on z-score transformation of outcome GPs (95% CI) Nurses (95% CI) Health professionals (95% CI) Health associate professionals (95% CI) Practice activity Months since last GP appointment 6210 5.451 (0.660) −0.043 (−0.057 to −0.028) 0.105 (0.077 to 0.134) 0.128 (0.042 to 0.215) 0.016 (−0.019 to 0.050) Months since last nurse appointment 6210 8.139 (1.237) 0.047 (0.034 to 0.060) −0.145 (−0.171 to −0.120) −0.001 (−0.071 to 0.069) −0.141 (−0.172 to −0.109) GP working conditions Average hours worked per week by GPs 1195 41.019 (14.458) −0.021 (−0.048 to 0.005) 0.047 (−0.014 to 0.108) 0.060 (−0.133 to 0.254) 0.010 (−0.055 to 0.074) Percentage of GP work that could be delegated 1171 26.893 (17.649) −0.037 (−0.064 to −0.011) 0.086 (0.026 to 0.145) 0.217 (0.016 to 0.417) 0.032 (−0.035 to 0.099) GP job satisfaction 1270 4.428 (1.534) 0.052 (0.025 to 0.080) 0.007 (−0.052 to 0.066) 0.112 (−0.085 to 0.310) −0.068 (−0.135 to −0.002) Quality of care Percentage of QOF points achieved 6210 96.744 (5.596) 0.058 (0.036 to 0.079) 0.007 (−0.020 to 0.033) 0.054 (−0.039 to 0.147) 0.012 (−0.026 to 0.050) Patient experience with making an appointment 6210 67.451 (14.349) 0.052 (0.038 to 0.066) −0.086 (−0.113 to −0.059) −0.157 (−0.243 to −0.071) −0.060 (−0.092 to −0.028) Overall patient experience of practice 6210 83.116 (9.635) 0.080 (0.066 to 0.094) −0.068 (−0.095 to −0.042) −0.200 (−0.294 to −0.106) −0.066 (−0.099 to −0.034) Prescribing activity Items prescribed per thousand patients 6210 19 021.060 (6298.436) −0.009 (−0.020 to 0.002) 0.050 (0.033 to 0.067) −0.062 (−0.138 to 0.013) 0.026 (0.004 to 0.047) Cost per item prescribed in £ 6210 7.478 (1.295) 0.021 (0.011 to 0.032) −0.034 (−0.055 to −0.012) 0.030 (−0.032 to 0.092) −0.046 (−0.074 to −0.018) Percentage of narrow-spectrum to total antibiotics 6210 95.913 (1.538) −0.018 (−0.030 to −0.007) −0.015 (−0.039 to 0.009) 0.093 (0.021 to 0.164) 0.017 (−0.017 to 0.050) Hospital activity ED attendances per thousand patients 6210 238.472 (79.267) 0.024 (0.013 to 0.035) 0.020 (−0.001 to 0.041) 0.029 (−0.033 to 0.092) 0.023 (−0.005 to 0.051) Outpatient attendances per thousand patients 6210 1471.976 (446.682) 0.038 (0.027 to 0.050) 0.009 (−0.014 to 0.032) 0.084 (0.015 to 0.153) −0.040 (−0.069 to −0.010) Elective admissions per thousand patients 6210 156.607 (52.245) 0.032 (0.020 to 0.044) 0.038 (0.017 to 0.059) 0.019 (−0.051 to 0.089) −0.022 (−0.050 to 0.005) Emergency admissions per thousand patients 6210 90.386 (26.908) 0.041 (0.030 to 0.053) 0.055 (0.033 to 0.076) 0.075 (0.012 to 0.137) −0.029 (−0.057 to −0.002) ↵a Outcome mean and regressions are weighted by the outcome denominator (see Supplementary Appendix S2 for details). Full results from OLS regression model used to derive marginal effects are included in Supplementary Appendix S3. Margin plots showing the effects graphically for a range of staffing percentiles are included in Supplementary Appendix S5. The results of sensitivity checks are available in Supplementary Appendix S6. Full diagnostic indicators for all regression models are in Supplementary Appendix S7. ED = emergency department. FTE = full-time equivalent. OLS = Ordinary Least Squares. QOF = Quality and Outcomes Framework. SD = standard deviation.
Annual practice costs Mean cost, £’000 (SD) Estimated effects of one additional FTE on costs GPs, £’000 (95% CI) Nurses, £’000 (95% CI) Health professionals, £’000 (95% CI) Health associate professionals, £’000 (95% CI) Total 7950 (4808) 362 (326 to 398) 512 (446 to 579) 182 (−33 to 396) 256 (195 to 318) NHS payments to practice 1265 (805) 49 (44 to 55) 86 (75 to 96) 41 (5 to 77) 72 (61 to 84) Prescriptions 1261 (850) 50 (44 to 56) 78 (67 to 89) −8 (−58 to 42) 41 (31 to 50) ED attendances 361 (232) 15 (13 to 17) 20 (16 to 24) 9 (−2 to 19) 13 (10 to 18) Emergency admissions 1390 (893) 71 (64 to 78) 100 (85 to 114) 46 (4 to 88) 41 (27 to 54) Elective admissions 1927 (1263) 93 (82 to 105) 128 (108 to 148) 37 (−22 to 95) 45 (25 to 66) Outpatient attendances 1746 (1122) 85 (76 to 94) 97 (79 to 115) 60 (10 to 111) 36 (18 to 53) ↵a Full results for generalised linear regression models used to derive the marginal effects of different staff groups are included in Supplementary Appendix S3. Margin plots showing the effects graphically for a range of staffing percentiles are included in Supplementary Appendix S5. The results of sensitivity checks are shown in Supplementary Appendix S6. Full diagnostic indicators for all regression models are in Supplementary Appendix S7. ED = emergency department. FTE = full-time equivalent. SD = standard deviation.
Supplementary Data
Supplementary material is not copyedited or typeset, and is published as supplied by the author(s). The author(s) retain(s) responsibility for its accuracy.
PODCAST
In this issue


Jump to section
More in this TOC Section
Related Articles
Cited By...

