


Abstract
Background The Quality and Outcomes Framework has generated reputational as well as financial rewards for general practices because the number of quality points a practice receives is publicly reported. These rewards vary across diseases and practices, and over time.
Aim To determine the relative effects on performance of the financial and reputational rewards resulting from a pay-for-performance programme.
Design and setting Observational study of the published performance on 42 indicators of 8929 practices in England between 2004 and 2013.
Method The authors calculated the revenue offered (financial reward, measured in £100s) and the points offered (reputational reward) per additional patient treated for each indicator for each practice in each year. Fixed-effects multivariable regression models were used to estimate whether the percentage of eligible patients treated responded to changes in these financial and reputational rewards.
Results Both the offered financial rewards and reputational rewards had small but statistically significant associations with practice performance. The effect of the financial reward on performance decreased from 0.797 percentage points per £100 (95% confidence interval [CI] = 0.614 to 0.979) in 2004, to 0.092 (95% CI = 0.045 to 0.138) in 2013. The effect of the reputational reward increased from −0.121 percentage points per quality point (95% CI = −0.220 to −0.022) in 2004, to 0.209 (95% CI = 0.147 to 0.271) in 2013.
Conclusion In the short term, general practices were more sensitive to revenue than reputational rewards. In the long term, general practices appeared to divert their focus towards the reputational reward, once benchmarks of performance became established.
INTRODUCTION
Reputational and financial incentives are often combined in initiatives to improve quality of care. Provider reputation captures how the provider is viewed by the public and other providers, whereas financial incentives reward providers with additional income for achieving defined goals. Both forms can influence quality and performance, and both have an external component creating an extrinsic incentive.1–5 Pay-for-performance is a widely used form of financial reward that involves paying providers based on the quality of care they provide.6,7 The effect of these financial rewards is difficult to separate from the reputational rewards associated with improving performance on a publicly reported quality measure.1,8,9 Because reputational rewards do not require a financial component, they have the potential to offer an affordable means to improve quality.
The Quality and Outcomes Framework (QOF), introduced in the UK NHS in 2004, is one of the largest pay-for-performance schemes in the world,10–15 and led to a 25% increase in GP income within the first year.16 Annual expenditure was approximately £1 billion during the earlier years of its implementation, but has fallen since 2013.17,18 The scheme contains both financial and reputational rewards to improve practice performance.14 Reputational rewards have been less studied than financial rewards; therefore their relative contributions to improving performance are not known, but have important implications for the design of future schemes.1,6–8,15
Under the QOF, general practices are rewarded financially based on their performance on a range of quality indicators. In addition, a summarised quality score, points for each practice, is published online,19 becoming a form of publicly reported performance. This generates a reputational incentive, as a practice wishing to signal its reputation can do so by exerting effort to acquire more points.2 Acquiring extra points may bolster a practice’s reputation with other practices, third-party payers, and patients, as all three groups can use this information to compare performance. Specifically, points have been shown to affect patients’ choice of practice.20
The amount of income earned by practices under the QOF is a product of points (the reputational marker) and additional adjustments reflecting disease prevalence rates and the size of the registered population.21 Therefore, revenue is based on the expected workload required to treat the eligible patients, and not on the absolute number of patients treated. This nonproportional relationship between points and revenue resulted in certain activities yielding a greater reputational reward and others a greater financial reward. Several changes to the programme have affected the points awarded for different activities and the amounts paid for these activities. This provides an opportunity to distinguish reputational from financial rewards, and to estimate their separate effects on performance over time.
How this fits in
Pay-for-performance is a financial incentive used to improve quality of care, and is often combined with the reputational incentive of the public reporting of performance. The relative impacts of these two forms of incentive on performance are difficult to disentangle. The authors found that both financial and reputational incentives are important predictors of provider performance. Over time, performance becomes more sensitive to reputational incentives, and less sensitive to financial incentives. Using reputational incentives may be a less costly means to improve quality of care.
The authors used multivariable fixedeffect regressions and exploited changes in revenue and points offered per patient treated to establish the relative importance of financial versus reputational rewards in influencing performance over time.
METHOD
The Quality and Outcomes Framework
The QOF rewards UK GPs on a range of clinical, administrative, and outcome indicators. The largest element is the clinical domain, which rewards practices for the quality of care provided to patients with chronic conditions.10 Points are awarded for the percentage of patients achieving the indicators between the lower and upper thresholds of performance,22 with rewards for absolute, not relative, performance. It is measured at practice level, and nurses or other practitioners can perform the incentivised activities.
Data
Data were obtained from the Health and Social Care Information Centre website for 9 years, starting with the financial year 1 April 2004 to 31 March 2005 and finishing with the financial year 1 April 2012 to 31 March 2013.23 The data included indicator-level performance for all practices in England since the start of the scheme. Performance was measured as the percentage of eligible patients who received treatment for each indicator; specifically, the number of patients treated from the disease register for that indicator, having first removed patients not meeting the eligibility criteria. This often related to age or comorbidities. Revenue was calculated using data on the registered population and disease prevalence rates for each practice, the maximum points allocated to each indicator, the lower and upper thresholds for each indicator, and the monetary value of a point.24–27
The number of patients registered with each practice in each year was obtained from the Health and Social Care Information Centre. The Index of Multiple Deprivation (IMD) was used to measure the socioeconomic deprivation of the registered population in 3 years (2004, 2007, and 2010).28,29 This index, which summarises seven aspects of deprivation, was applied to the other years on the following basis: the 2004 value for 2004–2005 and 2005–2006; the 2007 value for 2006–2007, 2007–2008, and 2008–2009; and the 2010 value for 2009–2010, 2010–2011, 2011–2012, and 2012–2013. Deprivation was included to control for population characteristics that could influence practice performance.
The unit of analysis was the practice–indicator combination. Indicators were added and removed from the pay-for-performance programme over the period. The authors’ analysis focused on the 42 indicators that appeared in all 9 years. There was a total of 8929 practices, 8345 on average per year, and 7686 appearing in all years. The total number of practice–year–indicator observations in the dataset was 3 032 176.
Measurement of rewards
The authors measured the magnitude of the rewards offered by the QOF as the points and the revenue (in £100s) that would be awarded for each additional patient treated between the lower and upper thresholds. These two measures reflect the rewards that are offered, not the rewards that were obtained based on the practice’s actual performance.
The workload required to treat a given percentage of patients depends on the size of the practice’s registered population and the disease prevalence rate. To account for this variation in workload, the QOF included adjustments that increased the value of a point for practices with large registered populations and/or high disease prevalence rates: the contractor population index (CPI) and the adjusted disease prevalence factor (ADPF).21 Table 1 presents a realistic example of how these adjustments impact on the revenue that was offered. The example was influenced by real practices for which the reputational rewards on offer were identical, but the financial rewards differed due to the adjustment factors. The first adjustment, the CPI, favours the larger practice and increases revenue by a factor of 3.5, compared with a factor of 0.8 for the smaller practice. The second adjustment, the ADPF, favours the practice with higher prevalence rates, in this case the smaller practice, and increases revenue by a factor of 1.5, compared with a factor of 0.6 for the larger practice. When combined, these adjustments result in the larger practice being offered £8820 if maximum points are achieved, whereas the smaller practice is offered £5040. Note that the same number of patients required treatment in each practice. The financial and reputational rewards offered for each additional patient treated between the lower and upper thresholds are shown in Table 1. Reputational rewards do not differ between these practices but the larger practice is offered almost twice the financial reward.
Comparison of rewards offered to two different practices in 2004
The variation shown in Table 1 illustrates the differences exploited by the authors’ analysis. Additional variation results from changes made to the maximum points available, the lower and upper thresholds, and the design of the ADPF in later years (further information available from the author on request).
Figures 1 and 2 provide further evidence on how the offered rewards varied by practice and indicator. The y-axis measures the reputational and financial rewards offered per patient treated, and the bars indicate the median and the interquartile range. Figure 1 shows the rewards for two indicators, diabetes and mental health. The reputational and financial rewards on offer vary over time, but also between indicators. Figure 2 shows the rewards for two different practices, one with a large population and high disease prevalence, and one with a small population and low disease prevalence. The offered financial rewards per patient treated are similar, despite the significant difference in population size and disease prevalence rate. However, the reputational rewards offered per patient treated are much lower in the large practice.
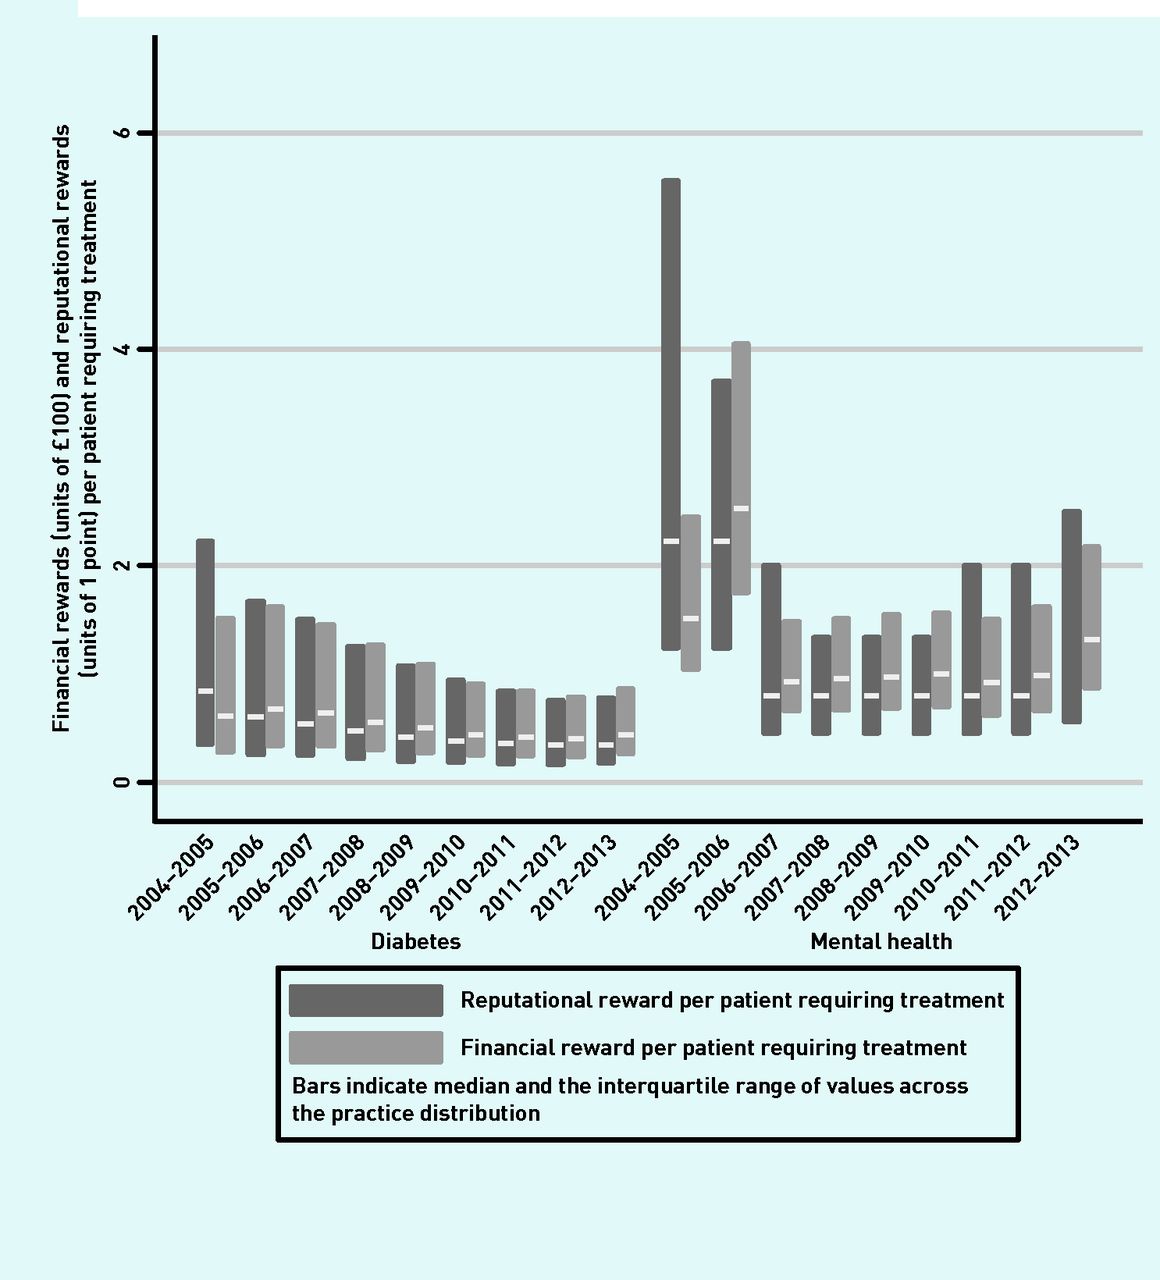
Variations across indicators and over time in the financial and reputational rewards offered per patient treated for two indicators. Diabetes indicator: patients with a diagnosis of proteinuria or microalbuminuria who are treated with angiotensinconverting enzyme inhibitors. Mental health indicator: patients on lithium therapy with a record of lithium levels.

Variations across practices and over time in the financial and reputational rewards offered per patient treated for two practices.
Statistical analysis
The authors estimated a fixed-effects linear regression in which the dependent variable was the percentage of eligible patients for whom each practice achieved the indicator for each of the 42 indicators. The financial and reputational rewards for each indicator were independent variables capturing the different rewards offered to the practice. The authors controlled for the size of the registered population, the number of registered persons per GP, and local area deprivation.30 They included fixed effects for each practice–indicator combination to allow practices to vary in their ability to perform at indicator level, thus controlling for unmeasured potential confounders such as practice expertise. A Hausman test31 strongly favoured the fixedeffects specification over random-effects. Nonetheless, both models produced similar results.
The authors first estimated the effects of the financial and reputational rewards pooled over all 9 years. They then examined whether the responses to the rewards varied over time by interacting each reward variable with year.
The Pearson’s correlation between the reward variables was 0.64. The variance inflation factor in the regression model was 1.69, well below the value that indicates a problematic correlation.32 All analyses were conducted using Stata (version 14).
RESULTS
Descriptive statistics for practices and the incentive scheme are provided in Tables 2 and 3. The average percentage of patients treated across all practices and indicators was 89%. By design, the ADPF had a mean value of 1 in each year and is not shown. The CPI had a mean value slightly >1, because the average size of the registered population increased over time compared with the reference value taken in 2003–2004. The value of a point increased from £75 to £133.76 over the 9-year period. The largest change was between the first 2 years, with minor changes thereafter.
Descriptive statistics for practice characteristicsa
Descriptive statistics for the incentive schemea
Pooled across all 9 years, a 1-point increase in the reputational reward offered for treating an additional patient was associated with a 0.184% (95% confidence interval [CI] = 0.149 to 0.219) increase in patients treated (Table 4). A £100 increase in the financial reward offered for treating an additional patient was associated with a 0.214% (95% CI = 0.181 to 0.246) increase in patients treated. The effect sizes for reputational and financial rewards are similar in magnitude, but both are small. However, across all English practices and the whole population of England, the associations are not negligible. A worked example across all English practices suggests that a 1-point increase in the reputational reward per patient increases the number of patients treated by 2732 for an average indicator. This figure is calculated as 153 (the average number of patients in the target population from Table 3) multiplied by 0.214% (effect size from Table 4), multiplied by 8345 (average number of practices). The corresponding increase in the number of patients treated for a one unit (£100) increase in the financial reward per patients is 2349.
Fixed-effects regressions of the effects of the reputational and financial rewards offered on practice performancea
In 2004–2005, the associations with the percentage of patients treated were −0.121 (95% CI = −0.220 to −0.022) and 0.797 (95% CI = 0.614 to 0.979) for the offered reputational and financial rewards, respectively (Table 4). Over time, the association with the percentage of patients treated increased for the offered reputational reward, but decreased for the offered financial reward. By 2012–2013, the associations were 0.209 (95% CI = 0.147 to 0.271) for the offered reputational rewards, and 0.092 (95% CI = 0.045 to 0.138) for the offered financial rewards. Figure 3 plots the coefficients from Table 4 to further demonstrate this changing relationship.

Estimated impact on percentage of patients treated (with 95% confidence intervals) associated with one-unit changes in financial and reputational rewards offered by year. Y-axis measures the size of the coefficient on the respective reward. Each reward was interacted with a categorical year variable to allow the effect to differ in each of the 9 years observed. Regression included control variables for year, registered population of the practice, physicians per 1000 registered patient, and local area deprivation.
DISCUSSION
Summary
Across the first 9 years of the UK’s pay-for-performance programme for general practices, the reputational rewards and financial rewards were both statistically significant predictors of practice performance. However, the reputational rewards that were offered became more important over time, and financial rewards became less important. These findings suggest that reputational consequences were not a major concern in the early years of the QOF. This was possibly due to an absence of a visible benchmark on which to base assessments of relative performance. In later years, performance norms were established, and the reputational reward became more relevant. When increasing reputation became more important, GPs may have diverted their efforts away from the activities that generated the most revenue.
Strengths and limitations
The authors’ analysis distinguished the effects of reputational and financial rewards of pay-for-performance. They took advantage of a dataset covering almost the entire population of English practices for 9 years of an ambitious and unique pay-for-performance scheme. The size and structure of the data permitted a very flexible allowance for unmeasured factors that affected the performance of each practice on each quality indicator. However, there are four limitations to the analysis. First, the authors have assumed that GPs knew, or could approximate, the financial and reputational rewards to their performance. IT systems introduced with the QOF allowed practices to receive updates on how they were performing across different indicators.33 These ensured that practices were aware of the reputational rewards for treating individual patients, but could only approximate the financial rewards based on whether their mean prevalence rates were expected to lie above or below national mean rates. Second, although financial and reputational aspects of the QOF are separable, there is a weak indirect effect of the reputational incentive on income, because attracting more patients brings more capitation income. Third, previous research has shown that practices were able to influence prevalence rates, which would suggest that the ADPF was not entirely external to practice behaviour.34 However, as the degree to which practices acted in this way was small, the authors believe this is a limited potential source of bias. Fourth, although the creation of performance norms is likely to have motivated the increased attention paid by GPs to the reputational rewards in later years, it is also possible that public criticism of the size of the financial incentives might explain the pattern of results over time. This criticism focused on the overall size of the financial incentives and not the allocation to specific indicators and practices, which the authors exploit. Changes to the ADPF may have also impacted on the relationship between financial and reputational rewards. These changes were symmetrical, increasing rewards for some practices while decreasing rewards for others, and occurred in 2009–2010, after the impact of financial incentives decreased.
Comparison with existing literature
The combined use of financial and reputational rewards is common in health care.35–37 There is little empirical evidence to show how GPs are affected by reputational incentives,8,14 and it has not been established how the effects of financial and reputational rewards change over time. Previous literature has assumed that the QOF is a financial incentive, but adjustments to practice payments for the size of the registered population and disease prevalence rates created differential financial and reputational rewards for performance. The authors found that the scheme also has a significant reputational component, which has been under-studied.
Implications for research and practice
Policies such as the QOF tend to focus on the financial elements in order to motivate changes in behaviour and performance. The authors’ research shows that the effects of reputational rewards can be similar in magnitude to financial ones. If reputational rewards can be induced at much lower costs, efforts to make the reputational elements stronger could be effective. Reputational rewards require an initial investment in the means to measure and report performance, but they do not require regular and frequent payments. However, some financial element may still be required to compensate practices for the costs, initial and ongoing, of recording and reporting of quality. The benchmarking of a practice’s performance against their peers seems to be an important component of the reputational reward. In the early years, reputation may have mattered less due to the absence of a benchmark of performance. This may suggest that practices take the performance of their peers as an indication of what their own performance should be. Further qualitative studies could provide additional insight into these mechanisms. Although the QOF may be withdrawn in England, it has provided valuable lessons, and the key suggestion from this study is that existing or future pay-for-performance policies should consider encouraging and facilitating comparisons between practices.
Notes
Funding
Thomas Allen received funding from a University of Manchester PhD studentship. The funder had no other role in the research or publication.
Ethical approval
Not applicable.
Provenance
Freely submitted; externally peer reviewed.
Competing interests
The authors have declared no competing interests.
Discuss this article
Contribute and read comments about this article: bjgp.org/letters
- Received April 9, 2018.
- Revision requested June 2, 2018.
- Accepted July 25, 2018.
- © British Journal of General Practice 2018
REFERENCES
In this issue


Jump to section
Keywords
More in this TOC Section
Related Articles
Cited By...

