


Article Figures & Data
Figures
- Figure 1.
Funnel plot of proportion of patients following the NICE-recommended pathway within 6 months of initial HF symptom by number of HF patients per practice. Number of outliers (per cent of a total of 349 practices): above upper 3SD = 8 (2%); between upper 2SD and 3SD = 31 (9%); between lower 2SD and 3SD = 6 (2%); and below lower 3SD = 0 (0%).
HF = heart failure. NICE = National Institute for Health and Care Excellence.
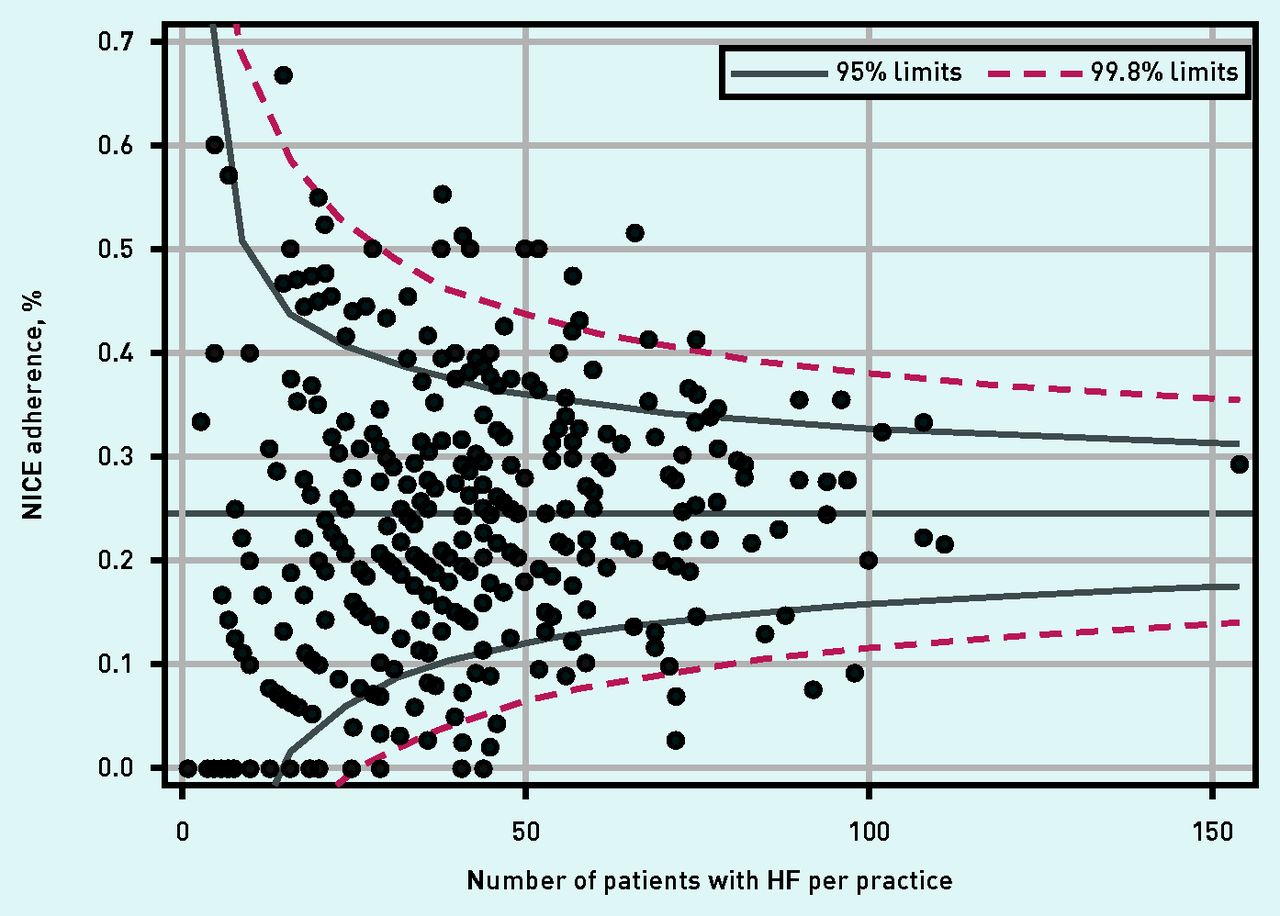
- Figure 2.
Funnel plot of proportion of patients following the NICE-recommended pathway within 5 years of initial HF symptom by number of HF patients per practice. Number of outliers (per cent of total 349 practices): above upper 3SD = 14 (4%); between upper 2SD and 3SD = 48 (14%); between lower 2SD and 3SD = 29 (8%); and below lower 3SD = 13 (4%).
HF = heart failure. NICE = National Institute for Health and Care Excellence.


Tables
How this fits in
Diagnosis of heart failure (HF) in primary care remains challenging despite evidence-based guidelines supporting its identification in this setting. This study identifies specific patient characteristics associated with adherence to guidance on HF diagnosis and management, and illustrates variation between GP practices. Further research is needed to clarify the reasons behind these associations and for variation between practices. There is a continued need to support primary care in the early identification and management of HF. - Table 1.
Management pathway taken within 6 months or 5 years of initial symptom, N = 13 897
Pathway Within 6 months of symptom, n (%) Within 5 years of symptom, n (%) 1 NICE guidelines (echo/NP and referral) 976 (7.0) 3409 (24.5) 2 Guidance partially followed (echo/NP or referral) 2589 (18.6) 4657 (33.5) 3 Treatment only (HF medications but no echo/NP or referral) 5117 (36.8) 3938 (28.3) 4 No NICE-recommended care (no echo/NP, referral, or HF medications) 5215 (37.5) 1893 (13.6) Echo = echocardiography. HF = heart failure. NICE = National Institute of Health and Care Excellence.
NP = natriuretic peptide testing.
Practice-level summary statistics Median (IQR) Minimum–maximum Patients with HF per practice, n 37 (21–53) 1–154 Patients on NICE within 6 months of symptom, % 6 (2–11) 0–40 Patients on NICE within 5 years of symptom, % 22 (13–32) 0–67 HF = heart failure. IQR = interquartile range. NICE = National Institute of Health and Care Excellence.
- Table 3.
Patient characteristics at symptom and frequency distribution of management pathway taken within 6 months of initial HF symptom by these characteristics, N = 13 897
Variable n (%) Pathway 1. NICE guidelines (echo/NP and referral), n (%) 2. Guidance partially followed (echo/NP or referral), n (%) 3. Treatment only (HF medications but no echo/NP or referral), n (%) 4. No recommended care (no echo/NP, referral, or HF medications), n (%) Sex Male 6672 (48.0) 535 (8.0)a 1315 (19.7)a 2416 (36.2) 2406 (36.1)a Female 7225 (52.0) 441 (6.1)a 1274 (17.6)a 2701 (37.4) 2809 (38.9)a Age group at symptom, years <45 234 (1.7) 17 (7.3) 32 (13.7) 43 (18.4)a 142 (60.7)a 45–64 2052 (14.8) 156 (7.6) 403 (19.6) 651 (31.7)a 842 (41.0)a 65–74 3422 (24.6) 278 (8.1)a 628 (18.4) 1284 (37.5) 1232 (36.0)a 75–84 5401 (38.9) 375 (6.9) 1032 (19.1) 2107 (39.0)a 1887 (34.9)a ≥85 2788 (20.1) 150 (5.4)a 494 (17.7) 1032 (37.0) 1112 (39.9)a IMD quintile 1 (least deprived) 2731 (19.7) 221 (8.1)a 557 (20.4)a 994 (36.4) 959 (35.1)a 2 3233 (23.3) 257 (7.9)a 631 (19.5) 1189 (36.8) 1156 (35.8)a 3 (average) 2931 (21.1) 206 (7.0) 525 (17.9) 1062 (36.2) 1138 (38.8) 4 2631 (18.9) 170 (6.5) 466 (17.7) 986 (37.5) 1009 (38.4) 5 (most deprived) 2371 (17.1) 122 (5.1)a 410 (17.3) 886 (37.4) 953 (40.2)a Diagnosis source Primary care 3388 (24.4) 469 (13.8)a 868 (25.6)a 1141 (33.7)a 910 (26.9)a Hospital 10 509 (75.6) 507 (4.8)a 1721 (16.4)a 3976 (37.8)a 4305 (41.0)a Number of comorbidities at symptom 0 2252 (16.2) 185 (8.2)a 369 (16.4)a 366 (16.3)a 1332 (59.1)a 1 3561 (25.6) 244 (6.9) 572 (16.1)a 1083 (30.4)a 1662 (46.7)a 2 3419 (24.6) 226 (6.6) 665 (19.5) 1411 (41.3)a 1117 (32.7)a 3 2452 (17.6) 174 (7.1) 491 (20.0) 1141 (46.5)a 646 (26.3)a ≥4 2213 (15.9) 147 (6.6) 492 (22.2)a 1116 (50.4)a 458 (20.7)a History of AMI Yes 667 (4.8) 51 (7.6) 165 (24.7)a 360 (54.0)a 91 (13.6)a No 13 230 (95.2) 925 (7.0) 2424 (18.3)a 4757 (36.0)a 5124 (38.7)a History of chronic pulmonary disease Yes 3685 (26.5) 134 (3.6)a 494 (13.4)a 1384 (37.6) 1673 (45.4)a No 10 212 (73.5) 842 (8.2)a 2095 (20.5)a 3733 (36.6) 3542 (34.7)a Symptom type Breathlessness only 9096 (65.5) 797 (8.8)a 1907 (21.0)a 3115 (34.2)a 3277 (36.0)a Ankle swelling only 2251 (16.2) 90 (4.0)a 356 (15.8)a 960 (42.6)a 845 (37.5) Fatigue only 2355 (16.9) 76 (3.2)a 305 (13.0)a 972 (41.3)a 1002 (42.5)a ≥2 symptoms 195 (1.4) 13 (6.7) 21 (10.8)a 70 (35.9) 91 (46.7)a Consultation for symptom Yes 3793 (27.3) 407 (10.7)a 909 (24.0)a 1303 (34.4)a 1174 (31.0)a No 10 104 (72.7) 569 (5.6)a 1680 (16.6)a 3814 (37.7)a 4041 (40.0)a ↵a Significant adjusted standardised residuals. All χ2 tests significant at P<0.001. AMI = acute myocardial infarction. Echo = echocardiography. HF = heart failure. IMD = Index of Multiple Deprivation. NICE = National Institute for Health and Care Excellence. NP = natriuretic peptide testing.
- Table 4.
Odds ratios (95% CI) from adjusted logistic regression and adjusted two-level model for predicting adherence to the NICE-recommended pathway within 6 months of initial HF symptoma
Variable Adjusted logistic regression Adjusted two-level logistic regression OR (95% CI) P-value OR (95% CI) P-value Sex Male versus female 1.12 (0.97 to 1.28) 0.118 1.10 (0.96 to 1.27) 0.166 Age group, years 0.003 0.001 <45 versus ≥85 1.86 (1.09 to 3.20) 0.024 1.97 (1.13 to 3.42) 0.016 45–64 versus ≥85 1.47 (1.15 to 1.88) 0.002 1.50 (1.17 to 1.93) 0.002 65–74 versus ≥85 1.41 (1.14 to 1.75) 0.002 1.48 (1.19 to 1.84) 0.001 75–84 versus ≥85 1.18 (0.96 to 1.44) 0.107 1.20 (0.98 to 1.47) 0.081 IMD quintile 0.001 0.007 1 (least) versus 5 (most) 1.60 (1.26 to 2.03) <0.001 1.58 (1.22 to 2.05) 0.001 2 versus 5 1.52 (1.21 to 1.92) <0.001 1.49 (1.16 to 1.91) 0.002 3 versus 5 1.34 (1.06 to 1.70) 0.015 1.34 (1.04 to 1.73) 0.024 4 versus 5 1.26 (0.99 to 1.61) 0.063 1.23 (0.95 to 1.60) 0.117 Diagnosis source Primary care versus hospital 2.75 (2.40 to 3.15) <0.001 2.82 (2.45 to 3.25) <0.001 Number of comorbidities per 1 unit increase 1.07 (1.02 to 1.13) 0.007 1.08 (1.02 to 1.13) 0.005 History of AMI Yes versus no 0.90 (0.65 to 1.25) 0.538 0.91 (0.66 to 1.27) 0.585 History of chronic pulmonary disease Yes versus no 0.37 (0.31 to 0.46) <0.001 0.36 (0.30 to 0.45) <0.001 Symptom type <0.001 <0.001 Breathlessness only versus fatigue only 2.95 (2.31 to 3.76) <0.001 3.07 (2.40 to 3.93) <0.001 Ankle swelling only versus fatigue only 1.31 (0.95 to 1.79) 0.094 1.30 (0.95 to 1.79) 0.106 ≥2 symptoms versus fatigue only 2.08 (1.12 to 3.86) 0.020 2.47 (1.28 to 4.73) 0.007 Consultation for symptom Yes versus no 1.88 (1.64 to 2.16) <0.001 1.93 (1.67 to 2.22) <0.001 ↵a The variance at patient level is constrained to a binomial distribution with an assumed variance of pi^2/3 = 3.29. The random effects variance of the practice-level intercept was 0.311 (SD 0.06) for the empty model and 0.323 (SD 0.06) for model 1. The model fit (−2LL) was 6985.02 for the empty model and 6362.98 for model 1. Level of significance at P<0.05. AMI = acute myocardial infarction. CI = confidence interval. IMD = Index of Multiple Deprivation. OR = odds ratio. SD = standard deviation.
In this issue


Jump to section
More in this TOC Section
Related Articles
Cited By...

