


Article Figures & Data
Figures
- Figure 1.
a) Average levels of serum total cholesterol (health outcomes), 2000–2016. b) Average HbA1c levels (health outcomes), 2000–2016. HbA1c = glycated haemoglobin. SMI = severe mental illness. T2DM = type 2 diabetes mellitus.
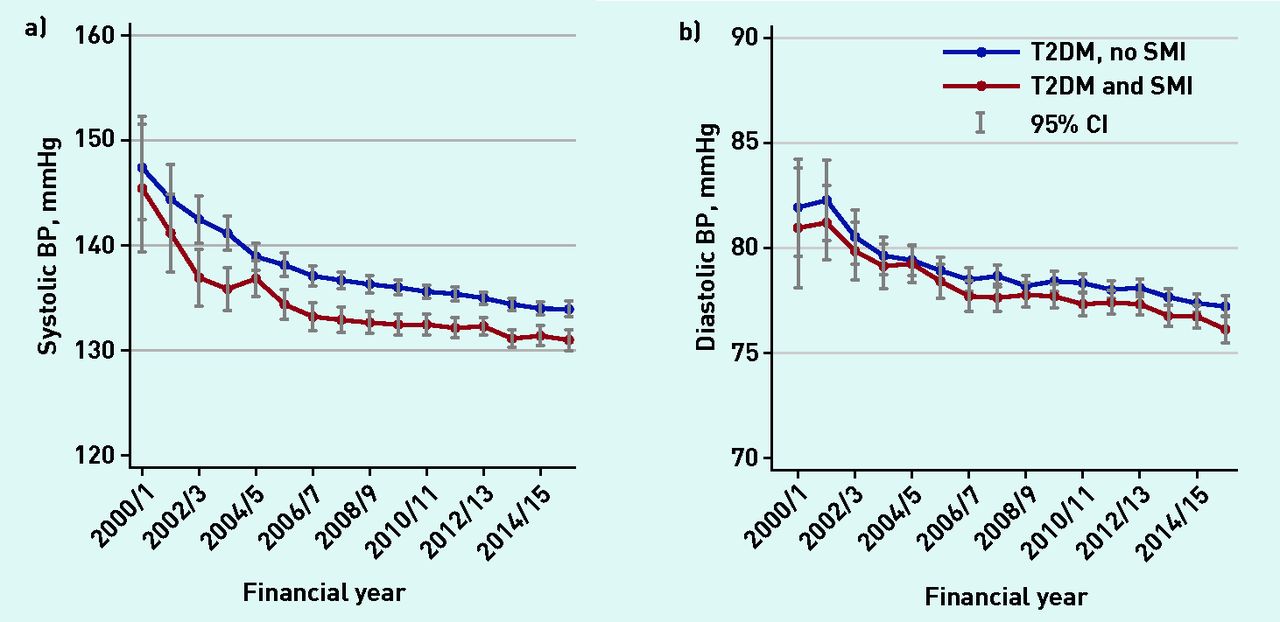
- Figure 2.
a) Average systolic blood pressure levels (health outcomes), 2000–2016. b) Average diastolic blood pressure levels (health outcomes), 2000–2016. BP = blood pressure. SMI = severe mental illness. T2DM = type 2 diabetes mellitus.

Tables
How this fits in
People with severe mental illnesses (SMIs) have poorer physical health and a life expectancy that is lower than the general population. Diabetes contributes significantly to this health inequality. National UK guidelines have recommended regular screening for diabetes in people with SMI and monitoring of metabolic risk factors in people with diabetes. This study, conducted in England, provides new evidence that the monitoring of diabetes and metabolic control is no worse for people with SMI and diabetes, compared with that for people with diabetes alone. However, people with SMI are underdiagnosed for cardiovascular disease (CVD) in primary care and, consequently, have poorer access to specialist and elective hospital care; this may explain the elevated risk of mortality due to CVD in this population. - Table 1.
Baseline characteristics of patients with T2DM and SMI (cases) and patients with T2DM and no SMI (controls)
Overall Cases Controls Participantsa 9965 (100) 2192 (22.0) 7773 (78.0) Controls per case 4 1599 (72.9) 3 323 (14.7) 2 138 (6.3) 1 132 (6.0) Age at diagnosis in years, mean (SD) SMI 47.98 (17.40) T2DM 57.83 (12.97) 56.81 (13.19) 58.12 (12.89) SMI type Schizophrenia 1161 (53.0) Schizoaffective disorder 113 (5.2) Bipolar disorder 701 (32.0) Depression and psychosis 184 (8.4) Other affective disorder 26 (1.2) Mixed 7 (0.3) Age at start of follow-up in years, mean (SD) 58.63 (12.83) 57.67 (13.11) 58.90 (12.74) Duration of T2DM in years, mean (SD) 0.82 (2.85) 0.89 (3.02) 0.80 (2.80) Length of follow-up in years, mean (SD) 6.19 (4.43) 6.02 (4.45) 6.23 (4.43) Family history of diabetes 1766 (17.7) 324 (14.8) 1442 (18.6) Sex Male 4758 (47.7) 1051 (47.9) 3707 (47.7) Female 5207 (52.3) 1141 (52.1) 4066 (52.3) Ethnicity White 8095 (81.2) 1826 (83.3) 6269 (80.7) Asian 638 (6.4) 139 (6.3) 499 (6.4) Black 363 (3.6) 106 (4.8) 257 (3.3) Mixed, other and unknown 869 (8.7) 121 (5.5) 748 (9.6) Deprivation quintile using IMD 2010 1 (least deprivation) 1490 (15.0) 279 (12.7) 1211 (15.6) 2 1860 (18.7) 358 (16.3) 1502 (19.3) 3 1984 (19.9) 415 (18.9) 1569 (20.2) 4 2287 (23.0) 542 (24.7) 1745 (22.4) 5 2334 (23.4) 595 (27.1) 1739 (22.4) Data missing 10 (0.1) 3 (0.1) 7 (0.1) Comorbidities CVD 1591 (16.0) 285 (13.0) 1306 (16.8) Hypertension 4318 (43.3) 734 (33.5) 3584 (46.1) Dementia 64 (0.6) 32 (1.5) 32 (0.4) Learning disability 40 (0.4) 19 (0.9) 21 (0.3) CCI comorbidity, mean (SD) 0.53 (0.78) 0.49 (0.73) 0.54 (0.79) Medication type Antidepressants 2585 (25.9) 1062 (48.4) 1523 (19.6) Antipsychotics First generation 524 (5.3) 434 (19.8) 90 (1.2) Second generation 1009 (10.1) 957 (43.7) 52 (0.7) Antidiabetes 2164 (21.7) 521 (23.8) 1643 (21.1) Antihypertensives 5349 (53.7) 1000 (45.6) 4349 (56.0) Lipid-lowering 3361 (33.7) 684 (31.2) 2677 (34.4) Smoking status Non-smoker 2775 (27.8) 544 (24.8) 2231 (28.7) Ex-smoker 2049 (20.6) 390 (17.8) 1659 (21.3) Current smoker 1873 (18.8) 650 (29.7) 1223 (15.7) Missing data 3268 (32.8) 608 (27.7) 2660 (34.2) Biometric measures BMI, kg/m2, mean (SD) 32.66 (6.95) 32.97 (6.99) 32.56 (6.94) <20 62 (0.6) 12 (0.5) 50 (0.6) 20–24 617 (6.2) 145 (6.6) 472 (6.1) 25–29 1752 (17.6) 401 (18.3) 1351 (17.4) 30–39 3004 (30.1) 733 (33.4) 2271 (29.2) ≥40 871 (8.7) 221 (10.1) 650 (8.4) Missing data 3659 (36.7) 680 (31.0) 2979 (38.3) HbA1c, %, mean (SD) 7.88 (1.95) 7.82 (1.99) 7.90 (1.95) ≤7.5b 2998 (30.1) 672 (30.7) 2326 (29.9) >7.5b 2188 (22.0) 460 (21.0) 1728 (22.2) Missing data 4779 (48.0) 1060 (48.4) 3719 (47.8) Total cholesterol, mmol/L, mean (SD) 5.30 (1.31) 5.36 (1.42) 5.28 (1.28) ≤5 3477 (34.9) 722 (32.9) 2755 (35.4) >5 4105 (41.2) 892 (40.7) 3212 (41.3) Missing data 2383 (23.9) 578 (26.4) 1805 (23.2) Systolic BP, mmHg, mean (SD) 139.17 (18.28) 135.82 (18.16) 140.13 (18.21) ≤140 5154 (51.7) 1280 (58.4) 3874 (49.8) >140 3306 (33.2) 605 (27.6) 2701 (34.7) Missing data 1505 (15.1) 307 (14.0) 1198 (15.4) Diastolic BP, mmHg, mean (SD) 81.87 (10.72) 81.47 (10.72) 81.99 (10.71) ≤80 4391 (44.1) 1011 (46.1) 3380 (43.5) >80 4069 (40.8) 874 (39.9) 3195 (41.1) Missing data 1505 (15.1) 307 (14.0) 1198 (15.4) - Table 2.
Crude healthcare use and health outcomes of patients with T2DM and SMI (cases) and patients with T2DM and no SMI (controls)
Overall Cases Controls Participantsa 9965 (100) 2192 (22.0) 7773 (78.0) Primary care consultations per year Overall Mean (SD) 11.72 (10.05) 13.65 (10.07) 11.18 (9.97) Median (range) 9.60 (0.00–365.30b) 11.10 (0.00–113.00) 9.20 (0.00–365.30b) Primary care physicians Mean (SD) 7.32 (7.77) 8.98 (7.83) 6.85 (7.69) Median (range) 5.70 (0.00–365.30b) 7.10 (0.00–91.30) 5.30 (0.00–365.30b) Practice nurses Mean (SD) 4.40 (5.29) 4.67 (5.26) 4.32 (5.30) Median (range) 3.30 (0.00–143.40) 3.40 (0.00–68.30) 3.20 (0.00–143.40) Health checks per year HbA1c Mean (SD) 1.80 (1.16) 1.78 (1.27) 1.81 (1.13) Median (range) 1.70 (0.00–45.70) 1.70 (0.00–28.10) 1.70 (0.00–45.70) BP Mean (SD) 3.01 (4.27) 2.93 (2.49) 3.03 (4.66) Median (range) 2.60 (0.00–365.30b) 2.50 (0.00–52.20) 2.60 (0.00–365.30b) Total cholesterol Mean (SD) 1.35 (0.86) 1.38 (0.97) 1.35 (0.82) Median (range) 1.30 (0.00–26.10) 1.30 (0.00–26.10) 1.30 (0.00–13.50) BMI Mean (SD) 1.98 (4.07) 2.08 (1.95) 1.95 (4.49) Median (range) 1.60 (0.00–365.30b) 1.70 (0.00–30.40) 1.60 (0.00–365.30b) Macrovascular complications — MI, PVD, and stroke — combined 868 (8.7) 184 (8.4) 684 (8.8) MI 344 (3.5) 70 (3.2) 274 (3.5) PVD 305 (3.1) 58 (2.6) 247 (3.2) Stroke 293 (2.9) 72 (3.3) 221 (2.8) Angina 324 (3.3) 55 (2.5) 269 (3.5) Chronic IHD 101 (1.0) 17 (0.8) 84 (1.1) Hospital admissions for CVD per year, mean (SD) Emergency 0.03 (1.20) 0.03 (0.25) 0.02 (0.18) Elective 0.01 (0.15) 0.01 (0.05) 0.01 (0.16) Angina (ICD-10 code: I20c) 0.01 (0.06) 0.01 (0.06) 0.01 (0.07) MI (ICD-10 codes: I21 and I22c) 0.01 (0.17) 0.01 (0.24) 0.01 (0.15) Chronic IHD (ICD-10 code: I25c) 0.01 (0.15) 0.01 (0.05) 0.01 (0.17) Stroke (ICD-10 codes: I60–I64c) 0.01 (0.07) 0.01 (0.08) 0.01 (0.07) Mortality All-cause 1384 (13.9) 364 (16.6) 1020 (13.1) CVD 511 (5.1) 132 (6.0) 379 (4.9) ↵a Data presented as n (%) unless otherwise stated.
↵b High consultation and health-check rates reflect few consultations recorded over a short follow-up period.
↵c ICD-10 code(s) used to classify admission. BMI = body mass index. BP = blood pressure. CVD = cardiovascular disease. ICD-10 = International Classification of Diseases (10th revision). IHD = ischaemic heart disease. MI = myocardial infarction. PVD = peripheral vascular disease. SD = standard deviation. SMI = severe mental illness. T2DM = type 2 diabetes mellitus.
Diagnosis of SMI Adjusted IRR 95% CI P-value Primary care consultations Overall 1.101 1.069 to 1.134 <0.001 Primary care physicians 1.149 1.111 to 1.188 <0.001 Practice nurses 1.020 0.982 to 1.060 0.297 Physical health checks BP 1.024 1.003 to 1.046 0.028 Cholesterol 1.038 1.019 to 1.058 <0.001 HbA1c 0.989 0.970 to 1.009 0.297 BMI 1.068 1.044 to 1.093 <0.001 Hospital admissions for CVD Emergency 1.149 0.959 to 1.378 0.132 Angina (ICD-10 code: I20b) 1.532 1.069 to 2.195 0.020 MI (ICD-10 codes: I21 and I22b) 0.683 0.482 to 0.967 0.032 Stroke (ICD-10 codes: I60–I64b) 1.440 1.055 to 1.965 0.022 Elective 0.644 0.470 to 0.882 0.006 Chronic IHD (ICD-10 code: I25b) 0.682 0.508 to 0.915 0.011 Adjusted ORb 95% CI P-value Primary care diagnosis of CVD Macrovascular complications combined (MI, stroke, and PVD) 0.970 0.794 to 1.185 0.765 Angina 0.671 0.450 to 1.001 0.050 MI 0.929 0.698 to 1.236 0.613 Stroke 1.381 1.036 to 1.841 0.028 Chronic IHD 0.742 0.394 to 1.399 0.356 Adjusted HR 95% CI P-value Mortality All-cause 1.919 1.602 to 2.300 <0.001 CVD 2.242 1.547 to 3.250 <0.001 ↵a Models were adjusted for: age; ethnicity; level of deprivation; financial years; statistically significant confounders in comorbidities; medications use; duration and family history of T2DM; death in follow-up period; smoking status; and biometric measures.
↵b ICD-10 code(s) used to classify admissions BMI = body mass index. BP = blood pressure. CVD = cardiovascular disease. HR = hazard ratio. ICD-10 = International Classification of Diseases (10th revision). IHD = ischaemic heart disease. IRR = incidence rate ratio. MI = myocardial infarction. OR = odds ratio. PVD = peripheral vascular disease. SMI = severe mental illness. T2DM = type 2 diabetes mellitus.
Supplementary Data
Supplementary material is not copyedited or typeset, and is published as supplied by the author(s). The author(s) retain(s) responsibility for its accuracy.
In this issue


Jump to section
More in this TOC Section
Related Articles
Cited By...

