


Introduction
The term ‘risk’ implies the chance-based variation in the total cost of healthcare for a fixed population. Hence, costs in a single year may be higher or lower than the long-term average trend in costs. The first study applicable to the UK looked at the financial risk associated with elective admissions in general practitioner (GP) fund-holding (Crump et al., Reference Crump, Cubben, Drummond and Marchment1991). The risk associated with costs (90% of outcomes) was found to be ±27.5%, ±15.3% and ±5.7% for 9000, 24 000 and 180 000 head, respectively. The study of Bachmann and Beavan (Reference Bachmann and Beavan1996) contained an excellent review of the early literature on financial risk in healthcare purchasing. They then investigated catastrophic costs for 15 rare or costly conditions and concluded that an absolute minimum of 30 000 head was needed to avoid catastrophic financial loss. The essential need for risk-sharing arrangements was highlighted. A study in the USA relating to health maintenance organizations (HMOs), which have similarities with practice-based commissioning (PBC) groups, concluded that groups should merge to attain a minimum of 115 000 enrolees, that is, head of population (Given, Reference Given1996). Another study using the York Index (an early attempt at a weighted capitation formula suited to the needs of GP fund-holding budgets) concluded that for 10 000 head, the risk exposure (in terms of a percentage of the average budget) was in the range ±20% and that there was a 35% chance of budgets exceeding ±10%, ±3.2% and ±1.6% for 10 000, 100 000 and 500 000 head, respectively (Martin et al., Reference Martin, Rice and Smith1997). This was followed by a paper reviewing the organizational and risk elements relating to primary care groups which concluded that a population in the range 50 000 to 100 000 allowed the best balance between risk and the control of costs (Bojke et al., Reference Bojke, Gravelle and Wilkin2001). A study on financial risk for municipal healthcare purchasers in Finland reached similar conclusions to those above, and recommended that small purchasers needed to form larger purchaser risk pools (Mikkola et al., Reference Mikkola, Sund, Linna and Hakkinen2003). Finally, a study in Northern Island on the financial risk associated with the ‘need index’, which forms part of the capitation formula, showed that a population base of 100 000 head was needed to reduce this part of funding risk to an acceptable level (Department of Health, Social Services and Personal Safety, 2004). In summary, different methods of analysis all reach a consensus that around 100 000 head are needed to reduce the financial risk arising from chance variation in both costs and allocated budgets (funding) down to an acceptable level.
Interest in the topic then declined, however, in the interval the development of the capitation formula, payment by results (PbR) and the supporting healthcare resource group (HRG) tariff mean that a more up to date evaluation is required.
Actuarial basis
Financial risk in healthcare purchasing arises from the intrinsic variation around the average expected incidence for the wide variety of events to be covered by a fixed budget. This variation is then magnified by the cost of the activity. Hence, an event costing £300 has less inherent risk in terms of the total budget than something costing £30 000. For example, there are 151 HRGs (version 4), costing more than £7500, which comprise 0.9% of overnight admissions but account for 5% of total inpatient overnight costs (Department of Health, 2008). To put this is context, less than 136 persons per 100 000 head account for 5% of inpatient costs. Version 4 HRG will be used as the basis for PbR, which commenced in April 2009.
The variation in the number of events is made up from two parts. The incidence of the disease or condition per head leads to an expected average number of persons in the population of a primary care trust (PCT) or PBC group. The variation around this expected average is commonly described by Poisson statistics, which holds good for most conditions except rare genetic disorders running in families. While the average can be a decimal value, Poisson statistics only gives integer outcomes, that is, persons are not divisible (see note). As the average (mean) gets smaller, Poisson outcomes become increasingly skewed and it is this skew that is the basis for the high financial risk associated with healthcare purchasing. Figure 1 shows the outcome of Poisson variation for conditions with different incidence within the population group. The variation is expressed as a standard deviation to demonstrate the key concepts.

Figure 1 Variation around the average for the number of persons with a disease or condition seen in a group of people such as a practice list, practice-based commissioning group or primary care trust
The majority of all healthcare events, seen from a cost per event perspective, are in the interval less than 100 per 100 000 head (see Figure 2). At an average of around 100, the shape of the Poisson distribution is roughly that of a normal distribution, hence, the limits are ±3.5 standard deviations with the typical bell-shaped distribution of frequency. Below this point, events much higher than the average become far more common. Hence, if our expected average is only 0.1 (ie, a less common condition) we have a 90% chance of no one with that condition in our population; however, we have a 9% chance of getting one person (ten-times the average) or a 0.5% chance of getting two people (twenty-times the average) and a 0.5% chance of getting three or more people. These outcomes are the basis of the high financial risk arising from chance, especially as the size of the population base reduces below 100 000 head.
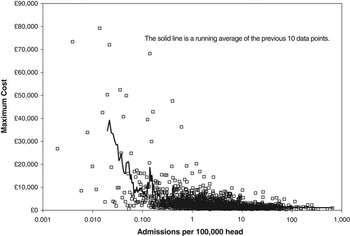
Figure 2 Maximum cost for version 4 HRG with different number of admissions per annum (converted to admissions per 100 000 head)
The earlier studies on financial risk all used Poisson statistics, but due to the limitations of the software available at the time, switched to a Normal approximation at an expected average incidence of between 30 and 100 (Crump et al., Reference Crump, Cubben, Drummond and Marchment1991; Bachmann and Beavan, Reference Bachmann and Beavan1996). Current software can apply Poisson statistics up to an expected average of around 1000 and so will cover a wide range of events in all but the largest population groups. Above 1000, a Normal approximation is appropriate provided the outcomes are rounded to the nearest whole number.
The final feature of Poisson variation of relevance is that the standard deviation is always equal to the square root of the average. Hence, for an average of 100, one standard deviation will be ±10 and the maximum limits for risk will be around ±36%. Even at an average of 1000 the maximum limits for risk are still ±9.8% and so, even with allowance for events with similar prices to be grouped together, the intrinsic risk in all healthcare purchasing is likely to be high in relation to the generally accepted +3% tolerance allowed for NHS organizations. Although more recently every NHS organization is expected to achieve a surplus which implies a negative tolerance to the budget!
High-risk individuals
The basic Poisson risk is further magnified by the different number of contacts that these people have with health services. This additional variation is described by the negative binomial distribution (which also only has integer outcomes). The extent of the negative binomial-based variation will depend on the condition, that is a maximum of two for bilateral operations such as cataracts and up to many attendances, for example, for cancer treatments, long-term conditions and some mental health conditions (Glynn and Buring, Reference Glynn and Buring1996). The negative binomial distribution simplifies to become a Poisson distribution when there is only one attendance per person. Every GP will know particular individuals in their practice who are always at the surgery and have multiple hospital contacts. In every population, a small number of persons can account for a disproportionate amount of costs. Hence, there is a general rule for the US healthcare system that the most expensive 10% of patients (usually those with long-term conditions) account for 70% of total spending (Anderson, Reference Anderson1999).
In addition to the above, there are other environmental factors such as weather, viruses, pollution, hours of sunlight, etc., which can act to shift the long-term average for particular conditions to higher or lower levels at particular locations or times of the year. These factors tend to effect emergency admissions and can be modelled using various statistical distributions which are usually characterized by extreme values (Jones, Reference Jones2004). Most notably, respiratory Healthcare Research Group (HRG) effecting adults and children are particularly susceptible to such effects during the winter (Damiani and Dixon, Reference Damiani and Dixon2001; Jones, Reference Jones2008b), and, to lesser a extent, events in the ICD-10 chapter describing admissions for ‘injury, poisoning and other external causes’ show a summer peak (Damiani and Dixon, Reference Damiani and Dixon2001). A more recent study on the risk associated with emergency admissions concluded that only 19% of total emergency admissions were covered by a diagnosis where only simple chance variation was occurring, that is, the other 81% of emergency admissions were sensitive to changes in the environment (Jones, Reference Jones2009). As yet, these effects have not been incorporated into a financial risk model; however, they will only lead to higher risk than that predicted from the baseline Poisson-based predictions.
End of life also tends to be associated with increased healthcare costs and it is reported that there is a ten-fold increase in costs in the last year of life compared with those at five years to decease. This overshadows the general 30% increase in costs associated with an increase in age from 65 to 85 years (Seshamani and Gray, Reference Seshamani and Gray2003).
The next key feature of the financial risk is that the conditions with the lowest average rate tend to have the highest cost; that is, the very high Poisson-based risk is then further magnified by very high price. This is illustrated in Figure 2 using 2006/07 HRG v.4 reference cost data for elective and emergency overnight admissions (Department of Health, 2008). Figure 2 also demonstrates that at the level of 100 000 head, some 76% of inpatient admissions occur at an average of less than 100, hence, the relevance of Figure 1. Note that admissions costing more than £30 000 only occur for events occurring at less than 1 per 100 000 head. Figures 1 and 2 combined should give an intuitive sense that risk will rapidly escalate for population groups less than 100 000 head.
Implications for practice-based commissioning
Having established the conceptual basis for financial risk we can then apply this to construct a computer simulation of the financial risk associated with different sized populations. Such a computer simulation allows us to investigate the potential problems without having to suffer their consequences in the real world. The outcome of a recent series of simulations using v.3.5 HRGs to investigate the risk relevant to PBC reveals several important factors (Jones, Reference Jones2008a; Reference Jones2008b; Reference Jones2008c):
i) The financial risk reduces to acceptable levels at around 100 000 head, that is, at a population roughly the size of an English local authority. This concurs with the results of the earlier studies.
ii) The financial risk is minimized by excluding all admissions costing more than £4000, that is, roughly 30% of the total budget for inpatient services.
iii) While the risk is reduced to the absolute minimum by excluding events costing more than £4000, the level of risk remains relatively low up to around £9000. This corresponds to the £7000 stop-loss limit, which was applied to GP fund-holding.
iv) Greater than 1 000 000 head are needed to provide a sufficient size for the 30% of excluded admissions to be grouped into a financially stable risk pool. This is an intuitive outcome for grouping all the very high-risk events into one place.
These studies only assumed Poison-based risk and hence represent the best case scenario. The inclusion of factors relating to the environment and multiple attendances for particular individuals in specific HRG are not needed to prove the concept, the risk is already high enough.
This minimum case can be illustrated in another way using the figure of 136 persons per 100 000 head, mentioned above, accounting for 5% of costs. These persons have an average inpatient cost of £10 000 per head. If PBC groups in England covered 100 000 head and we assume only one admission per person, then we could expect between 94 and 186 such persons costing from £878 000 up to £1 850 000 per PBC group (with an average of £1 360 000 for England). Within this spread in costs, 5% of PBC groups would be in the range £878 000 to £1 200 000 and 5% would be in the range £1 530 000 up to £1 850 000. Only a few of these HRG are within Specialist Commissioning and hence PCTs are potentially exposed to high risk resting on the distribution of a very small number of persons.
In terms of those HRG which are most susceptible to multiple attendance/admission per person (the negative binomial-based variation), an absolute minimum of 55 elective and four emergency HRG v.3.5 have been identified (Jones, Reference Jones2008b). It was suggested that these HRG should be excluded from a core PBC budget on the basis that one high-cost individual could consume a high amount of resources and that this risk is best covered by a risk pool. HRG v.4 data is not yet available at small-area level to make this evaluation for the newer version of the HRG tariff, which will commence in the 2009/10 financial year. HRG can often be a misleading basis for such analysis and specialty is often a more logical alternative. In this respect, multiple attendances/admissions will most often be seen in the specialties (specialty code in brackets); Nephrology (259, 361), Haematology (253, 303), Oncology (260, 370, 800), Rheumatology (262, 410), Neurology (400, 421) and Dermatology (257, 330).
Risk sharing strategies
The observation that 30% of the PBC budget should be placed into a larger risk pool requiring around 1 000 000 head, clearly shows that the population required for the risk pool is well beyond the size of most host PCTs (Jones, Reference Jones2008a). Therefore, there arises the need for a financial instrument by which PCTs can share risk. Groups of PCTs can agree to establish a financial risk instrument which reimburses those PCTs where costs are higher than expected due to chance variation rather than systematic reasons (Jones, Reference Jones2008c). PCTs and PBC groups are not advised to pursue commercial risk insurance since self-insurance between PCTs is preferable. A briefing document ‘Wading through medical insurance pools’ by the American Academy of Actuaries (2006) presents a useful overview of the issues. Analysis of data from four PCTs showed that the capitation formula fails to adequately reflect the proportion of each PCT’s contribution into such a risk instrument. On this basis, actual cost share needs to be used alongside a process for investigating the causes of these differences. The fact that the capitation formula fails to predict share is no surprise given the fact that it is only designed to allocate the total budget, not the cost of individual or groups of HRG.
At this point, the issue of high-risk individuals and risk sharing needs to be combined into a coherent strategy for minimizing financial risk (Smith, Reference Smith1999). How do we place costs associated with persons into the risk pool?
The earlier observation that placing events costing more than £4000 to £9000 into a risk pool minimizes overall risk is relevant (Jones, Reference Jones2008a). Hence, we could state that placing person-related costs of up to £9000 per financial year into the risk pool will minimize overall risk. A person-based approach, therefore, encompasses all sources of risk associated with single costly admissions, persons with chronic conditions, including mental health conditions and cancer treatments, and persons at the end of life. This approach does however expose a fundamental weakness in the collection of healthcare data in England, namely, that there has never been any historic collection of person-based costs and hence there is no ready basis on which to formulate the relative share which each organization may have in the risk pool. If the assertion that the most costly 10% of patients account for 70% of total costs is correct, then to progress down this route may lead to the conclusion that there is very little left to remain in the core PBC budget (Anderson, Reference Anderson1999). Issues such as this need urgent research (see Box 1).
Box 1 Areas for further research
• Can primary care actually demonstrate statistically significant levels of ‘demand management’ in the face of high background variation?
• To what extent do the weather and other environmental variables cause demand to fluctuate, and how could primary care be better supported via illness forecasts?
• Is the implied financial risk in healthcare compatible with practice-based commissioning, or does PBC need to have a more defined focus?
• Should a national risk fund be used to cover the very high risk associated with high-cost admissions/individuals?
GP fund-holding
The above conclusions seem to contradict the apparent early success of GP fund-holding in terms of large savings made from populations much smaller than 100 000 head. There are several reasons for this perceived gap. First, GP fund-holding was restricted to elective inpatient and outpatient attendances and had a built-in risk-sharing arrangement with the health authority for any procedure costing more than £7000. More importantly, at the time there was no adequate formula to ensure relatively ‘fair share’ funding, and the drive to ensure success of the scheme appears to have resulted in over-funding of the early wave practices (Dixon et al., Reference Dixon, Dinwoodie, Hodson, Dodd, Poltorak, Garrett, Rice, Doncaster and Williams1994; Yule et al., Reference Yule, Healey and Grimshaw1994). The fourth wave onward had difficulty in replicating the early success and often needed to negotiate regarding under-funding (Jones, Reference Jones1996a). A review of the GP fund-holder era concluded that limited productivity gains were achieved (Giuffrida, 1999). This tends to support the notion that ‘success’ was the output of biased funding. The total purchasing pilots were usually made up from groups of early wave fund-holders and a similar query over relative funding levels applies to claimed success.
The equivalent to PBC in the USA
During the late 1990s, various equivalents to PBC were found to be successful in reducing the cost of healthcare in the USA. However, it must be remembered that at that time costs per head of population were typically 20% to 50% higher than the UK equivalent. Such ‘success’ may not be so easily replicated in the UK. The experiences of GPs in the USA under a capitation funded environment are somewhat salutary – although it must be pointed out that many of the horror stories arose when the golden rule of 100 000 head was ignored and capitation was implemented at practice level (Jennings, Reference Jennings2008).
Allocating budgets to practices
The matter of a ‘fair share’ formula is exceedingly important, however, it would seem that issues around how hospitals count and code may point to a compromise between a formula-driven approach and the realities of actual cost pressures (Azeem et al., Reference Azeem, Bindman and Weiner2001; Jones, Reference Jones2007; Reference Jones2008a; Reference Jones2008b; Reference Jones2008c). This is further complicated by the fact that different hospitals have different thresholds for surgical intervention in a range of common conditions such as hip replacement, cholecystectomy and prostatectomy. (Black et al., Reference Black, Griffiths and Glickman1997; Coyle et al., Reference Coyle, Croxford, Asche, To, Feldman and Friedberg2001). Regarding the issue of a ‘fair share’ formula, the Northern Ireland study on the risk of relative over- or under-funding due to the ‘needs index’ part of the capitation formula is highly relevant (DHSSPS, 2004). This study demonstrated that for 1 000 000 head the 90% confidence interval in the allocation of funds was ±4%, that is, add 4% to the chance-based variation in costs to get the total budgetary risk factor. Even if a perfect formula were to be developed it would immediately become ‘imperfect’ due to the chance distribution of high-cost individuals between practices and PCTs. Hence, the absolute need for risk pools covering greater than 1 000 000 head.
The final issue surrounding budgets is that of emergency admissions. A recent study has demonstrated that predicting the next year’s emergency costs is exceedingly difficult (Jones, Reference Jones2009). This arises from the high sensitivity of many diagnoses to weather and other environmental conditions which give rise to highly erratic behaviour in the trend over time. This study suggested that the risk was so high that emergency admissions should be excluded from all PBC budgets. This in itself creates a statistical dilemma. Removing emergency admissions cuts the budget size to such an extent that the residual risk associated with the elective admissions then rises.
Managing budgets
Having discussed the actuarial basis for risk we now need to determine how this effects the day-to-day operation of PBC. Assuming that the bold step of covering up to 40% of the total budget via a larger risk pool has been taken to limit overall risk, there are a number of more operational issues to be addressed. The first implication is around forecasting the year-end position. Figure 2 uses annual totals and hence appropriate profiles of activity across the year will need to be applied (Jones Reference Jones1996a; Reference Jones1996b; Reference Jones2000). However, the smaller mid-year totals imply higher uncertainty in the year-end forecast. One solution to this problem is to look at a running twelve-month total – which implies that data is available across multiple years.
The next issue is around budgets for practices within a larger PBC group. Once again the smaller parts of the whole are subject to higher uncertainty. The uncertainty associated with the cost for a practice which is one-quarter the size of the larger group, will be two-times higher than that of the group. The ability of different hospitals to count and code the same activity in different ways or to have different thresholds for admission should not be underestimated (Jones, Reference Jones2007; Reference Jones2008d), and practices within a group using different hospitals (including different sites within the same acute Trust) will be subject to differential financial pressures. My own calculations indicate that the PCT with the highest raw day case rate in England could have up to 20% higher apparent elective inpatients (overnight + day case) simply due to the way certain events are (incorrectly) counted as a ‘day case’. Considerable pragmatism will be required in resolving such tensions within the group.
The issue of long-term cumulative surplus or deficit is poorly understood since most people have a somewhat vague notion that it all averages out. Alas this is not the case and even after 9 years of operation a PBC group is still open to high levels of chance-related cumulative deficit (Jones, Reference Jones2008c). In fact, after 9 years, one in 512 practices will have experienced 9 years in a row where costs were higher than expected due to chance variation, one practice will have experienced 9 years of lower than expected costs due to chance and all others will be somewhere in between. The outcome of chance events is never the average!
The final issue is around the need to group most HRG up to larger sub-groups in order to make any sense of the very small numbers of admissions/attendances at HRG level. Specialty can be a convenient alternative but in both the inpatient and outpatient arena a referral/admission at one hospital may be counted as Trauma and Orthopaedics but get counted as Plastic Surgery or Neurosurgery at another. Hence, aggregation of specialties may even be needed to compare performance between practices.
Benchmarking
The currently available benchmarking tools are inadequate as factors such as ethnicity, deprivation and social group are often ignored. Assigning an average deprivation score to each practice is misleading since my own (unpublished) research shows that the relationships with deprivation are non-linear and unique to each condition. One suspects that arguments with local acute trusts over intervention rates may sometimes be artefacts of the currently flawed benchmarks or are counting issues. These are issues for the PCT to address on behalf of the PBC groups. In many ways benchmarking can be a diversion. The recent emphasis on high-cost patients is probably the most fruitful way to focus limited management time. At the end of the day it is the most expensive 10% of patients which consume 70% of overall spending (Anderson, Reference Anderson1999).
Conclusions
In conclusion, healthcare purchasing is a high-risk business and appropriate risk strategies must be implemented to ensure that PBC operates within a sufficiently stable financial environment for its success to be guaranteed. Each PBC group needs to be 100 000 head or larger and the risk associated with a substantial portion of the budget needs to be in a large regional risk pool. The issue of a ‘fair share’ formula is exceedingly important, but this is counterbalanced by actual cost pressures arising from differences in how hospitals count and code (Jones, Reference Jones2007; Reference Jones2008a; Reference Jones2008b). The issue of emergency admissions is highly problematic.
While a risk pool may be desirable, it is likely to be highly controversial with different PBC groups accusing other groups of failure to contain costs. What is the best method for sharing the risk? Is it the average of historic costs or is it the share predicted by the capitation formula? In the end, the structure of the risk pool may need to be mandated.
Taking all sources of risk into account (imprecision in the funding formula, chance risk and additional environmental based risk) leads to the conclusion that the implied risk for a PBC group covering 100 000 head (even after excluding the 22 lowest volume/high cost HRG) is of the order of ±9% (95% confidence interval). This appears to be incompatible with the concept of a level playing field and ‘fair-shares’ funding, that is, the ‘fair share’ is subject to considerable uncertainty (see Box 2).
Box 2 Key messages for GPs and commissioners
• Financial risk in healthcare is very high
• Population groups of greater than 100 000 are required to reduce the chance risk to an acceptable level
• A substantial proportion of high-cost/low-frequency healthcare events and high-cost individuals need to be placed into a larger risk pool which needs to cover more than 1 000 000 head to avoid the risk pool itself becoming a source of unacceptable risk
• Additional risk above that from simple chance arises from emergency admissions which typically have two- to three-times higher risk than simple chance variation
• The allocation of budgets is also subject to the risk of over- or under-funding relative to other groups
• The high inherent variation in healthcare implies uncertainty in the allocation of budgets and leads to large scale swapping between budgets to ‘manage’ chance pressures
• For 100 000 head, the combined financial risk (after excluding high cost events) implied for PBC is around ±9% (95% confidence interval)
What appeared to be a simple policy initiative for saving costs seems to have encountered some real world limitations.
Note
Poisson: an explanation
Poisson statistics is used to explain the chance variation around the average for a variety of ‘arrival-type’ situations, such as telephone calls per hour at a surgery, GP referrals per week, emergency admissions per day, A and E attendances per week; that is, anything that has a rate per unit of time. The variation seen for a Poisson distribution has a standard deviation equal to the square root of the average. Hence, if we expect an average of 100 GP referrals per month, the standard deviation will be ±10 or ±10%. The outcome of Poisson statistics can only be a positive integer value greater than zero; that is, you cannot get a fraction of a patient. A Poisson distribution is skewed such that the most common values are always the average and the average less one and it has a tail of higher than expected outcomes which create havoc with healthcare budgets.
Statement of competing interests
The author has no competing interests to declare.


