


Abstract
Aims Chronic kidney disease (CKD) was found to be an independent risk factor for all-cause mortality as well as adverse cardiovascular disease (CVD) events in high-risk populations. Findings from population-based studies are scarce and inconsistent. We investigated the gender-specific association of CKD with all-cause mortality, cardiovascular mortality, and incident myocardial infarction (MI) in a population-based cohort.
Methods and results The study was based on 3860 men and 3674 women (aged 45–74 years) who participated in one of the three MONICA Augsburg surveys between 1984 and 1995. CKD was defined by an estimated glomerular filtration rate between 15 and 59 mL/min/1.73 m2. Hazard ratios (HRs) were estimated from Cox proportional hazard models. In this study, 890 total deaths, 400 CVD deaths, and 321 incident MIs occurred in men up to 31 December 2002; the corresponding numbers in women were 442, 187, and 102. In multivariable analyses, the HR for women with CKD compared to women with preserved renal function was significant for incident MI [HR 1.67; 95% confidence interval (CI) 1.07–2.61] and CVD mortality (HR 1.60; 95% CI 1.17–2.18). In men, CKD was also significantly associated with incident MI (HR 1.51; 95% CI 1.09–2.10) and CVD mortality (HR 1.48; 95% CI 1.15–1.92) after adjustment for common CVD risk factors. In contrast, men and women with CKD had no significant increased risk of all-cause mortality.
Conclusion CKD was strongly associated with an increased risk of incident MI and CVD mortality independent from common cardiovascular risk factors in men and women from the general population.
Chronic kidney disease (CKD) is a worldwide public health problem with an increasing incidence and prevalence.1 The increase in the number of persons with CKD is reflected in the rising number of people with end stage renal disease (ESRD) treated by dialysis or kidney transplantation.2 In the past, the incidence of ESRD reached about 135 new patients per million in Europe and 336 new patients per million in the USA.3 Furthermore, in several studies it was shown that a decreased level of kidney function is an independent risk factor for all-cause mortality as well as adverse cardiovascular disease (CVD) events, such as myocardial infarction (MI) and stroke.4–7 These findings were, in particular, based on studies conducted in high-risk populations, for example in patients with CVD or CVD risk factors.4–7 However, data from the general population on this issue are scarce and the findings are less consistent.8–12 In addition, very few population-based data are available in Europe.13 In the present study, we investigated the association between CKD and incident MI, CVD mortality, and all-cause mortality in persons aged 45–74 years from the general population. To answer the question whether CKD is likewise a risk factor for the different outcomes in both sexes, all analyses were performed separately for men and women.
Methods
The presented data were derived from the population based MONICA (monitoring trends and determinants on cardiovascular diseases) Augsburg (southern Germany) studies conducted between 1984 and 1995. The MONICA Augsburg project was part of the multinational WHO MONICA project and the design of the project has been described in detail elsewhere.14,15 Three independent cross-sectional surveys were carried out in the city of Augsburg and the counties Augsburg and Aichach–Friedberg in 1984/85 (S1), 1989/90 (S2) and 1994/95 (S3) to estimate the prevalence and distribution of cardiovascular risk factors among men and women. Altogether 13 427 persons (6725 men, 6702 women, response 77%) aged 25–74 years participated in at least one of the three cross-sectional studies. All persons who took part in more than one survey were included once only with data collected at the first visit. All subjects were prospectively followed within the framework of the Cooperative Health Research in the Region of Augsburg (KORA). The present study was restricted to 45–74 year old study participants (n=7823; 3993 men, 3830 women). Up to 31 December 2002, 890 men and 442 women in this age-range had died. None of the study participants were excluded from analysis due to insufficient follow-up.
For the present analyses using mortality as outcome, we excluded all subjects with incomplete data on any of the included variable (n=285). Furthermore, we excluded four study participants with an estimated glomerular filtration rate (eGFR) <15 mL/min/1.73 m2, because such a GFR is defined as kidney failure in the National Kidney Foundation (NKF) Kidney Disease Outcomes Quality Initiative (K/DOQI) guidelines.16 Finally, the prospective analyses comprised 3860 men and 3674 women aged 45–74 years at baseline for the outcomes of all-cause and CVD mortality.
For the analyses using incident MI as outcome, we excluded 277 study participants with incomplete data on any of the included variables, four persons with an eGFR <15 mL/min/1.73 m2, and 249 persons with a prevalent MI at baseline. Furthermore, for these analyses, 142 men and 120 women who moved outside the study area during follow-up were censored at the date of the move. Thus, these analyses comprised 3662 men and 3631 women aged 45–74 years at baseline.
Written informed consent was obtained from each study participant and the study was approved by the local Ethics Committee.
Data collection
Baseline information on socio-demographic variables, smoking habits, physical activity level, medication use, and alcohol consumption were gathered by trained medical staff during a standardized interview. In addition, all the participants underwent an extensive standardized medical examination including the collection of a blood sample. All measurement procedures have been described elsewhere in detail.14 Body mass index (BMI) was calculated as weight in kilograms divided by height in square metres. Participants were classified as active during leisure time if they regularly participated in sports in summer and winter and if they were active for at least 1 h per week in either season. Actual hypertension was defined as blood pressure values ≥140/90 mmHg and/or use of anti-hypertensive medication given that the subjects were aware of being hypertensive. Dyslipidaemia was defined as the ratio of total cholesterol to high density cholesterol ≥5.0. History of CVD was defined as prevalent MI or prevalent stroke at baseline.
Clinical chemical measurements
A non-fasting venous blood sample was obtained from all study participants while sitting. Total serum cholesterol analyses were carried out using an enzymatic method (CHOD-PAP, Boehringer Mannheim, Germany). HDL cholesterol was also measured enzymatically after precipitation of the apoprotein B-containing lipoproteins with phosphotungstate/Mg2+ (Boehringer Mannheim, Germany). Serum creatinine was determined using an automated Jaffe method in S1 and S2 (Technicon, SMAC autoanalyzer; Tarrytown, NY) and using an enzymatic method in S3 (creatinine PAP, Boehringer Mannheim, Germany). The enzymatic method was calibrated according to the Jaffe method. Serum uric acid was measured by the uricase method in S1 and S2. In S3, serum uric acid was determined with an enzymatic colorimetric reaction (Uric Acid PAP, Boehringer Mannheim). Internal and external quality control was performed according to the WHO MONICA Manual.14,15
Assessment of renal function
The abbreviated Modification of Diet in Renal Disease Study Group equation1 was used to calculate eGFR:
eGFR (mL/min/1.73 m2)=186.3×(serum creatinine−1.154) × (age−0.203)×0.742 (if female)×1.212 (if black), where serum creatinine is measured in mg/dL, and age in years.
The study population was stratified into two groups by the level of kidney function, namely, eGFR of 15–59 mL/min/1.73 m2, and eGFR of ≥60 mL/min/1.73 m2. This cut-point was chosen as an eGFR of 15–59 mL/min/1.73 m2 represents a moderate to severe decrease of GFR defined by the NKF K/DOQI guidelines.16 Thus, the term CKD was used for an eGFR between 15 and 59 mL/min/1.73 m2 in the present study.
Outcomes
The endpoints used in this study were incidence of fatal or non-fatal MI including sudden cardiac death, mortality from any CVD, and all-cause mortality. Mortality was ascertained by regularly checking the vital status of all sampled persons of the MONICA surveys through the population registries inside and outside the study area; this procedure guaranteed that the vital status of cohort members who had moved out of the study area could also be assessed. Death certificates were obtained from local health departments and coded for the underlying cause of death by a single trained person using the 9th revision of the International Classification of Diseases (ICD-9). MIs were identified through the population-based MONICA/KORA Augsburg coronary event registry for the 25 to 74-year-old study population and censored at the 75th year of age.17 This registry monitors the occurrence of all in- and out-of-hospital fatal and non-fatal MIs among the 25 to 74-year-old inhabitants of the study region.17 An MI was considered as incident if it was the first during follow-up in a person without a history of heart attack in the baseline survey. Up to 31 December 2000, the diagnosis of a major non-fatal MI was based on the MONICA algorithm taking into account symptoms, cardiac enzymes, and ECG changes.17 Since 1 January 2001 all patients with MI diagnosed according to ESC and ACC criteria were included.18,19 Coronary deaths were validated by death certificates, autopsy report, chart review, and information from the coroner or the last treating physician.
Statistical analyses
For analyses of MI, event times were computed as the time from baseline examination to the occurrence of the first event and for analyses of total and cardiovascular mortality, event times were calculated as times to death. For all-cause and CVD mortality (ICD-9: 390–459), subjects without events were censored at their last date of follow-up. For incidence estimates, that is non-fatal MIs and fatal coronary events, the follow-up times were censored for men and women at death or when they reached the age of 75 years after which the register-based monitoring of coronary events ceases. Means or proportions for baseline demographic and clinical characteristics were computed for men and women with and without CKD. The χ2 test was used to test the differences in prevalences. The t-test was used to compare means. The interquartile range (IQR) was defined as the interval from the 25%-quantile to the 75%-quantile. Hazard ratios (HRs) were computed for persons with a moderate to severe decrease of eGFR (15–59 mL/min/1.73 m2) as compared with persons with an eGFR of ≥60 mL/min/1.73 m2 in Cox proportional hazards models. The first model included eGFR and in addition age (continuous) and survey. The second model included all previous factors plus actual hypertension (yes/no), dyslipidaemia (yes/no), level of physical activity (active/inactive), smoking status (regular smoking, that is a subject who smoked at least one cigarette per day at baseline, yes/no), alcohol intake (men: 0, >0, and <40 or ≥40 g/day; women: 0, >0, and <20 or ≥20 g/day), BMI (continuous), and history of diabetes (yes/no and unknown). For the mortality outcomes fully adjusted models 2 were also adjusted for history of CVD.
The above analyses were repeated by including eGFR as a continuous variable. HRs were computed for an increase of 10 mL/min/1.73 m2 of eGFR.
The assumption of proportionality of hazards was assessed by fitting models stratified by risk factor categories, then plotting the log (-log(survival)) curves to check parallelism. No severe deviations from parallelism were evident. The assumption of linearity was assessed graphically by studying the smoothed martingal residuals from the null model plotted against the covariate variables. Kaplan–Meier survival plots of eGFR groups in relation to the different outcomes were examined. Comparisons between survival curves were performed using Log Rank test. Results are presented as HRs and 95% confidence interval (CI). Significance tests were two tailed and P-values <0.05 are stated as statistically significant. All analyses were performed using the Statistical Analysis System (Version 8.2, SAS Institute Inc., Cary, NC, USA).
Results
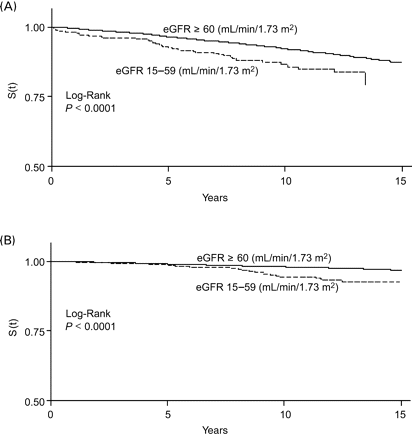
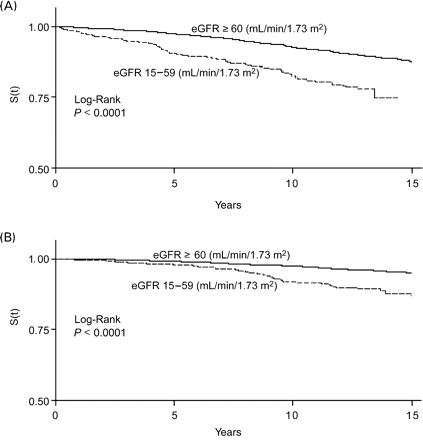
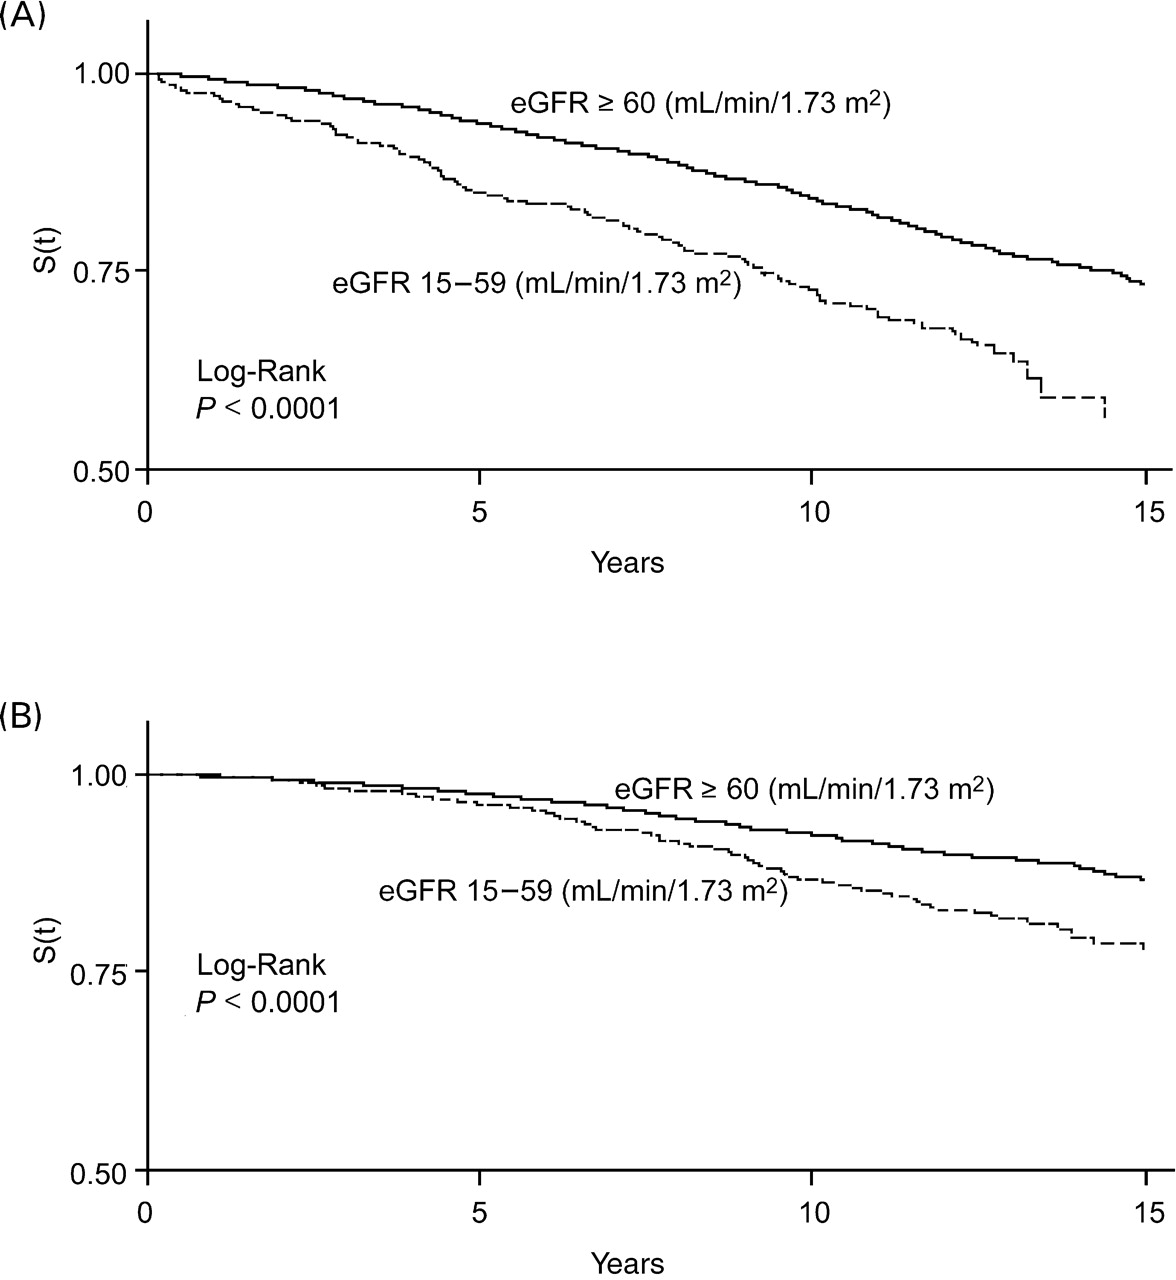
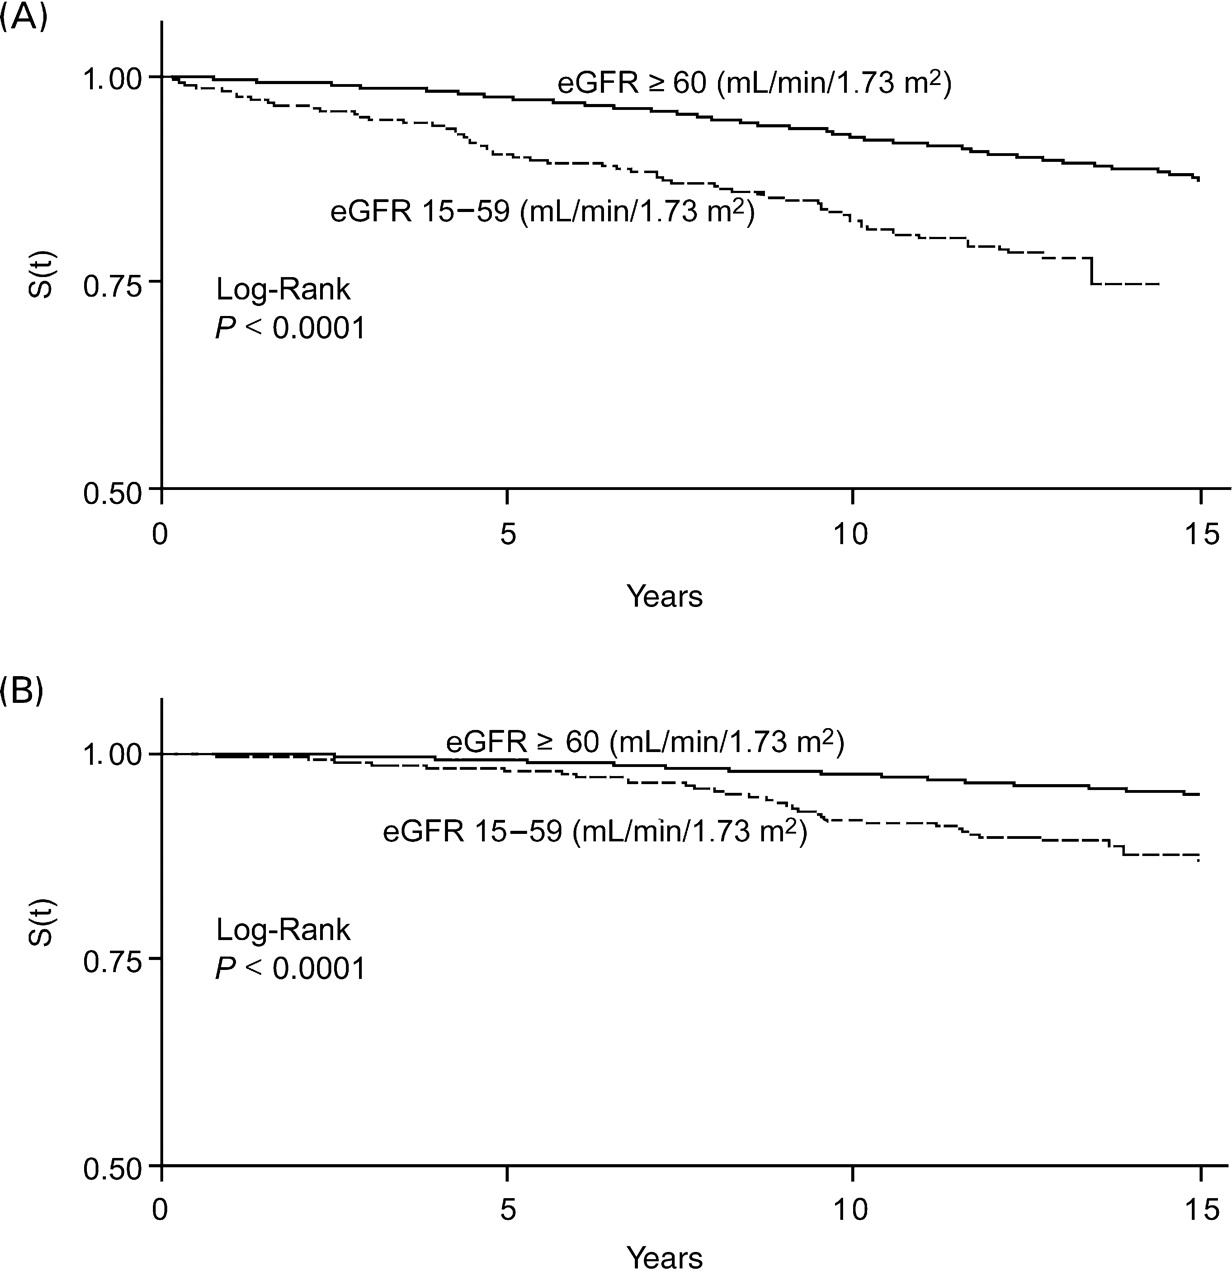
In Table 1, gender specific differences in the baseline characteristics between persons with and without CKD are given. Men and women with CKD were more likely to be older, to have dyslipidaemia, and a history of diabetes and CVD. They were more likely to be hypertensive, to be non-smokers, and less likely to have a high daily alcohol intake. These men and women were also more likely to have a higher BMI, higher uric acid, and serum creatinine levels. During follow-up (median follow-up period 12.5 years; IQR: 7.8–13.1), 890 total deaths, 400 CVD deaths, and 321 incident MIs occurred in men; the corresponding numbers in women were 442, 187, and 102 (Table 2). Table 2 also describes the observed crude incidence rates for the different outcomes by categories of kidney function. Men and women with CKD had higher crude rates for all-cause mortality, CVD mortality, and first ever MI compared with men and women without CKD. In all categories and for all outcomes, the crude incidence rates were higher in men than in women. Kaplan–Meier survival analysis showed a greater probability of an incident MI, CVD mortality, and all-cause mortality in men and women with CKD (Figures 1–3).
(A) Survival curves for incident MI by eGFR category. MONICA/KORA Cohort Study, men aged 45–74 years at baseline. (B) Survival curves for incident MI by eGFR category. MONICA/KORA Cohort Study, women aged 45–74 years at baseline.
(A) Survival curves for CVD mortality by eGFR category. MONICA/KORA Cohort Study, men aged 45–74 years at baseline. (B) Survival curves for CVD mortality by eGFR category. MONICA/KORA Cohort Study, women aged 45–74 years at baseline.

(A) Survival curves for all-cause mortality by eGFR category. MONICA/KORA Cohort Study, men aged 45–74 years at baseline. (B) Survival curves for all-cause mortality by eGFR category. MONICA/KORA Cohort Study, women aged 45–74 years at baseline.
Baseline characteristics by gender and level of kidney function
| eGFR Group (mL/min/1.73 m2) | Men (n=3860) | Women (n=3674) | ||||
|---|---|---|---|---|---|---|
| 15–59 (n=480) | ≥60 (n=3380) | P-value | 15–59 (n=753) | ≥60 (n=2921) | P-value | |
| Age (years) | 62.4 (8.2) | 57.2 (7.9) | <0.0001 | 61.5 (7.2) | 56.6 (7.8) | <0.0001 |
| Education (<12 years, %) | 70.8 | 70.7 | 0.9557 | 88.2 | 88.5 | 0.8087 |
| BMI (kg/m2) | 28.2 (3.5) | 27.8 (3.5) | 0.0269 | 28.4 (4.6) | 27.6 (4.8) | 0.0001 |
| History of diabetes (%) | 9.4 | 6.8 | 0.0379 | 6.9 | 5.5 | 0.1340 |
| History of CVD (%) | 11.5 | 6.0 | <0.0001 | 4.1 | 1.8 | 0.0002 |
| Actual hypertension (%) | 62.3 | 54.7 | 0.0017 | 55.5 | 46.5 | <0.0001 |
| Use of anti-hypertensive agents (%) | 39.6 | 19.1 | <0.0001 | 35.2 | 21.2 | <0.0001 |
| Alcohol intake (%) | ||||||
| 0 g/day | 21.9 | 16.6 | <0.0001 | 52.7 | 47.8 | 0.0144 |
| 0.1–19.9 g/day (women), 0.1–39.9 g/day (men) | 57.5 | 49.0 | 33.9 | 35.0 | ||
| ≥20 g/day (women), ≥40 g/day (men) | 20.6 | 34.4 | 13.4 | 17.2 | ||
| Regular smoking (%) | 15.8 | 24.8 | <0.0001 | 8.5 | 12.9 | 0.0008 |
| Physically active (%) | 33.5 | 37.3 | 0.1122 | 30.0 | 30.4 | 0.8509 |
| Dyslipidaemia (%) | 54.6 | 48.1 | 0.0079 | 32.5 | 24.3 | <0.0001 |
| Serum creatininea | 1.5 (1.2) | 1.0 (1.1) | <0.0001 | 1.1 (1.2) | 0.8 (1.1) | <0.0001 |
| Serum uric acid | 6.4 (1.4) | 5.7 (1.3) | <0.0001 | 5.0 (1.3) | 4.1 (1.1) | <0.0001 |
| eGFR | 52.4 (7.2) | 80.9 (13.7) | <0.0001 | 51.9 (7.5) | 77.6 (12.8) | <0.0001 |
aGeometric mean.
Outcomes by level of kidney function
| eGFR (mL/min/1.73 m2) | Men | Women | ||
|---|---|---|---|---|
| 15–59 | ≥60 | 15–59 | ≥60 | |
| Incident MI | ||||
| Number of participants | 441 | 3 221 | 737 | 2 894 |
| Events | 46 | 275 | 31 | 71 |
| Person-years (PY) | 3 141 | 32 703 | 6 438 | 30 975 |
| Events/10 000 PY | 146.5 | 84.1 | 48.2 | 22.9 |
| All-cause mortality | ||||
| Number of participants | 480 | 3 380 | 753 | 2 921 |
| Events | 144 | 746 | 128 | 314 |
| Person-years (PY) | 4 373 | 38 321 | 8 270 | 34 886 |
| Events/10 000 PY | 329.3 | 194.7 | 154.8 | 90.0 |
| CVD mortality | ||||
| Number of participants | 480 | 3 380 | 753 | 2 921 |
| Events | 83 | 317 | 72 | 115 |
| Person-years (PY) | 4 373 | 38 321 | 8 270 | 34 886 |
| Events/10 000 PY | 189.8 | 82.7 | 87.1 | 33.0 |
In Cox proportional hazards analyses the age- and survey-adjusted HRs were significantly increased for incident MI and CVD mortality in women with CKD compared with women with preserved renal function. In men, CKD was also significantly associated with incident MI and CVD mortality in age- and survey-adjusted analysis. After multivariable adjustment, the independent associations remained significant in both sexes (Table 3). In contrast, men and women with CKD had no significantly increased risk of all-cause mortality.
HRs (95% CI) for outcomes in men and women with CKD
| Variable | Age- and survey-adjusted | Multivariable-adjusteda |
|---|---|---|
| Incident MI (fatal and non-fatal) | ||
| Men | 1.50 (1.09–2.08) | 1.51 (1.09–2.10) |
| Women | 1.75 (1.13–2.71) | 1.67 (1.07–2.61) |
| All-cause mortality | ||
| Men | 1.17 (0.97–1.41) | 1.17 (0.97–1.41) |
| Women | 1.16 (0.94–1.44) | 1.12 (0.90–1.39) |
| CVD mortality | ||
| Men | 1.55 (1.20–2.00) | 1.48 (1.15–1.92) |
| Women | 1.74 (1.28–2.35) | 1.60 (1.17–2.18) |
aAdjusted for age, survey, history of diabetes, regular smoking, BMI, alcohol intake, actual hypertension, physical activity, and dyslipidaemia; outcomes all-cause and CVD mortality: additional adjustment for history of CVD.
When eGFR was included as a continuous variable in the Cox proportional hazard models, in men an increment of 10 mL/min/1.73 m2 of eGFR was associated with a significant decrease in the risk of an incident MI (HR 0.91; 95% CI 0.84–0.99), but not with a significant decrease in CVD mortality (HR 0.96; 95% CI 0.89–1.03) and all-cause mortality (HR 1.04; 95% CI 0.99–1.08) after multivariable adjustment. In women, an increase of 10 mL/min/1.73 m2 of eGFR was significantly associated with incident MI (HR 0.88; 95% CI 0.77–1.00) and CVD mortality (HR 0.85; 95% CI 0.78–0.94), but not with all-cause mortality (HR 0.97; 95% CI 0.91–1.04) in multivariable adjusted analyses.
Discussion
The present large population-based study confirmed associations of reduced eGFR and increased risk of CVD mortality. The risk associated with CKD was apparent in men and women from the general population. In addition, this study showed a strong association between CKD and first ever coronary heart disease event in men and women without a history of MI independent of traditional cardiovascular risk factors. However, the present findings did not provide support for a significant relationship between CKD and all-cause mortality in both sexes.
Prior studies including subjects at high risk for CVD consistently demonstrated an independent association between reduced level of kidney function and CVD events, as well as CVD mortality.7,20–22 However, previous community-based studies have shown discordant results.8–12 Because of the different methods of estimating GFR used in the hitherto existing studies direct comparisons between the investigations are difficult. Some studies used serum creatinine levels as a marker of renal function,8,9,23 other examinations were based on the Cockcroft–Gault equation.13 In accordance with some recent studies,10–12 in the present study the modification of Diet in Renal Disease (MDRD)Study equation for GFR was used, because it has been thoroughly validated in adults.1
The Framingham Heart Study9 showed that serum creatinine levels between 136 and 265 µmol/L for men and between 120 and 265 µmol/L for women were associated with all-cause mortality in men, but not in women. Furthermore, in multivariable analyses baseline kidney disease was not associated with incident CVD events or CVD mortality.9 Also, the National Health and Nutrition Examination Survey (NHANES) I follow-up study8 observed a significant association between moderate renal insufficiency, defined as a creatinine of 122 to 177 µmol/L in men and 104 to 146 µmol/L in women, and all-cause as well as CVD mortality in unadjusted analyses. However, after adjustment for traditional cardiovascular risk factors both associations lost significance. Therefore, the authors concluded that the relationship between moderate renal insufficiency and CVD, demonstrated in other epidemiologic studies, appears to be due to co-occurrence of renal insufficiency with traditional cardiovascular risk factors. In contrast to these studies, the British Regional Heart Study observed an association between serum creatinine and CVD mortality in middle-aged men with a baseline serum creatinine level of ≥130 µmol/L (HR 1.4, 95% CI 1.0–2.1) when compared with men with baseline serum creatinine values <116 µmol/L.23 Muntner et al.11 investigated the association between MDRD-calculated GFR, and CHD and CVD mortality among NHANES II participants. Compared with subjects with a GFR ≥90 mL/min subjects with a baseline GFR <70 mL/min had a significantly increased risk of both CHD mortality (HR 1.68, 95% CI 1.23–2.30) and CVD mortality (HR 1.68, 95% CI 1.33–2.13) in multivariable analysis. Moreover, the level of GFR was an independent risk factor for atherosclerotic cardiovascular disease (ASCVD) and de novo ASCVD in the Atherosclerosis Risk in Communities (ARIC) Study.12 The Hoorn Study showed that mild-to-moderate loss of renal function is strongly associated with an increased risk of cardiovascular mortality even after adjustment for traditional cardiovascular risk factors, markers of inflammation, and markers of endothelial dysfunction.13 Finally, recently a pooled analysis of four community-based longitudinal studies (ARIC, Cardiovascular Health Study, Framingham Heart Study, and Framingham Offspring Study) found that in adjusted analyses CKD was a risk factor for the composite outcome of all-cause mortality and CVD in the general population (HR 1.19; 95% CI 1.07–1.32). In contrast to the present study, that study was very large, and therefore it had sufficient power to investigate the effect of CKD on all outcomes in subjects without CVD at baseline.10
The present results are in line with the hypothesis that renal function itself is implicated in the association with cardiovascular disease. Because we did not observe a significant relationship between CKD and all-cause mortality it can be assumed that CKD is a specific independent predictor of cardiovascular events and not an unspecific marker of health status or unhealthy lifestyle. The reasons for the high cardiovascular risk in persons with CKD remain unknown.24 A possible explanation could be that a decrease in renal function may be associated with other non-traditional risk factors that were not taken into consideration in this study. Such factors include for example, changes in coagulation, lipids, endothelial dysfunction, homocysteine and/or the presence of anemia, oxidative stress, and inflammation.24,25 On the other hand, CKD may be the result of both duration and severity of other causes of cardiovascular disease, such as hypertension. Thus, reduced kidney function may reflect residual confounding from CVD risk factors. Furthermore, it is thinkable that CKD may exacerbate the effect of CVD risk factors and may, therefore, promote the atherosclerotic process.
The MONICA/KORA Augsburg Study has several limitations that need to be considered. Although we adjusted for a variety of confounders, confounding by unmeasured variables cannot be excluded. Particularly, no data on recently identified CVD risk factors, such as CRP and homocysteine, could be taken into consideration. Prior studies have shown that estimates of GFR depend critically upon the accuracy and precision of the creatinine measurement used in their calculation.26 In the present study, the definition of CKD was based on a single measurement of serum creatinine at baseline examination; thus, misclassification bias cannot entirely be ruled out. Because the study was limited to men and women of German nationality between 45 and 74 years of age, caution should be used in generalizing these results to other populations and other age-groups, respectively. The strengths of the MONICA/KORA Augsburg Cohort Study are primarily its prospective design, the representativeness of the cohort, based on a random sample of the general population and the availability of data on lifestyle and multiple cardiovascular risk factors.
In conclusion, the present study showed that CKD is strongly associated with an increased risk of incident MI and CVD mortality in men and women from the general population. The underlying mechanism behind this relationship is unclear but seems to be independent from common risk factors such as hypertension, diabetes, smoking, BMI, alcohol intake, physical activity, and dyslipidaemia. Thus, estimation of GFR in addition to the consideration of present conventional risk factors may be a valuable tool for individual cardiovascular risk assessment. Further studies are needed to investigate the pathophysiological mechanisms underlying this association.
Acknowledgements
The KORA research platform and the MONICA Augsburg studies were initiated and financed by the GSF—National Research Center for Environment and Health, which is funded by the German Federal Ministry of Education, Science, Research and Technology and by the State of Bavaria. Morbidity and Mortality follow-ups in 1997/98 and 2002/03 were in addition supported by grants from the Federal Ministry of Education, Science, Research and Technology (01 ER 9701/4) and the German Research Foundation (DFG) (TH 784/2-1), respectively. We thank all members of the GSF Institute of Epidemiology and the field staff in Augsburg who were involved in the planning and conduct of the study. Finally, we express our appreciation to all the study participants.
Conflict of interest: none declared.
References
El Nahas AM, Bello AK.
WHO MONICA project: objectives:design.
Clinical practice guidelines for chronic kidney disease:
Al Suwaidi J, Reddan DN, Williams K, Pieper KS, Harrington RA, Califf RM, Granger CB, Ohman EM, Holmes DR.

