


Abstract
Background. Regular preventive health screenings are a feature of primary health care in several countries. Studies of the effect of regular preventive health checks have reported different results regarding primary health care utilization.
Objective. To analyse the effect of preventive health screening and health discussions on contacts to general practice.
Methods. A randomized controlled trial with all GPs in the district of Ebeltoft, Denmark. All middle-aged residents registered with a GP in the district of Ebeltoft were included (n = 3464). A random sample of 2030 subjects was selected for invitation to participate in health screening or health screening and discussions. The remaining 1434 subjects were never contacted and served as an external control group. Main outcome measure was number of daytime consultations in general practice.
Results. The annual rate ratios for daytime consultations showed a very clear time trend (P < 0.0001) with a high rate of contacts among invited compared with non-invited subjects during the first year (P = 0.001) followed by a gradual decrease to a lower level after eight years (P = 0.037). The total rate ratio for daytime consultations was 1.01 (95% CI 0.93 to 1.10).
Conclusion. We observed no differences between the invited group and the non-invited group in any type of contact to general practice when the entire follow-up period was considered. There was a significant trend in rate ratios for daytime consultations with an initial rise followed by a gradual decrease in rate ratios. More investigations are needed to confirm and explore reasons for this trend.
Thomsen JL, Parner ET, Karlsmose B, Thulstrup AM, Lauritzen T and Engberg M. Effect of preventive health screening on long-term primary health care utilization. A randomized controlled trial. Family Practice 2005; 22: 242–248.
Introduction
Primary prevention strategies targeting hypertension, obesity, smoking habits, diet and cholesterol, problem drinking, physical activity and hearing impairment have all been found to be useful when devised as single interventions,1,2 and health screening is recommend for the middle-aged population as a feature of general health service in a number of countries.1–4 Only few investigations have examined how such single interventions interact when targeted at apparently healthy middle-aged people, and how preventive health screenings may affect primary health care utilization. Periodic health screening was found to be associated with an increase in health care utilization and costs in a non-randomized study,5 but two randomized clinical trials found intervention and control groups to have largely similar general practice consultations rates.6,7 Participation in screening studies demands willingness and strength and is reportedly associated with better survival,8 higher social status,9 and higher primary care utilization.9 We therefore designed a study aiming at comparing the morbidity of a random group of people invited to participate in general health screenings with that of people who were not contacted. A population's morbidity is reflected, among others, in the rate of GP visits10,11 and when a control group is to remain non-contacted, register information on GP contacts becomes a relevant tool for measuring the population's morbidity. The Danish health care registers afford us an unique opportunity for investigating the possible effectiveness12 of preventive health screenings on reducing utilization of primary health. Novel attention to the long-term effect of screening is also warranted by the further development of statistical tools since the previous randomized trials were conducted.13 The objective of this study is therefore to analyse the effect of regular preventive health screening and health discussions on primary health care utilisation using models developed for the analysis of longitudinal data on recurrent events.
Methods
Study setting, selection of subjects and random allocation
The Ebeltoft Health Promotion Project was designed as a randomized controlled trail, performed in the district of Ebeltoft, Aarhus County, Denmark. All nine GPs from the four practices in the district participated. Potential participants were identified through the Civil Registration System, which registers all Danish citizens by a personal identity number. All residents aged 30 to 49 years (1 January 1991) registered with a GP in the district of Ebeltoft (n = 3464) were included. A random sample of 2030 subjects was selected for invitation to participate in the study (‘invited’). A small group of 30 persons did not receive proper invitation for various administrative reasons. To obtain an intention to treat analysis, these 30 persons were kept in the invited group. The remaining 1434 persons were never contacted and were used as an external control group (‘non-invited’). Persons accepting to participate were randomly divided into one internal control group (‘questionnaire’) and two intervention groups (‘health screening’; ‘health discussion’) (Fig. 1). The sample size was limited by the number of residents in the district of Ebeltoft. Blinding was not possible because of the type of intervention. An Aarhus County statistician performed invitation and intervention randomization by computer, independently of the investigators. Randomization of questionnaire and intervention group participants was performed in a stratified manner on the basis of the practice in which they were registered, sex, age, body mass index (BMI), and cohabitation status as stated by the respondents in the invitation questionnaire. The study population was similar to the average Danish population.14
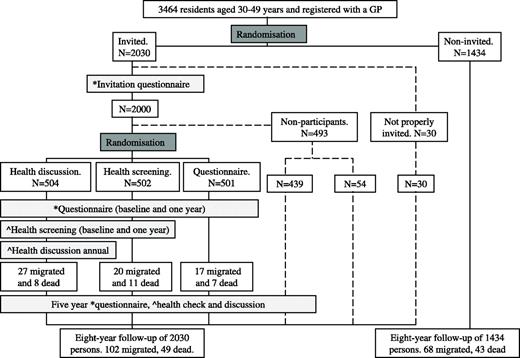
Design of Health Promotion Project Ebeltoft. Dark grey boxes: randomization. Light grey boxes: intervention (*questionnaires sent, ^health checks and/or discussions offered). Dashed line: persons randomized for invitation, but not participating
Interventions and study outcomes
Subjects randomized for invitation were sent an invitation questionnaire in September 1991. All subjects accepting participation also received questionnaires concerning health, health beliefs, and social and demographic factors at baseline, and after one and five years. Participants in the two intervention groups were offered a health screening at baseline, and after one and five years. After five years all persons accepting participation or accepting only further contact received a questionnaire and an invitation to have a health screening and a health discussion (Fig. 1). Health screenings were performed by a specially trained laboratory technician in one of the participating practices and included an evaluation of cardiovascular, pulmonary, liver and kidney function together with an evaluation of endocrine dysfunction, BMI, physical endurance, hearing and sight (Table 1). Within three weeks after the screenings, all attending persons received a written response from their GP explaining the tests. Advice specifically addressing lifestyle changes was included if the test results were outside a predefined normal range. After the health screenings, the participants of one of the two intervention groups were invited to participate in a 45-minute health discussion with their GP. The health discussions primarily aimed at discussing health problems related to lifestyle and gave the participant an opportunity to define up to three goals related to life style changes. Further details of design and interventions are described elsewhere.14
Investigations performed during the three health checks
| Body Mass Index |
|---|
| Blood pressure |
| Sight (Snellen test) |
| Hearing (screening audiometer) |
| Electrocardiogram (resting) |
| CO-concentration in expiratory air |
| Lung function (spirometri) |
| Liver function (enzymes) |
| Creatinine level |
| Urate level |
| Non-fasting blood glucose |
| Total cholesterol level |
| Urine dipstick (glucose, albumin, blood) |
| HIV status |
All included subjects (n = 3464) were followed through the National Health Insurance Service Register,15 which records all contacts to general practice for all citizens in Aarhus County, Denmark. Outcomes were daytime consultations, daytime telephone consultations, evening and night telephone consultations, and evening and night consultations/home visits, excluding screening visits.
Data analysis and statistics
We did two main comparisons: one between the invited and the non-invited group, the other between the two intervention groups (health screening; health discussion) and the questionnaire group. The time at risk was calculated from 1 January 1992 to 31 December 1999 for the first comparison, and from 1 January 1992 to 31 December 1997 for the second, as the questionnaire group and the two intervention groups were offered a health check and a discussion as part of the five-year evaluation. Subjects were censored in case of death, emigration or disappearance on the date given in the Danish Civil Registration System. Data were analysed using Stata Statistical Software: Release 7.0 (Stata Corporation 1999). The numbers of contacts to general practice were compared by ratios of rates with 95% confidence intervals (CI). Rate ratios were calculated as intention to treat using a Poisson model with a random effect using a robust estimation procedure16 to account for several events being studied on the same person. Rate ratios for daytime consultations are quoted on an annual basis, data on less frequent forms of contact on a two-year basis.
The test for trend was done in two steps, exploring first whether rate ratios would present on a zero slope constant line and, if so, a second test was performed to examine whether this constant line was different from one.
Data for subjects lost to follow-up were compared using the chi-square test for proportions or the Mann–Whitney test for non-parametric data. For significance a level of P < 0.05 was chosen.
Permission to conduct the study was given by the Scientific Ethical Committee of Aarhus County (J. no. 1990/1966) and the Danish Data Protection Agency (J. no. 2001–41–0738).
Results
Baseline characteristics are listed in Table 2. The proportion of subjects followed-up was 95% with 170 subjects leaving the study during the eight-year period (Fig. 1). The number of people lost to follow-up was not significantly different among the invited and non-invited groups (P = 0.70) or among the questionnaire and intervention groups (P = 0.13). Characteristics for subjects lost to follow-up were equal among the randomized groups considering sex, age, BMI, and proportion of smokers and cohabitation (data not shown).
Baseline characteristics of registered persons by trial group
| Questionnaire | Health screening | Health discussion | Non-participants | Invited | Non-invited | |
|---|---|---|---|---|---|---|
| Persons | 501 | 502 | 504 | 493 | 2030 | 1434 |
| Women (%) | 259 (52) | 258 (51) | 257 (51) | 194 (39) | 981 (48) | 708 (49) |
| Median age January 1991 (min–max) | 40 (30–49) | 39.5 (30–49) | 39 (30–49) | 40 (30–49) | 40 (30–49) | 41 (30–49) |
| Median BMI (min–max) | 24 (17–48) | 24 (16–36) | 24 (17–44) | – | – | – |
| Cohabitation (%) | 407 (82) | 410 (82) | 419 (84) | – | – | – |
| Smokers (%) | 257 (51) | 257 (51) | 270 (54) | – | – | – |
Values are n (%) unless otherwise stated. Data on BMI, cohabitation, and smoking are self-reported data from first questionnaire.
A total of 501 subjects (25% of those invited) and 443 subjects in the discussion group (88% of those randomized for health discussions baseline) participated in at least one health discussion, 1411 (70%) participated in a health check and 1669 (82%) answered at least one questionnaire.
The mean consultation rate to general practice during daytime over eight years was 2.90 (2.75 to 3.06) for the invited group compared to 2.86 (2.69 to 3.05) for the non-invited group. We observed no differences between the invited group and the non-invited group in terms of rate ratios for any type of contact to general practice when the entire follow-up period was considered (Table 3). However, annual rate ratios for daytime consultations showed a very clear time trend (P < 0.0001) with a high ratio in the first year (P = 0.001) followed by a gradual decrease to a significantly lower level in 1999 (P = 0.037) (Table 3). The same time trend applied for the two-year intervals for evening and night telephone consultations and evening and night consultations/home visits when comparing invited subjects with non-invited (Table 3). The two-year ratios for daytime telephone consultations did not change during the follow-up period (P = 0.12).
Rate ratios (95% CI) for the invited group compared with the non-invited group
| Health care | Group | 1992 | 1993 | 1994 | 1995 | 1996 | 1997 | 1998 | 1999 | Test for trend | January 1992 to December 1999 | ||||
|---|---|---|---|---|---|---|---|---|---|---|---|---|---|---|---|
| Daytime consultations | Invited compared with non-invited | 1.24* (1.12–1.38) | 1.10 (0.97–1.24) | 1.08 (0.96–1.22) | 1.04 (0.91–1.19) | 0.97 (0.87–1.10) | 0.96 (0.85–1.08) | 0.91 (0.81–1.02) | 0.91* (0.83–0.99) | P < 0.0001 | 1.01 (0.93–1.10) | ||||
| Daytime telephone-consultations | Invited compared with non-invited | 1.04 (0.90–1.19) | 0.99 (0.86–1.14) | 0.96 (0.85–1.09) | 0.98 (0.88–1.11) | P = 0.1228 | 1.00 (0.89–1.12) | ||||||||
| Evening and night telephone-consultations | Invited compared with non-invited | 1.67 (0.91–3.06) | 1.48 (0.98–2.23) | 0.79 (0.61–1.03) | 1.02 (0.90–1.15) | P < 0.0001 | 1.26 (0.83–1.90) | ||||||||
| Evening and night consultations/home-visits | Invited compared with non-invited | 1.33 (0.79–2.25) | 1.15 (0.88–1.50) | 0.97 (0.76–1.24) | 1.02 (0.90–1.16) | P = 0.0010 | 1.09 (0.89–1.34) | ||||||||
P < 0.05. Rate ratios for daytime consultations are quoted on an annual basis, data on less frequent forms of contact on a two-year basis.
There was no difference in mean daytime consultations between the health screening [2.94 (2.69 to 3.21)] and the questionnaire group [2.89 (2.65 to 3.16)] during the six-year follow-up period for these groups (P = 0.83), but the health discussion group had a significantly higher rate of daytime consultations [3.34 (3.05 to 3.64)] than the questionnaire group (P = 0.04) (Table 4). Annual rate ratios showed a clear time trend for both the health screening (P < 0.0001) and the health discussion group (P < 0.0001). The ratios were significantly higher than the questionnaire group in 1992 (P < 0.001 for both). The ratios saw a gradual decrease over time and reached the lowest point in 1997 (P = 0.02 for health screening and P = 0.56 for health discussion). Considering the entire six-year period, we observed no differences in any type of contacts between the questionnaire group and either the health screening or the health discussion group (Table 4). No significant trends were observed for the two-year intervals for contacts other than daytime consultations, except for evening and night consultations/home visits for the health screening group compared with the questionnaire group (Table 4).
Rate ratios (95% CI) for health screening and health discussion group compared to questionnaire group
| Health care | Group | 1992 | 1993 | 1994 | 1995 | 1996 | 1997 | Test for trend | January 1992 to December 1997 | |||
|---|---|---|---|---|---|---|---|---|---|---|---|---|
| Daytime consultations | Health screening compared with questionnaire | 1.34* (1.15–1.56) | 0.96 (0.77–1.21) | 0.96 (0.80–1.15) | 0.93 (0.75–1.14) | 0.98 (0.81–1.18) | 0.82* (0.69–0.97) | P < 0.0001 | 1.01 (0.89–1.15) | |||
| Discussion compared with questionnaire | 1.55* (1.33–1.81) | 1.10 (0.88–1.38) | 1.11 (0.92–1.33) | 1.08 (0.88–1.33) | 0.97 (0.81–1.17) | 0.95 (0.80–1.12) | P < 0.0001 | 1.15* (1.02–1.31) | ||||
| Daytime telephone-consultations | Health screening compared with questionnaire | 1.10 (0.87–1.39) | 1.05 (0.83–1.32) | 1.03 (0.83–1.28) | P = 0.4202 | 1.09 (0.88–1.35) | ||||||
| Discussion compared with questionnaire | 1.02 (0.81–1.30) | 0.97 (0.77–1.23) | 0.99 (0.80–1.24) | P = 0.7950 | 1.01 (0.82–1.24) | |||||||
| Evening and night telephone-consultations | Health screening compared with questionnaire | 1.03 (0.66–1.61) | 0.84 (0.54–1.31) | 0.82 (0.57–1.18) | P = 0.8916 | 0.91 (0.65–1.28) | ||||||
| Discussion compared with questionnaire | 0.87 (0.55–1.37) | 1.04 (0.68–1.60) | 1.04 (0.73–1.48) | P = 0.4254 | 0.98 (0.70–1.38) | |||||||
| Evening and night consultations/home-visits | Health screening compared with questionnaire | 1.98 (0.72–5.47) | 1.16 (0.71–1.88) | 1.03 (0.68–1.56) | P = 0.0015 | 1.49 (0.79–2.81) | ||||||
| Discussion compared with questionnaire | 1.19 (0.43–3.30) | 1.42 (0.88–2.28) | 1.04 (0.69–1.59) | P = 0.3057 | 1.16 (0.74–1.81) | |||||||
P < 0.05. Rate ratios for daytime consultations are quoted on an annual basis, data on less frequent forms of contact on a two-year basis.
Discussion
The traditional role for randomized trials is to assess the efficacy of intervention.12 The present design allowed us to explore both the possible effectiveness as well as the efficacy of regular health screening on the number of contacts to general practice in an intention to treat set-up. Investigation of annual rate ratios for daytime consultations in general practice showed a highly significant trend with the ratios for the invited group gradually decreased from 1992 to 1999 compared to the non-invited group.
This study is, to our knowledge, the first to report the effect of preventive health screening on telephone contacts or evening and night contacts to general practice. The same trend over time as seen for daytime consultations comparing invited and non-invited subjects applied to both evening and night telephone consultations and consultations/home visits. On the one hand, the initial increase in evening and night contacts may be explained by a lowering of the barrier for contacting health care authorities and a growing positive attention to health. This is supported by the five-year evaluation, which showed a significant reduction in risk factors for cardiovascular disease in the intervention groups.17 On the other hand, doctor-initiated search for unrecognized disease in healthy individuals carries a risk of possible side-effects such as increased anxiousness and sickness18,19 which may have served to raise the contact rate. However, information about the increased risk of ischemic heart disease in 40 to 49 year old Danish men undergoing health examination in general practice did not affect their reported psychological well-being six months after the examination.20
Comparison in an intention to treat analysis of the questionnaire group with either the health screening or the health discussion group gave us the opportunity of examining the possible efficacy12 of the two different interventions in reducing the number of contacts to general practice over six years. We observed no overall increase in the investigated parameters between the questionnaire group and the health screening group or the discussion group, except for daytime consultations, where the discussion group saw a significant increase in rate ratios over six years compared with the questionnaire group. This may be explained by a lowering of the barrier for contact to the GP following the offer of health discussions. The increase may also be rooted in greater anxiousness, but we consider this as a less likely explanation because we observed no increase in the daytime or evening and night telephone consultations and no increase in daytime contacts in the health screening group. Furthermore, there was no difference in psychological reaction to information about increased risk of coronary heart disease in the intervention groups compared to the questionnaire group.21
This study is partly in agreement with other studies concerning preventive health screening and contacts to general practice.6,7,2,23 A randomized controlled trial of multiphasic screening23 reported no increase in physician consultations during a one-year follow-up period despite an average of 3.6 abnormal test values per person partly because only 15% triggered therapeutic intervention as reported by the participating physicians. The South-East London Screening Study group found no difference in general practice consultation rates over a period of nine years,6,22 which confirms our results for the entire period. The South-East London Screening study did not quote annual rate ratios, but they may be expected to tailor the trend seen in our study's first six years as design and degree of participation resemble the comparison between the questionnaire group and the health screening group. Analysis of annual rates in the Multiphasic Checkup Evaluation Study7 showed a trend less clear than reported in the present study; presumably because 20–40% of the members in its control group were participating in annual health screenings.
We achieved a very high degree of follow-up as the National Health Insurance Service Register covers all contacts to general practice in Aarhus County.15 There were more health discussion group participants than other participants who moved out of the county during the study period, but the difference fell short of statistical significance. This may introduce some degree of selection bias in the comparison between the questionnaire and the intervention groups, as the persons moving may be healthier than the persons staying. This bias would tend to work against finding an intervention effect. The National Health Insurance Service Register enjoys good validity,15 which minimises the risk of information bias. The relatively small sample decreased the ability of the study to firmly establish a decreasing effect of intervention during the entire eight-year period. An effect may be ascertained with a longer follow-up period as we observed a decreasing trend for several types of contacts.
Health screenings are apparently able to detect and reduce risk factors for disease,17,24 and several randomised trials,6,7,22,23 including the present study, have established that they do not entail an overall increase in primary health care utilization. There was a significant trend over time for most contact types, with an initial increase in contacts followed by a gradual decrease for daytime consultations and evening and night contacts. More investigations are needed to confirm and explore reasons for this trend.
Declaration
Funding: financial support for register-based investigations in relation to Health Promotion Project Ebeltoft was given by the County Health Insurance Office Aarhus, the Danish College of General Practitioners (Sara Krabbe scholarship), the Danish College of General Practitioners (Lundbeck scholarship), the Danish Research Foundation for General Practice, the General Practitioners Education and Development Fund, the Health Promotion Council of Aarhus, the Health Insurance Fund, the Lundbeck Foundation for scientific research grant to GPs, the Ministry of Health Foundation for Research and Development, the Danish Medical Research Council (9801336), and the Danish Heart Foundation (97–2-F-22515).
Ethical approval: permission to conduct the study was given by the Scientific Ethical Committee of Aarhus County (J. no. 1990/1966) and the Danish Data Protection Agency (J. no. 2001–41–0738).
Conflicts of interest: none.
The following GPs participated in the study: A Bøgedal, P Grønbæk, L Jørgensen, PT Jørgensen, H Lundberg, JM Nielsen, GS Pedersen, JC Rahbek, N Bie. We thank the staff at the GP clinics in Ebeltoft for their extraordinary effort, including the extensive administrative assistance given by A Hilligsøe and E Therkildsen. Contributors: TL originated and designed the Ebeltoft Health Promotion Project and was head of the project until 1997, where ME took over. JL Thomsen, B Karlsmose, AM Thulstrup, T Lauritzen, and M Engberg all contributed to the protocol for the register-based investigations. ET Parner made important contribution to the statistical analysis and interpretations. JL Thomsen collected register data, conducted the data analyses and drafted the text of the paper with the support of the other authors. JL Thomsen is the guarantor.
References
US Preventive Services Task Force. Guide to Clinical Preventive Services, 2nd ed. Washington, DC: Office of Disease Prevention and Health Promotion, US Government Printing Office;
The Canadian Task Force on the Periodic Health Examination. The Canadian Guide to Clinical Preventive Health Care. Ottawa: Minister of Supply and Services Canada, Canadian Government Publishing;
Nakanishi N, Tatara K, Fujiwara H. Do preventive health services reduce eventual demand for medical care?
Bernacki EJ, Tsai SP, Malone RD. Participation in a periodic physical examination program and group health care utilization and costs.
A controlled trial of multiphasic screening in middle age: results of the South-East London Screening Study.
Dales LG, Friedman GD, Ramcharan S, Siegelaub AB, Campbell BA, Feldman R et al. Multiphasic checkup evaluation study. 3. Outpatient clinic utilization, hospitalization, and mortality experience after seven years.
Tibblin G, Welin L, Larsson B, Ljungberg IL, Svardsudd K. The influence of repeated health examinations on mortality in a prospective cohort study, with a comment on the autopsy frequency. The study of men born in 1913.
Pill R, French J, Harding K, Stott N. Invitation to attend a health check in a general practice setting: comparison of attenders and non-attenders.
Fylkesnes K. Determinants of health care utilization—visits and referrals.
Segovia J, Bartlett RF, Edwards AC. An empirical analysis of the dimensions of health status measures.
Fletcher RH, Fletcher SW, Wagner EH. Clinical Epidemiology. The essentials. 3rd edn. Baltimore: Lippincott, Williams & Wilkins;
Lauritzen T, Leboeuf-Yde C, Lunde IM, Nielsen KD. Ebeltoft project: baseline data from a five-year randomized, controlled, prospective health promotion study in a Danish population.
Olivarius NF, Hollnagel H, Krasnik A, Pedersen PA, Thorsen H. The Danish National Health Service Register. A tool for primary health care research.
Engberg M, Christensen B, Karlsmose B, Lous J, Lauritzen T. General health screenings to improve cardiovascular risk profiles: a randomized controlled trial in general practice with 5-year follow-up.
Haynes RB, Sackett DL, Taylor DW, Gibson ES, Johnson AL. Increased absenteeism from work after detection and labeling of hypertensive patients.
Christensen B. Psychological reactions to information about risk of ischaemic heart disease in general practice.
Christensen B, Engberg M, Lauritzen T. No long-term psychological reaction to information about increased risk of coronary heart disease in general practice.
The South-East London Screening Study Group. A controlled trial of multiphasic screening in middle-age: results of the South-East London Screening Study. 1977.
Olsen DM, Kane RL, Proctor PH. A controlled trial of multiphasic screening.
Author notes
aDepartment and Research Unit of General Practice, University of Aarhus, 8000 C Aarhus, bDepartment of Biostatistics, University of Aarhus, 8000 C Aarhus and cDepartment of Clinical Epidemiology, Aarhus University Hospital and Aalborg Hospital, University of Aarhus, 8000 C Aarhus, Denmark
