


Abstract
Background. Because palpitations and light headedness often occur paroxysmally these complaints are difficult to diagnose. The hazards for a GP are too many diagnostic interventions for worried well and too few diagnostics for potentially life threatening complaints.
Objectives. Patient-activated memo event recorders have proved to be successful in diagnosing episodes of cardiac arrythmias in secondary care. We tested the diagnostic yield of these devices in general practice.
Methods. A randomized clinical trial in general practice. Consecutive patients with complaints of palpitations or light-headedness were randomized to either usual care or usual care plus event-recorder. The main outcome was the difference in explained episodes. Secondary outcomes were the differences in the number and character of cardiac diagnoses and the feasibility of the event-recorder.
Results. There were fewer patients without a diagnosis in the intervention group (17% vs 38%; RR = 0.5, 95% CI 0.3 to 0.7) and more patients with a cardiac diagnosis (67% vs. 27%: RR 2.5, CI 1.8 to 3,5). More relevant cardiac arrhythmias were detected (22% vs 7%) with event recording than with usual care (RR 3.2, 95% CI 1.5 to 6.8).
Conclusion. Patient-activated loop recorders are feasible and effective diagnostic tools in patients with palpitations or light-headedness in primary care. More research into patient characteristics and selection criteria is needed to fine-tune the use of these devices in primary care.
Introduction
About 8/1000 patients per year visit their GP with symptoms suggestive of a cardiac arrhythmia, such as palpitations, rapid heart rate, and feelings of light-headedness or fainting.1 Mostly the underlying condition is benign, but it can be a manifestation of a clinically significant arrhythmia. Establishing a diagnosis is often difficult because the medical history may not be accurate,2 most complaints occur paroxysmally and the predictive value of many signs and symptoms is low.3,4 The investigation of choice is an ECG during a symptomatic period, but–even under optimal circumstances–this is only possible in about a third of patients.4 If an ECG is performed during symptoms, 48% of patients appear to have a rhythm abnormality (19% of clinical relevance) compared with 20% (13% of clinical relevance) in the patients without an ECG.4 For GPs it is difficult to decide between referral for further investigations or watchful waiting. The challenge for GPs is to identify those patients, who are at risk for cardiac morbidity without performing excessive tests on all patients. The pitfalls include missing a relevant cardiac diagnosis, excessive testing in worried but otherwise healthy persons, and incorrectly labelling of people with anxiety or panic disorder with consequent inappropriate treatment.5,6
In secondary care settings, the patient triggered continuous-loop event recorder (CER) is an effective tool for detecting arrhythmias associated with infrequent symptoms.7–9 It is more sensitive than the classic Holter method because it can be used for longer periods of time and normal daily activities are less disturbed.10 A non-randomised study among GPs reported that a cardiac diagnosis could be made in 30% of all consecutive patients presenting with palpitations during two weeks of monitoring with a patient activated recorder (RhythmCard), but no gain compared to usual care could be demonstrated.3 Furthermore, ruling out a cardiac abnormality by documenting sinus rhythm during episodes of typical complaints can improve management in these patients.
The aim of this randomised study is to evaluate the feasibility and clinical usefulness of CERs for establishing the cause of new episodes of palpitations or feelings of light-headedness in a general practice setting.
Methods
In the Dutch health care system all inhabitants are enlisted with a GP of their choice and in case of health related complaints or questions this physician will be the first to be consulted. As a consequence Dutch GPs will receive an unselected case load of symptoms and signs. Consecutive patients who consulted their GP for a new episode of palpitations and/or light-headedness were recruited from October 1999 until June 2002. Palpitations were defined as any feeling of an abnormal heartbeat or rhythm. Light headedness was defined as feelings of faintness or going to faint. Patients younger than 18 years, fitted with a pacemaker, being currently treated by a cardiologist, or needing immediate intervention and/or referral were excluded. The need for immediate intervention/referral was at the clinical judgement of the attending GP. Patients with clear syncope were excluded because they will not be able to activate the recorder. The GP obtained informed consent. GP's did not obtain an ECG, but sent participants to the research centre at the same day, where a standardised medical history and routine ECG was obtained. If the routine ECG did not show an explanation for their complaints, patients were computer randomised, stratified for their GP. Patients in the intervention group received a CER and usual care from their GP and patients in the control group received only usual care by their GP. The GP's completed questionnaires relating patient's complaints, GP diagnosis, referrals and interventions at baseline, six weeks (when the recording period was completed) and six months. The medical ethical committee of the Academic Medical Centre in Amsterdam approved the study.
Intervention
We used a Card Guard CG-6106 loop recorder. This recorder continuously registers and updates a two lead ECG. When a patient chooses to activate the recorder it stores information 30 seconds before and 2 minutes after the moment of activation. A maximum of three registrations could be stored in the memory, hereafter an acoustic signal indicated that the memory was fully stored. Only after sending the ECGs by telephone could the memory be overwritten.
The intervention group received a recorder and training on how to use the device. Patients were asked to wear the recorder continuously. For quality assurance patients made a training ECG at home and sent it by telephone to the research centre. If necessary, this procedure was repeated until a good quality ECG was obtained. Each week all patients had to send in a test ECG to ensure the event recorder was working well. The patients were instructed to make a recording and send it to the research centre every time they experienced symptoms similar to the ones for which they consulted the GP. They could use the CER for a maximum period of four weeks. The procedure was stopped earlier if an ECG was diagnostic or three good-quality recordings without abnormalities were obtained during symptomatic periods. All ECGs were immediately assessed by trained health professionals who could take action if necessary. In addition all the ECGs were reviewed and classified by an experienced cardiologist, who was informed about the symptoms of the patient. These reviewed results were sent to the GP.
The GP maintained responsibility for patient care during the study in both the intervention and control group and could use all regular health care interventions (including referral to cardiologists).
ECG findings, data collection, and analysis plan
If the event ECGs gave a clear explanation of the symptoms, patients were instructed to contact their GP. Arrhythmias were defined as all rhythms that were not normal sinus rhythm and not between 60–100 beats per minute. A relevant arrhythmia was one for which treatment and/or further investigation was needed. This constituted one of the following: paroxysmal atrial fibrillation (AF), atrial flutter, atrial tachycardia, other supraventricular tachycardia (SVT), and ventricular tachycardia. Less relevant arrhythmias included premature beats (ventricular or atrial), bradycardia and sinus tachycardia. We considered the outcome as inconclusive if patients did not have any symptoms during four weeks or if they were not able to register a good quality ECG during symptoms.
Our main outcome measure was the number of explained episodes in both groups, as registered by the GP after six months. We calculated that to detect a difference of 50% explained episodes in the control group and 70% in the intervention group 103 patients in each arm (α = 0.05 and β = 0.2) would be required. Our secondary outcomes focussed on the difference in frequency of (relevant) cardiac diagnoses between the intervention and control group. We assessed the feasibility of the patient loop recorder by examining the proportion of patients that were not capable to activate the recorder during symptoms or where the activation failed, and the proportion of recordings with inadequate quality to make a diagnosis.
Statistical methods
Statistical analysis was conducted using SPSS for Windows version 10. Analysis was on an intention to treat basis. To examine whether a difference in the distribution of diagnoses after 6 months between the two interventions existed, we performed an overall chi-square test. We used relative risks and 95% confidence intervals to quantify the difference in proportions of patients with a specific type of diagnosis between both groups.
Results
General characteristics
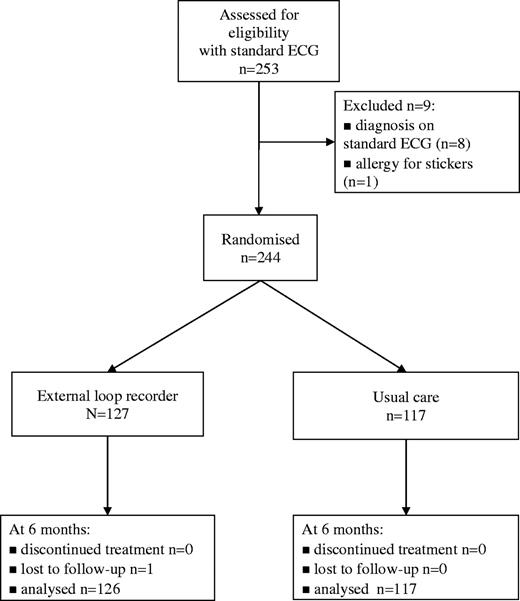
During the study period, 69 GPs sent 253 patients to the research centre. Their symptoms were rapid pulse (n = 165), missed beats (n = 131) and light-headedness (n = 83). Only seven patients complained about pounding. In 3% of patients (8/253) a diagnosis was established with the initial routine ECG: atrial fibrillation (n = 1), runs of ventricular extra systoles (n = 4) and other rhythm abnormalities needing further investigation by a cardiologist (n = 3). One patient was excluded because of an allergy to the stickers. The remaining 244 patients were randomised (Fig. 1). Baseline characteristics of these patients are given in Table 1.
General characteristics
| Event recorder | Usual care | |||
|---|---|---|---|---|
| n (%) | n (%) | |||
| n = 127 | n = 117 | |||
| Age in years (mean) | 50 | 49 | ||
| Female gender | 94 (74%) | 86 (74%) | ||
| Comorbidity | ||||
| Diabetes mellitus | 8 (6%) | 6 (5%) | ||
| Ischemic heart disease | 12 (9%) | 9 (8%) | ||
| Hypertension* | 30 (24%) | 14 (12%) | ||
| Time since first episode | ||||
| <7 days* | 1 (1%) | 6 (5%) | ||
| 7 days–3 months | 43 (34%) | 41 (35%) | ||
| 3 months–1 year | 34 (27%) | 26 (22%) | ||
| >1 year | 49 (38%) | 44 (38%) | ||
| Duration of typical episode | ||||
| <1 min | 24 (19%) | 26 (22%) | ||
| 1–5 min | 28 (22%) | 27 (23%) | ||
| 6 min–1 hr | 25 (20%) | 25 (21%) | ||
| >1 hr | 24 (19%) | 19 (16%) | ||
| Various | 26 (20%) | 20 (17%) | ||
| Symptoms during episodea | ||||
| Rapid pulse | 82 (36%) | 83 (32%) | ||
| Skipped beats | 78 (65%) | 53 (71%) | ||
| Irregular pulse | 62 (49%) | 48 (41%) | ||
| Light headedness | 46 (21%) | 37 (20%) | ||
| Pounding | 4 (3%) | 3 (3%) | ||
P < 0.05.
Some patients had more than one symptom.
Feasibility and quality of memo-event recordings
During the study 682 ECGs were recorded by 127 patients. Of the 127 patients 104 (82%) had symptoms and made 214 recordings during symptoms (mean: 2 ECGs per person). One participant withdrew and another could not produce an ECG because of anxiety. No patients dropped out because of skin irritation. No ECGs during symptoms were missed because of technical failure. All recorded ECGs were of good quality. No emergencies occurred during the study.
Memo recorder diagnoses
An ECG diagnosis was established by the cardiologist in 104 (82%) of the patients in the intervention group (Table 2). Arrhythmias were detected in 83 (65%) patients in the intervention group. Relevant arrhythmias included SVT (n = 12), paroxysmal AF (n = 10). Less relevant arrhythmias included sinus tachycardia (n = 19), ventricular extra systoles (n = 34), and atrial extra systoles (n = 6). A normal ECG-registration during three symptomatic episodes was found in 21 patients. In another 21 patients no symptoms occurred during the month of recording.
Interpretation after six weeks of the ambulant ECGs by the cardiologist
| Diagnosis | Number of ECGs during complaints | Number of patients |
|---|---|---|
| n (%) (n = 127) | n (%) (n = 214) | |
| Relevant | 51 (24%) | 24 (19%) |
| Atrial fibrillation | 25 (12%) | 10 (8%) |
| Supraventricular tachycardia not specified | 23 (11%) | 12 (9%) |
| SAN-exit block | 3 (1%) | 2 (2%) |
| Less relevant | 128 (60%) | 59 (46%) |
| Sinus tachycardia | 43 (20%) | 19 (15%) |
| Ventricular extrasystoles (<3/30 secs) | 73 (34%) | 34 (27%) |
| Atrial extrasystoles | 12 (6%) | 6 (5%) |
| No cardiac diagnoses | 35 (16%) | 44 (35%) |
| Symptoms, no abnormalities on ECG | 35 (16%) | 21 (17%) |
| No symptoms | 2 | 21 (17%) |
| No registrations | 2 | 2 (2%) |
Diagnoses at six months follow up
We found no difference in the management by the GP between the intervention and control group with respect to referral rates and the number and types of additional investigations, although referrals to cardiology in the intervention group appeared more appropriate: in the intervention group 23 of the 25 (92%) referred patients had a cardiac problem, in the control group only 12 of the 21 (57%) patients (RR.1.6, CI 1.1 to 2.4) (Table 3).
The process of care during the six months of the study
| Intervention n (%) | Control n (%) | Difference (95% CI) | |
|---|---|---|---|
| (n = 127) | (n = 117) | ||
| Referral to specialist | 46 (36%) | 40 (34%) | +0.02 (−0.09 to +0.14) |
| Cardiology | 25 (20%) | 21 (18%) | +0.02 (−0.08 to +0.12) |
| Psychiatry/psychology | 9 (7%) | 12 (10%) | −0.03 (−0.10 to +0.04) |
| Other specialism | 11 (9%) | 7 (6%) | +0.03 (−0.04 to +0.09) |
| Patients with additional investigationsa | 31 (24%) | 36 (31%) | −0.06 (−0.18 to +0.04) |
| Blood analysis | 21 (17%) | 24 (21%) | −0.04 (−0.14 to +0.06) |
| Urine analysis | 3 (2%) | 3 (3%) | <0.01 (−0.04 to +0.04) |
| Extra ECG | 4 (3%) | 8 (7%) | −0.04 (−0.09 to +0.02) |
| X-thorax | 3 (2%) | 2 (2%) | <0.01 (−0.03 to +0.04) |
| Other | 14 (11%) | 7 (6%) | 0.05 (−0.01 to +0.11) |
Some patients had more than one additional investigation.
The outcomes differed significantly (P < 0.001). GPs had no explanation for patients' symptoms in 17% (n = 22/127) of patients in the intervention group and in 38% (n = 45/117) of patients in the control group (RR 0.5, 95% CI 0.3 to 0.7). After six months, GPs established a cardiac diagnosis in 31 patients in the control group (26.5%, 95% CI 0.18 to 0.34) and in 85 patients in the intervention group (67.2%, 95% CI 0.59 to 0.75) (Table 4). There was a significant increase of relevant cardiac diagnoses (RR 3.2, 95% CI 1.5 to 6.8) in the intervention group. All relevant diagnoses in the control group were found after referral to a cardiologist (n = 5) or consultation at the first aid department (n = 3). A striking difference between both groups in the frequency of the diagnosis ‘stress’ was found, in contrast with the clear-cut psychiatric diagnosis of a panic disorder.
Diagnosis by the GP after six months
| Diagnosis | by GP at 6 months intervention group (n = 127) | by GP at 6 months control group (n = 117) | Relative risk (confidence interval) |
|---|---|---|---|
| Relevant | 28 (22%) | 8 (7%) | 3.2 (1.5–6.8) |
| Atrial fibrillation | 12 (9%) | 2 (2%) | 5.5 (1.3–24.2) |
| Supraventricular tachycardia | 15 (12%) | 4 (3%) | |
| Nodal escape rhythm | – | 1 (1%) | |
| SA block | 1 (1%) | 1 (1%) | |
| Less relevant | 57 (45%) | 23 (20%) | 2.3 (1.5–3.5) |
| sinus tachycardia | 21 (16%) | 13 (11%) | |
| bradycardia | 2 | 3 (2%) | |
| ventricular extrasystoles | 34 (27%) | 6 (5%) | |
| atrial extrasystoles | 2 (2%) | 1 (2%) | |
| No cardiac diagnoses | 19 (15%) | 41 (35%) | 0.4 (0.3–0.7) |
| anemia, hyperthyreoidie | 3 (2%) | 4 (3%) | |
| anxiety/panic disorder | 7 (6%) | 8 (7%) | |
| stress-related symptoms | 9 (7%) | 29 (25%) | |
| No diagnoses | 22 (17%) | 45 (38%) | 0.5 (0.3–0.7) |
| Lost for follow up | 1 (1%) | – | – |
In the intervention group differences between the diagnoses at 6 weeks and after 6 months are mainly explained by labelling by the GP of patients without a CER-diagnosis or with a sinus tachycardia as having a psychiatric or stress-related problem. After six months of follow-up GPs diagnosed 16 patients as having a psychological or psychiatric problem and were unable to register a diagnosis in 22 patients.
There were four additional relevant cardiac diagnoses made by the GPs after 6 months, compared with the diagnosis after ending the diagnostic process by the CER (Tables 2 and 4). One patient without a symptomatic intervention ECG appeared to suffer from a SVT and in one patient without a symptomatic intervention ECG atrial fibrillation was diagnosed. One patient initially diagnosed as having multiple extra systoles and one patient with a sinus tachycardia on the intervention ECG (both a less relevant arrythmia) appeared to have atrial fibrillation. All changes to a relevant cardiac diagnosis were made after referral to a cardiologist during the six months follow-up period.
Discussion
This was the first comparative study of the use of an event-recorder in the diagnostic process in general practice. We introduced the event recorder as an extra diagnostic tool in general practice for patients with symptoms of palpitations and/or light headedness. Within 28 days 83% of the patients in the intervention group were able to register one or more episodes, which led to a firm cardiac explanation in 65% of all patients and to exclusion of a cardiac disease in 17%. In our intervention group more cardiac diagnoses, of which more appeared relevant were made than in previous, non randomised studies in general practice.3,4 After six months the GP was able to explain 62% of the episodes of patients without an event recorder, compared to 82% in the intervention group. This is comparable with previous studies in secondary care.11
The most likely explanation for these findings is that GPs missed (relevant) cardiac diagnoses in the control group because of the paroxysmal nature of the complaints and over-diagnosed stress related problems. Not discovering relevant cardiac diagnoses like atrial fibrillation can have serious consequences. Paroxysmal attacks have the same risk for a cerebro-vascular accident as continuous fibrillation.12 These patients require anti-coagulant treatment, while most need further evaluation by a cardiologist, as indicated by the Dutch guideline on atrial fibrillation. The benefit of identifying more diagnoses from the group of less relevant cardiac diagnoses is more difficult to value, but especially recording sinus rhythm or a ventricular extra systole during a typical episode can be helpful because it virtually rules out cardiac disease. This can be reassuring for both patient and GP, thereby avoiding unnecessary further testing and referral. We anticipated a lower referral rate in the intervention group, but as so many patients needed specialist care (as the diagnosis indicated the need for that) the referral rate in the intervention group was similar to the referral rate in the control group. Referrals however were more appropriate in the intervention group.
Some patients with (serious) cardiac abnormalities in the control group have probably been incorrectly labelled as having a stress related problem. This phenomenon has been mentioned before in secondary care. Palpitations are one of the more prominent somatic signs of panic attacks and anxiety. Treatment of the palpitations may lead to disappearance of the stress related symptoms.13
Methodological limitations
It is unlikely that our findings have been generated by a large imbalance in patients with a cardiac abnormality despite randomisation. However, because we choose a parallel, randomised trial with a control arm we did not ascertain the frequency of cardiac abnormalities in the control arm. Therefore, we opted for a relatively long (>6 months) follow-up time, during which GP's were able to conduct all diagnostic procedures they thought necessary (including referral) and change their initial diagnosis. An alternative design would have been a single group design in which all patients receive the event recorder and then calculating the overall yield of the device. The results of such designs are often unconvincing because it remains unclear how many arrhythmias would have been detected with usual care. Therefore, we choose a randomised design to determine the extra yield in comparison to usual care.14 Another option would have been to randomise between memo-event recorder and referral to the cardiologist with Holter monitoring. The main problem associated with Holter monitoring is its low sensitivity in infrequently occurring symptoms and the yield of many aberrations with uncertain clinical consequences.15
Our stratified randomisation procedure was meant to create comparable groups of patients and not to frustrate GPs whose patients all could be randomised to the control group without stratification, but created some imbalance between the two groups, but this cannot explain the great differences in diagnostic yield. Besides, there was no difference in firm non-cardiac diagnoses in both groups.
We asked GPs to include every consecutive patient with palpitations or light headedness as a new complaint. This probably has led to a relative young study population. We conducted a retrospective chart review after recruitment among 27 of the 69 participating GPs. About half of the eligible patients appeared not to be included. In a third of cases GPs forgot to include the patient in the trial (33%) and in under a quarter of the cases the GPs had another explanation for the symptoms (21%), mostly extra systoles. This selection bias may have led to a higher prevalence of relevant cardiac abnormalities in our study population, but did not affect the contrast between both parallel groups of patients.
We conclude that introduction in general practice of a patient activated memo event recorder is feasible and elucidated hidden morbidity with potential serious medical consequences. The ability to exclude cardiac problems is another strength of this tool. Further research is needed to refine the indications and taper its use in daily practice.
Declaration
Funding: this research was funded by the Dutch College for Health Insurance (CVZ) and by AGIS health insurances.
Ethical approval: this study was approved by the ethical committee of the Academic Medical Center of Amsterdam.
Conflicts of interest: none other than mentioned under funding.
Hoefman E, van Weert HCPM, Reitsma JB, Koster RW and Bindels PJE. Diagnostic yield of patient-activated loop recorders for detecting heart rhythm abnormalities in general practice: a randomised clinical trial. Family Practice 2005; 22: 478–484.
This version published 22 August 2005
We would like to express our gratitude to Greta Rait for her accurate revision of the manuscript.
References
Zwietering P, Knottnerus A, Gorgels T, Rinkens P. Occurrence of arrhythmias in general practice.
Barsky AJ, Cleary PD, Barnett MC, Christiansen CL, Ruskin JN. The accuracy of symptom reporting by patients complaining of palpitations.
Summerton N, Mann S, Rigby A, Petkar S, Dhawan J. New-onset palpitations in general practice: assessing the discriminant value of items within the clinical history.
Zwietering PJ, Knottnerus JA, Rinkens PE, Kleijne MA, Gorgels AP. Arrhythmias in general practice: diagnostic value of patient characteristics, medical history and symptoms.
Willem Van der Does AJ, Antony MM, Ehlers A, Barsky AJ. Heartbeat perception in panic disorder: a reanalysis.
Barsky AJ. Palpitations, Arrhythmias, and awareness of cardiac activity.
Zimetbaum PJ, Josephson ME. The evolving role of ambulatory arrhythmia monitoring in general clinical practice.
Kinlay S, Leitch JW, Neil A, Chapman BL, Hardy DB, Fletcher PJ. Cardiac event recorders yield more diagnoses and are more cost-effective than 48-hour Holter monitoring in patients with palpitations. A controlled clinical trial.
Linzer M, Yang EH, Estes NA, III, Wang P, Vorperian VR, Kapoor WN. Diagnosing syncope. Part 2: Unexplained syncope. Clinical Efficacy Assessment Project of the American College of Physicians.
Balmelli N, Naegeli B, Bertel O. Diagnostic yield of automatic and patient-triggered ambulatory cardiac event recording in the evaluation of patients with palpitations, dizziness, or syncope.
Weber BE, Kapoor WN. Evaluation and outcomes of patients with palpitations.
Walraven van C, Hart RG, Singer DE, Laupacis A, Connolly S, Petersen P, Koudstaal PJ, Chang Y, Hellemons B. Oral anticoagulants vs aspirin in nonvalvular atrial fibrillation. an individual patient meta-analysis.
Lessmeier TJ, Gamperling D, Johnsson-Liddon V. Unrecognized paroxysmal supraventricular tachycardia: potential for a misdiagnosis as panic disorder.
Knottnerus JA, van Weel C, Muris JWM. Evidence base of clinical diagnosis: Evaluation of diagnostic procedures
Author notes
aDivision of Clinical Methods and Public health, Department of General Practice, bDepartment of Clinical Epidemiology and Biostatistics and cDivision for Internal Medicine, Department of Cardiology, Academic Medical Center Amsterdam, Meibergdreef 15, 1105 AZ Amsterdam, The Netherlands
