


Abstract
Background. Governmental reviews of out-of-hours services in England and Scotland have recommended that a standard questionnaire should be used to assess patient satisfaction. This is important because of the rapid introduction of new forms of care.
Objective. To produce a brief, reliable and valid measure of patient satisfaction for use by a wide variety of providers of out-of-hours primary care.
Methods. The Short Questionnaire for Out-of-Hours care was designed and compared with a longer questionnaire which had been validated and used in earlier research. Questionnaires were sent to 1906 people contacting an out-of-hours GP co-operative. Three versions of the short questionnaire were used with different formats. Analysis compared the response rates, measurement properties, concurrent and construct validity of the short and long questionnaires, and of different versions of the short questionnaire.
Results and conclusions. There was no significant difference in the overall response rates obtained from the short or long questionnaires (45.7% versus 41.9%; P = 0.17). The effective response rate of questionnaires from which all satisfaction scales could be calculated was higher for the short questionnaire (43.0% versus 36.4%; P = 0.01). There were no significant differences in response rates or distribution of responses between different versions of the short questionnaire. There was moderate agreement between items on the short questionnaire and corresponding scales on the long questionnaire. Scores using the short questionnaire showed anticipated relationships with the age and sex of patients and with characteristics of how the service was delivered. The SQOC is valid and reliable for routine service use.
Salisbury C, Burgess A, Lattimer V, Heaney D, Walker J, Turnbull J and Smith H. Developing a standard short questionnaire for the assessment of patient satisfaction with out-of-hours primary care. Family Practice 2005; 22: 560–569.
Introduction
Over the last decade many developed countries have reviewed or reorganised the way they provide ‘out-of-hours’ primary care services.1 Following a review of out-of-hours services in 2000 for the Department of Health in England, a variety of models of care have been developed. The review recommended that all providers should continuously monitor their patients’ satisfaction.2 However, the conceptualisation and assessment of patient satisfaction is complex,3–5 and many organisations currently use locally developed questionnaires which have not been validated. Questionnaires designed for research purposes may be excessively lengthy and complex for routine use. Following an earlier review of out-of-hours services in Scotland, the Scottish Office working group recommended that a validated standard questionnaire should be produced for use across different locations.6 This concept had also been proposed by the National Association of GP Co-operatives (NAGPC), as a standard questionnaire would help different out-of-hours services to carry out reliable surveys and to obtain meaningful results in comparison with results achieved elsewhere. The Scottish Office funded the initial development of such an instrument, and we have refined and evaluated the questionnaire as part of the evaluation of integrated out-of-hours services in England. The need for standardised measurement tools has become increasingly important because of the radical changes to out-of-hours services which are likely to result from new contractual arrangements for GPs in the UK.7
Our objective was to produce a short, reliable and valid measure of patient satisfaction which could be used by a wide variety of providers of out-of-hours care. The purpose of this paper is to describe the development and validation of the Short Questionnaire for Out-of-hours Care (SQOC).
Methods
Development of questionnaire
The team reviewed the various instruments in use and devised a draft short questionnaire to address the range of issues in provision of out-of-hours primary care that have been identified in earlier qualitative and quantitative research as most important to patients.5,8–12 The most thoroughly validated questionnaire appeared to be that devised by McKinley et al.,8 later modified and re-tested by Salisbury to create three different versions suitable for patients receiving care at a primary care centre, at a home visit, or on the telephone.11 This longer questionnaire has been used in a number of co-operatives previously but was felt to be too complex for routine use. It was therefore used as the ‘gold standard’ as a basis for comparison with our new shorter questionnaire.
A draft short questionnaire was devised consisting of five sections: demographic details, questions about the type of service received, whether the patient received the type of service they wanted, questions about satisfaction, and an open question inviting general comments. The satisfaction section consisted of seven questions, with one or two questions designed to substitute for each of the multi-item scales for different components of satisfaction on the longer questionnaire11 (see Table 1). The intention was to derive an overall satisfaction scale by combining all items on the short questionnaire, subject to confirming the satisfactory internal consistency of such a scale.
Response rates for items on the short questionnaire and scales on the long questionnaire
| Item on short questionnaire | Response rate | Scale on long questionnaire | Response rate | χ2 (P value) |
|---|---|---|---|---|
| n = 748 | n = 558 | |||
| n (%) | n (%) | |||
| Q8. Getting through on the telephone | 330 (44.1) | ‘Contacting the service’ | 220 (39.4) | 2.89 (0.09) |
| Q9. Way initial call was handled | 328 (43.9) | ‘Receptionist’ | 220 (39.4) | 2.57 (0.11) |
| Q10. Time to wait | 331 (44.3) | ‘Wait for visit/telephone consultation/centre attendance a | 220 (39.4) | 3.05 (0.08) |
| Q11. Manner of doctor or nurse | 331 (44.3) | ‘Doctor's manner’ | 221 (39.6) | 2.83 (0.09) |
| Q12. Explanationb | 329 (44.0) | ‘Explanation and advice’ | 212 (38.0) | 4.73 (0.03) |
| Q13. Treatment or adviceb | 332 (44.4) | ‘Explanation and advice’ | 212 (38.0) | 5.37 (0.02) |
| Q14. Overall satisfaction | 337 (45.1) | ‘Overall satisfaction’ | 226 (40.6) | 2.70 (0.10) |
| SQOC scale | 322 (43.0) | All Scales | 203 (36.4) | 5.91 (0.01) |
The long questionnaire has different versions for those seen in different settings. Results were analysed separately for those sent each version.
Two questions to replace a scale which had 6 items.
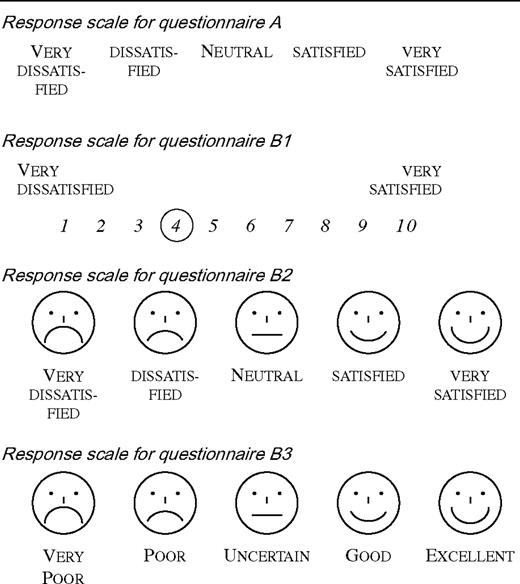
Initial pilot studies of the draft questionnaire were carried out in three sites in Scotland, following which minor changes were made to improve the clarity of question wording. The pilot studies showed that the distribution of responses on each item was strongly skewed towards satisfaction. Therefore three additional versions with different response formats were designed in an attempt to increase the range of responses (Box 1).
Setting
The main study was conducted in a general practice co-operative providing out-of-hours care for the 139 000 patients of its 77 GP members. The co-operative covers a range of urban, sub-urban and rural areas, with pockets of affluence and deprivation. It is one of thirty-four ‘exemplar’ sites in England where registered patients contacting a doctor outside surgery hours are initially assessed by NHS Direct. Those who are assessed by an NHS Direct nurse as needing the attention of a doctor are transferred to the co-operative, with a recommendation about whether they need telephone advice, attendance at a primary care centre or a home visit.
Participants
Patients who were transferred to the GP co-operative during a 6-week period in July and August 2003 were potentially eligible for the study (n = 3291). Calls were excluded where the doctor at the co-operative felt that sending a questionnaire would cause distress (n = 559), if a questionnaire had already been sent to the same household (n = 775), or if address details were incomplete (n = 51). The final sample consisted of 1906 patients mailed a questionnaire.
Assessment of short questionnaire
The study was designed to address four main questions. First, to compare the response rates when patients were sent the short or long questionnaire. Second, to compare the internal consistency and distribution of responses obtained from different versions of the short questionnaire with different response options. Third, to examine the agreement between the responses to individual questions on the short questionnaire and the corresponding scale on the long questionnaire (concurrent validity). Fourth to examine whether satisfaction scores using the new questionnaire demonstrated anticipated relationships with characteristics of the patients or the way the service was delivered, to demonstrate construct validity.
Analysis
The chi-squared statistic was used to compare response rates. The internal consistency of the questionnaire was assessed using Cronbach's alpha statistic. The level of agreement between responses to each question item on the short questionnaire and the corresponding multi-item scale in the long questionnaire was assessed using the intraclass correlation coefficient (ICC), which describes the ratio of variance between individuals to the variance between the two measurements.13 In calculating scales, where one question item contributing to the scale was missing, this was imputed from the mean of the other scores for that individual. If more than one item was missing the whole scale was scored as missing. The SQOC scale score derived from the short questionnaire was calculated as the percentage of the maximum score achievable on all items, so that potential scores ranged from 0 (very dissatisfied) to 100 (very satisfied).
Administration of questionnaire
Using a computer generated randomisation sequence, consecutive patients (n = 1306) who contacted the co-operative were randomly allocated to be sent one of four versions (with different response categories) of the short questionnaire or a long questionnaire (one of three versions depending on whether they had a consultation at the centre, at home or on the telephone). In a second stage, consecutive patients (n = 600) who contacted the co-operative were asked to complete both the original version (version A) of the short questionnaire and the appropriate version of the long questionnaire. Patients were sent questionnaires by the co-operative within 7 days of their initial contact. One reminder was sent after 14 days.
Results
Response rates
The response rate was 45.7% (342/748) from patients sent the short questionnaire alone, 41.9% (234/558) for patients sent the long questionnaire alone and 39.7% (238/600) for patients sent both questionnaires (although 1 of these patients did not complete the short version and 4 did not complete the long version). In total, 579 short questionnaires and 468 long questionnaires were available for analysis (Fig. 1).
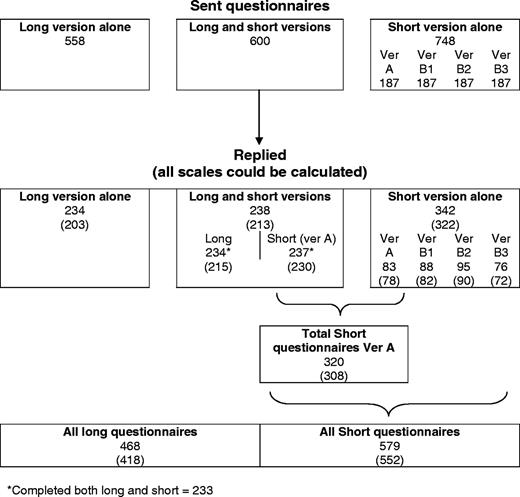
Flow diagram of questionnaires and response rates
In the comparison of patients sent the short questionnaire (n = 748) or long questionnaire (n = 558) alone, the difference in response rates was not statistically significant (Chi squared 1.86; P = 0.17). There was also no difference in the response rate for different versions of the short questionnaire (Chi squared 4.16; P = 0.25).
However, scales for components of satisfaction can only be calculated when all items are completed, reducing the number of questionnaires with fully useful data. The effective overall response rate where all scales could be calculated was higher for the short questionnaire 43.0% (322/748) than for the long questionnaire 36.4% (203/558) (Chi squared 5.91; P = 0.01), even after imputing scores where one item was missing (Table 1). Respondents to the long and short questionnaires had very similar age and sex characteristics. The age and sex characteristics of non-responders are unknown.
Internal consistency and distribution of responses
The four versions of the short questionnaire with different response formats generated similar overall scale mean scores (Table 2). All four versions showed a similar distribution of responses skewed towards satisfaction (Fig. 2). For each version, an overall satisfaction scale calculated from all seven satisfaction questions demonstrated a high level of internal consistency, assessed using Chronbach's alpha statistic (Table 2). For comparison, the internal consistency of the overall satisfaction scale on the long questionnaire was 0.79.
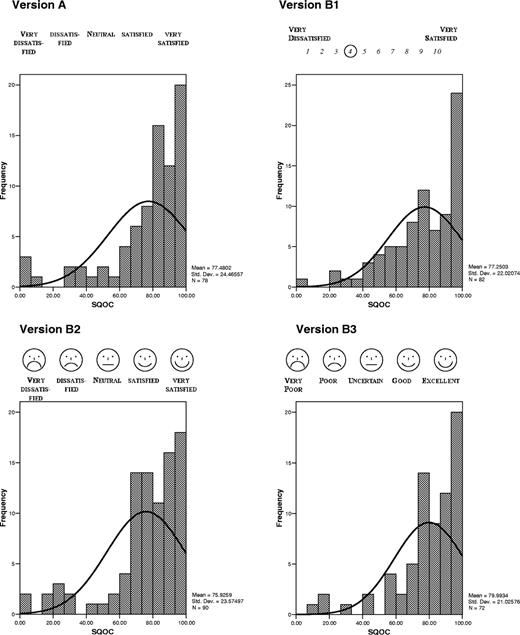
Distribution of responses from different versions of the short questionnaire
Scores and internal consistency of four versions of the short questionnaire with different response options
| Version of the short questionnaire | Description of scale | n | Mean scale score | Standard deviation | chronbach's alpha (α) | |
|---|---|---|---|---|---|---|
| A | 5-point alpha scale (very satisfied, satisfied, neutral, dissatisfied, very dissatisfied) | 78 | 77.5 | 24.5 | 0.91 | |
| B1 | 10-point numerical scale (1 = very dissatisfied to 10 = very satisfied) | 82 | 77.3 | 22.0 | 0.88 | |
| B2 | 5-point alpha scale (very satisfied, satisfied, neutral, dissatisfied, very dissatisfied) with smiley faces above the scale | 90 | 75.9 | 23.6 | 0.94 | |
| B3 | 5-point alpha scale (very poor, poor, uncertain, good, excellent) with ‘smiley faces’ above the scale | 72 | 80.0 | 21.0 | 0.93 | |
| All short questionnaires | 322 | 77.5 | 22.8 | 0.92 | ||
Each of the individual satisfaction items on the short questionnaire correlated with the overall satisfaction item (see Table 3), suggesting construct validity, but without excessive correlation which would suggest redundancy of items.
Scores for each satisfaction item on the short questionnairea
| How satisfied are you with the following? Response to item: | n | Mean | SD | % fairly satisfied | % very satisfied | Correlation with overall satisfactionb |
|---|---|---|---|---|---|---|
| Getting through on the telephone | 311 | 3.85 | 1.22 | 36.3 | 36.3 | 0.64 |
| The way your initial phone call was handled | 309 | 4.09 | 1.10 | 40.1 | 42.7 | 0.73 |
| The time you had to wait before you finally saw or spoke to a doctor or nurse | 312 | 3.93 | 1.18 | 34.6 | 39.4 | 0.73 |
| The attitude of the doctor or nurse | 313 | 4.28 | 1.11 | 28.4 | 57.5 | 0.79 |
| The explanation the doctor or nurse gave you about your problem | 311 | 4.04 | 1.18 | 33.1 | 45.0 | 0.81 |
| The treatment or advice you were given | 313 | 4.07 | 1.12 | 36.1 | 43.8 | 0.84 |
| Overall, how satisfied were you with the service you received? | 315 | 4.09 | 1.12 | 38.1 | 44.1 |
Based on 320 patients returning version A in the first phase (n = 83) or as one of the paired questionnaires in the second phase (n = 237).
All P values for the correlations are <0.01.
Concurrent validity: agreement between short and long questionnaires. Table 4 shows the level of agreement between the items on the short questionnaire and the scales on the long questionnaire. This is based on the 233 responses from patients completing both the short questionnaire and the long questionnaire.
Intraclass correlation coefficients for corresponding scales on the short and long questionnaires
| Short version question | Long version scale | ICC |
|---|---|---|
| How satisfied were you with the following? | ||
| Getting through on the telephone | ‘Contacting the service’ | 0.54 |
| The way your initial call was handled | ‘Receptionist’ | 0.38 |
| The time you had to wait before you finally saw or spoke to a doctor or nurse | ‘Wait for visit/telephone consultation/center attendance’a | 0.39 |
| The manner of the doctor or nurse | ‘Doctor's manner’ | 0.45 |
| The explanation the doctor or nurse gave you about the problemb | ‘Explanation and advice’ | 0.45 |
| The treatment or advice you were givenb | ‘Explanation and advice’ | 0.40 |
| Overall, how satisfied were you with the service you received? | ‘Overall satisfaction’ | 0.50 |
Different versions according to where patient was seen.
Two questions to replace a scale which had 6 items.
Construct validity: relationship with patient and organisational factors. The high level of internal reliability of the satisfaction items suggests that satisfaction on the short questionnaire can be expressed as a single scale. In order to establish provisional normative scores for each item on the short questionnaire and also to examine construct validity, an assessment was made of how scores varied by the age and gender of the respondent, and whether they received a home visit, telephone advice or attended a primary care centre (Table 5).
Satisfaction in different age groups (restricted to 320 patients who returned questionnaire A)
| Mean SQOC scale score (SD) | n(%) patients ‘very satisfied’ on overall satisfaction item | Logistic regression estimates for being ‘very satisfied’ | |
|---|---|---|---|
| Sex | n = 304a | n = 315a | n = 311a |
| Male (n = 113) | 75.7 (23.9) | 41 (36.3) | 1 (reference) |
| Female (n = 202) | 77.4 (23.2) | 98 (48.5) | 1.6 (1.0 to 2.6) |
| Missing sex = 5 | |||
| Age group | n = 302a | n = 309a | |
| Under 20 (n = 97) | 73.8 (21.9) | 36 (37.1) | 1 (reference) |
| 20-39 (n = 76) | 77.3 (22.9) | 34 (44.7) | 1.5 (0.8 to 2.8) |
| 40-59 (n = 44) | 75.3 (25.6) | 17 (38.6) | 1.2 (0.5 to 2.5) |
| 60+ (n = 96) | 78.4 (26.3) | 50 (52.1) | 2.2 (1.1 to 4.2) |
| Missing age = 7 | |||
| Setting | n = 308a | n = 315a | |
| Telephone advice (n = 82) | 71.7 (26.3) | 27 (33.8) | 1 (reference) |
| Visit to Primary Care Centre (n = 178) | 77.4 (21.9) | 82 (46.3) | 2.0 (1.1 to 3.7) |
| Home Visit (n = 60) | 78.8 (27.1) | 30 (51.7) | 1.8 (0.9 to 3.8) |
| All patients in above categories | 76.2 (24.2) | 139 (43.4) |
Totals are less than 320 because of missing data.
One item on the questionnaire asked people if they received telephone advice, received a home visit or were asked to attend a primary care centre. A subsequent question asked if they felt their call should have been handled in a different way (for example with a visit, phone advice or centre attendance). In order to assess the responsiveness of the short questionnaire, Table 6 shows the proportion of respondents who were very satisfied for each item classified by whether the patient was, or was not, happy with the type of service received, and also their SQOC scale score.
Relationship between satisfaction and whether patients received care in the setting they desired
| Item | Whether happy with the setting in which care was provided | Significant difference (P value) | ||
|---|---|---|---|---|
| YES (n = 274) n (%) who were very satisfied | NO (n = 22) n (%) who were very satisfied | |||
| Getting through on the telephone | 111/272 (40.8) | 0/22 (0.0) | <0.001 | |
| The way your initial call was handled | 129/271 (47.6) | 2/22 (9.1) | <0.001 | |
| The time you had to wait before you finally saw or spoke to a doctor or nurse | 118/272 (43.4) | 2/22 (9.1) | <0.001 | |
| The manner of the doctor or nurse | 172/271 (63.5) | 2/22 (9.1) | <0.001 | |
| The explanation the doctor or nurse gave you about the problem | 132/270 (48.9) | 2/22 (9.1) | <0.001 | |
| The treatment or advice you were given | 128/272 (47.1) | 2/21 (9.5) | <0.001 | |
| Overall, how satisfied were you with the service you received? | 134/273 (49.1) | 0/20 (0.0) | <0.001 | |
| n = 270 | n = 22 | |||
| SQOC satisfaction scale score-mean (SD) | 80.0 (22.0) | 47.0 (19.1) | <0.001 | |
| 95% CI | 77.4 to 82.7 | 38.5 to 55.4 | ||
The denominator varies for different analyses because of missing data.
Discussion
There is a need for standardised data collection instruments if we are to measure standards of care over time and between organisations. This need is particularly pressing given the radical changes in the provision of out-of-hours care being experienced in the UK, as responsibility for care moves from GPs to primary care organisations.7 Out-of hours care is also being reorganised in many other European countries.1 The patients' perspective is not the only indicator of quality of care which primary care organisations should assess, but it is one of the most important.
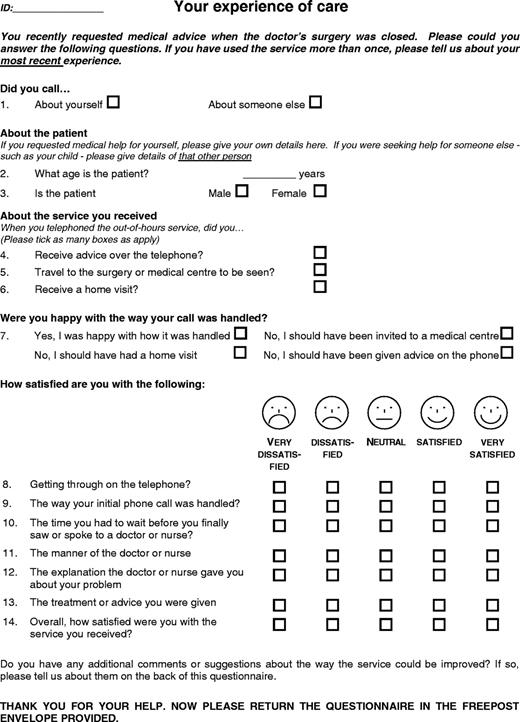
We designed a short satisfaction questionnaire to overcome some of the perceived disadvantages of longer questionnaires for routine use by out-of-hours services. Two recent systematic reviews have considered issues in the design of questionnaires for health settings. One concluded that shorter questionnaires are associated with higher response rates,14 although the other described this association as equivocal.15 In our study, although the number of valid responses was higher with the short compared with the long questionnaire, the difference was surprisingly small. In addition, different response formats did not lead to significant differences in mean scores or the distribution of responses. We would recommend use of version B2, with ‘smiley faces’ as well as a written scale, as this appears to offer the best combination of response rate, distribution of scores and internal consistency (Figure 3).
The longer questionnaire comprises 32 questions over 4 pages, using combinations of responses from several items to provide scale scores for seven dimensions of satisfaction. Respondents are asked to agree or disagree with a series of similar statements phrased in different ways, with some worded positively and some worded negatively. The claimed advantages of questionnaires of this type are that multi-item scales provide more reliable findings and a greater distribution of responses to capture different degrees of satisfaction. However, people sometimes give clearly inconsistent responses, or omit question items, possibly because they are confused or irritated by being repeatedly asked similar questions in different ways. These inconsistencies will lead to a greater distribution of responses which does not necessarily indicate greater reliability. In addition, the lower response rate from a longer questionnaire means that any gain in sensitivity and reliability may be at the expense of a loss of representativeness.
A short questionnaire has some advantages. As well as a slightly higher response rate, it offers ease of administration and data entry and is useful when it is necessary to incorporate questions about satisfaction within a longer questionnaire which addresses other issues as well. As anticipated, the short questionnaire in our study had the disadvantage of marked ceiling effects (high satisfaction scores on most questions), and these were not significantly reduced by our attempts to design different response scales. In addition, the correlations between scales on the long questionnaire and items on the short questionnaire were only moderate. However the short questionnaire did demonstrate the anticipated relationships between satisfaction and age, and the lower level of patient satisfaction with telephone advice compared with home visits, consistent with previous research. It was also sufficiently responsive to detect differences between patients who did or did not receive care in the setting they desired.
This study was conducted in only one GP co-operative and the satisfaction scores may vary in different settings and populations, as well as in different provider organisations. The response rates for both the long and short questionnaires (42% and 46% respectively) were lower than those achieved in earlier studies, which have ranged between 50% and 71%,8,11,16–18 possibly because only one reminder was sent. However non-response bias is less likely to be a problem for this validation study, comparing responses within a questionnaire or between different versions of a questionnaire, than it would be in surveys to evaluate services. It is not clear how large a difference in satisfaction scores represents a meaningful difference, but this criticism also applies to almost all other studies using satisfaction questionnaires. Although the test of internal consistency suggested that it was appropriate to combine the questions into one scale, the pattern of responses in relation to age and type of service shown in table 6 suggests that reporting the proportion of people ‘very satisfied’ with each item may be more useful than reporting the combined scale score, since this provided greater variability and more information about the aspects of the service which generate dissatisfaction. Bamford has suggested that, given the high levels of satisfaction usually obtained from patient satisfaction surveys in health care, a response of ‘fairly satisfied’ indicates a need for service improvement.19
The assessment of ‘patient satisfaction’ has been criticised because of the ambiguity of the concept, and doubts about its usefulness as a measure of quality of care.3,20,21 Problems include positively skewed findings from surveys, even though people are critical of specific aspects of health care,22 and the influence of prior expectations and socio-demographic factors on patients’ responses.21 Some questionnaires have been designed in an attempt to overcome these problems, for example by distinguishing between individuals’ experience and satisfaction with different aspects of services,23 or between the perceived importance and performance of different aspects.20 However, such questionnaires are inherently more complex and lengthy. The purpose of this study was to design a short questionnaire to substitute for a well-recognised and validated questionnaire, which assesses satisfaction rather than experience.
This new Short Questionnaire for Out-of-hours care (SQOC) is now being widely used by many general practice out-of-hours co-operatives following its adoption in the UK by the National Association of General Practice Co-operatives. An instruction package describing issues such as sample size and survey administration has been designed, along with a computer programme to assist in data entry and analysis, to provide a convenient package for service organisations. The dimensions assessed in this questionnaire are not specific to the UK and are likely to be of importance to users of out-of-hours services in a wide range of settings, so the questionnaire may be useful to primary care organisations providing out-of-hours care in many different countries. An electronic version of the questionnaire is available from http://www.phc.bris.ac.uk/phcdb/pubpdf/pubs/SQOC_Questionnaire.doc.
Declaration
Funding: the development of the questionnaire was partly funded by the Scottish Office. This validation study was funded by the Department of Health. The views expressed here are those of the authors alone.
Ethical approval: Trent Multi-Centre Research Ethics Committee.
Conflicts of interest: none.
We would like to thank North Bristol GP Co-operative for supporting this research, the co-operatives which assisted with the pilot work, all patients who completed the questionnaires, Colin Pryde for designing the data entry programme, Judith Lathlean for commenting on the paper, and the National Association of GP Co-operatives for their support.
References
Department of Health. Raising Standards for Patients New Partnerships in out-of-hours care. An independent review of GP out-of-hours services in England. London: Department of Health;
Locker D, Dunt D. Theoretical and methodological issues in sociological studies of patient satisfaction with medical care.
Fitzpatrick R. Surveys of patient satisfaction: 11—Designing a questionnaire and conducting a survey.
Lewis JR. Patient views on quality care in general practice: literature review.
Department of Health. National Quality Requirements in the Delivery of Out-of-Hours Services. Gateway no. 3776. London: Department of Health; 2004.
McKinley RK, Manku-Scott T, Hastings AM, French DP, Baker R. The reliability and validity of a new measure of patient satisfaction with out of hours primary medical care in the United Kingdom: development of a patient questionnaire.
Wensing M, Grol R, Smits A. Quality judgements by patients on general practice care: a literature analysis.
Hoult L. Why do patients call out-of-hours following a recent consultation with their GP? A qualitative study in one general practice.
Salisbury C. Postal survey of patients’ satisfaction with a general practice out of hours cooperative.
Hopton J, Hogg R, McKee I. Patients’ accounts of calling the doctor out of hours: qualitative study in one general practice.
Streiner DL, Norman GR. Health Measurement Scales: A practical guide to their development and use. 3rd edn. Oxford: Oxford University Press; 2003.
Edwards P, Roberts I, Clarke M, DiGuiseppi C, Pratap S, Wentz R et al. Methods to influence response to postal questionnaires (Cochrane Methodology Review). The Cochrane Library, Issue2. Chichester: John Wiley & Sons;
McColl E, Jacoby A, Thomas L, Soutter J, Bamford C, Steen N et al. Design and use of questionnaires: a review of best practice applicable to surveys of health service staff and patients.
Glynn LG, Byrne M, Newell J, Murphy AW. The effect of health status on patients’ satisfaction with out-of-hours care provided by a family doctor co-operative.
Pickin DM, O'Cathain A, Fall M, Morgan AB, Howe A, Nicholl JP. The impact of a general practice co-operative on accident and emergency services, patient satisfaction and GP satisfaction.
Shipman C, Payne F, Hooper R, Dale J. Patient satisfaction with out-of-hours services; how do GP co-operatives compare with deputizing and practice-based arrangements?
Bamford C, Jacoby A. Development of patient satisfaction questionnaires: 1. Methodological issues.
Sixma HJ, Kerssens JJ, van Campen C, Peters L. Quality of care from the patients’ perspective: from theoretical concept to a new measuring instrument.
Jenkinson C, Coulter A, Bruster S, Richards N, Chandola T. Patients’ experiences and satisfaction with health care: results of a questionnaire study of specific aspects of care.
Author notes
aAcademic Unit of Primary Health Care, University of Bristol, Cotham House, Cotham Hill, Bristol BS6 6JL, bSchool of Nursing and Midwifery, University of Southampton, Nightingale Building, Highfield, Southampton, SO17 1BJ, cHighlands and Islands Health Research Institute, University of Aberdeen, The Green House, Beechwood Business Park North, Inverness, IV2 3ED, dResearch Unit in Health, Behaviour and Change, University of Edinburgh, Medical School, Teviot Place, Edinburgh EH8 9AG and eBrighton and Sussex Medical School, Mayfield House, University of Brighton, Falmer, Brighton BN1 9PH, UK
