


Abstract
Background. Out reach facilitation is designed to promote uptake of evidence-based guidelines. There is evidence indicating that outreach facilitation can be effective in improving implementation of preventive care in GPs’ offices. In this trial, we test a modified version of an outreach facilitation intervention.
Objective. To evaluate whether a comprehensive preventive intervention program using outreach facilitators improves preventive care delivery.
Design. Match-paired, cluster-randomized controlled trial.
Setting. Fee-for-service primary care practices in Eastern Ontario, Canada, at a time of physician shortage.
Participants. Volunteer sample of 54 primary care practices.
Main outcome measures. Mean difference between trial arms in practices’ delivery of preventive manoeuvres, measured by preventive performance indices estimated from chart reviews and patient survey data.
Results. No difference was detected between the trial’s arms for the primary outcome’s overall prevention index [2.0%; 95% confidence interval (CI) −3.2 to 7.3; P = 0.44]. A small significant difference between the arms was detected for the secondary outcome’s overall prevention index (2.8%; 95% CI 0.7–4.8; P = 0.01).
Conclusion. In contrast to similar facilitation trials, this outreach facilitation program did not produce improvements in the delivery of preventive care. This lack of effect may be due to differences in the intervention and context, or the practice’s limited capacity to change. Our intervention simultaneously facilitated a high number of manoeuvres, blinded facilitators and physicians to the targeted tests and had a relatively short intervention period and large number of practices assigned per facilitator. Changes in the primary care service model in Ontario at the time of the trial could have also washed out the intervention effect.
Introduction
Family physicians, by virtue of their position and function in health care, are uniquely situated to deliver preventive services1,2. Unfortunately, routine integration of prevention guidelines into practice has proven to be challenging due to the numerous competing demands physicians must confront, such as attending to patients’ immediate needs combined with lack of time, resources and practical tools and a lack of incentives.3–7
Outreach facilitation employs individuals with a nursing background and formal training or experience in management, who are external to the practice, to promote the uptake of evidence-based guidelines and facilitate quality improvement in a practice setting. Despite variations in performance, outreach facilitation is gradually emerging as an effective method of implementing preventive services delivery in primary care.8,9. In a randomized controlled trial (RCT) within community-based family practices in Ontario paid by capitation, it was shown that outreach facilitation can lead to substantial improvements (11% over an 18-month period) in the delivery of preventive services.10 Initial evidence11 suggests that outreach facilitation has potential for reducing expenditures in health services.
Although there are similarities in the strategies and tools used in outreach facilitation interventions, other implementation characteristics may vary. For instance, in RCTs of outreach facilitation to improve preventive practices,10,12–14 the number of care manoeuvres targeted ranged between 714 and 35,12 the intervention duration between 313 and 2114 months and the mean number of monthly visits to practices between 0.412 and 1.8.10 The effect of variations in these and other intervention attributes on the effectiveness of outreach facilitation has not been explored.
Compared to this study, our previous RCT tested outreach facilitation for improving preventive care10 under different conditions. There, 46 Ontario Health Services Organizations practices (paid by capitation) located in the Toronto-Hamilton area participated in an 18-month study with half on the practices assigned to the intervention arm. Three facilitators underwent a 30-week training program and delivered the intervention. Each one worked with seven to eight practices on improving care delivery for 13 preventive manoeuvres. On average, they visited each practice 1.8 times per month (or 33 visits per facilitator over the trial). The facilitators used and adapted when necessary a seven-step strategy for modifying practice patterns and improving preventive care performance. They presented preventive performance rates before intervention; facilitated the development of a practice policy for preventive care; assisted in the setting of practice goals and performance levels, in the development of a written implementation plan for improving prevention and in the development and adaptation of tools and strategies for plan implementation; facilitated meetings to assess progress and modify the plan when necessary and provided performance feedback to measure the effect of the changes made. The study’s unit of intervention and analysis was the medical practice. The main outcome measure was an index of preventive performance, estimated as the proportion of eligible patients receiving eight recommended care manoeuvres less the proportion of patients receiving five inappropriate preventive care manoeuvres.
In this trial, we assess whether a conceptually similar approach but involving a less intensive intervention is effective in a different setting. A less intensive intervention was implemented to see if the cost effectiveness of the intervention could be improved in comparison to a similar trial.10 Specifically, we focused on fee-for-service (FFS) practices located in Eastern Ontario, increased the number of practices assigned per facilitator, shortened facilitator training, reduced the intervention length and targeted a greater number of preventive manoeuvres.
Methods
Study design
We conducted a match-paired, cluster RCT. Physicians and facilitators were blinded to the actual manoeuvres that would be included in the preventive performance index. The unit of randomization and analysis was the practice; the unit of observation was the patient. The randomization process is shown in Figure 1. The study was approved by the Ottawa Hospital Research Ethics Board.
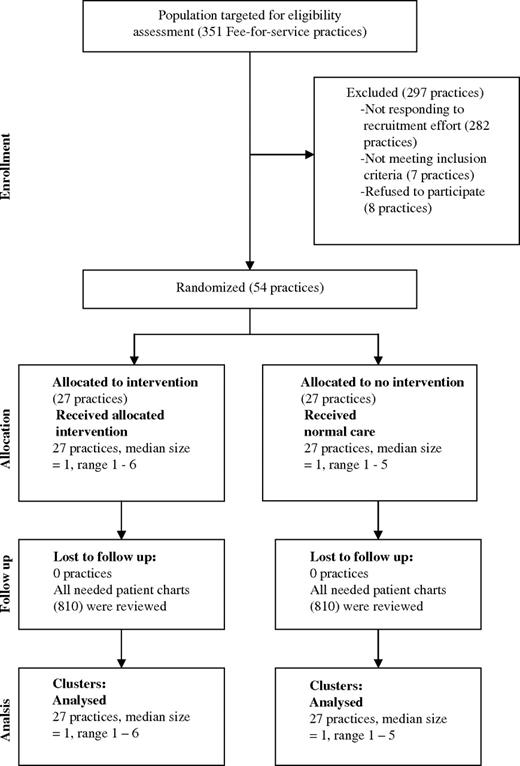
Flow diagram of FFS primary care physicians’ practices participating in the study at each stage of the trial
Setting
The study took place in the English- and French-speaking community-based FFS primary care practices in Eastern Ontario. Their payment system was based on charging the Ministry of Health for every patient encounter and service rendered. At the time of the study, FFS practices represented about 95% of all practices in Ontario.15
Practice recruitment
Solo (physician practicing alone) and group (several physicians who share staff, expenses, patient records and on-call duties) practices16 comprising no more than six physicians were eligible to participate in the trial. Larger practices and those with an academic affiliation were excluded due to their size and resulting complexity. Recruitment of practices involved two mailings to 351 family practices, which included an invitation letter and a brochure describing the project. Interested physicians were faxed further information and consent forms. Non-respondent physicians to the mailings were contacted by a telephone call from a physician recruiter or outreach facilitator. Recruitment continued until informed consent was obtained from the required number of practices (n = 54).
Facilitation intervention
The intervention lasted 11.5 months. Two nurses with a Master’s degree in Administration were employed as prevention facilitators. Each one was assigned 13 or 14 practices, visited each practice on average once a month, each visit lasting an average of 46 minutes. Facilitators delivered for the most part three intervention strategies found by our group to be particularly effective for improving preventive care in the previous study (Box 1).10 Practices in the control group did not receive any services from the facilitators during the intervention period.
Facilitator training and assignment
The intervention was delivered by two nurses with training in business or health administration. They received a 7-week theoretical and practical training course covering the following topics: medical practice management, prevention in primary care and social learning theory, medical office computer systems, evidence-based medicine, medical literature searches, basic statistics, feedback data interpretation and facilitation and audit skills development. During the training’s 3-week practical component, facilitators introduced the intervention to a pilot practice, collected preventive care performance data and provided preventive performance feedback. After training, the nurse facilitators were assigned 13 or 14 practices for delivering the intervention according to practice size, language spoken in the practice (English or French) and distance from the facilitator’s location
Meet and greet
During the first visit to participating practices, facilitators presented the Outreach Facilitation Program to physicians and staff in detail, including its goals, data collection process and intervention activities
Baseline audit
Nurses who were not facilitators conducted a chart review (70 charts per practice) and patient survey (90 per practice) to gather data on the intervention practices’ performance on preventive services delivery. A statistician analyzed the data and produced results for each practice on their preventive performance, which was also compared to the performance of the other practices in the study (anonymity ensured)
Feedback and consensus building
Facilitators shared with each practice its performance scores. With the facilitator’s assistance, they identified areas of high preventive performance as well as areas with room for improvement. The group reflected on the reasons underlying their performance and through consensus set practice targets (goal setting) for the areas of preventive care they perceived change was feasible and necessary. A ‘lead physician’ for liaising with the facilitator was identified in the practice. Next, the facilitator explored with the practice ways of integrating preventive care into routine/episodic care visits and shared tools used for improving the quality of preventive care delivery, such as prevention flow sheets, chart flags, sticker reminders, electronic reminders, patient care records, etc. Based on the practice’s care goals and their choice of tools, a plan or strategy was agreed upon with the facilitator for reaching the proposed goals. Practice and facilitator worked together to tailor (adapt) the tools and the facilitation services to the needs and characteristics of the practices
Periodic follow-up and consensus building
Every 3–6 weeks up to the intervention’s end, facilitators would visit the practice to follow-up on their progress and needs for improving preventive care. This could include reviewing their use of tools and of practice goals (i.e. decision to address a preventive issue formerly deemed as not feasible) and responding to previous practice requests. If necessary, facilitators would share with a practice lessons learned from other sites (dissemination/networking) and would provide educational materials for clinicians and advice on patient-mediated activities
Outcome measures and data collection
The intervention aimed to increase the use of those preventive manoeuvres supported by evidence as appropriate (Grade A and B manoeuvres) and decrease those indicated as inappropriate (Grade D manoeuvres) by the Canadian Task Force on Preventive Health Care.17 Fifty-three prevention screening manoeuvres were previously determined to be relevant to family practice by a decision-making panel of practicing family physicians.13 For the current study, recommendations relating to 26 manoeuvres distributed in two outcomes were selected as outcome measures as they were up-to-date, relevant for most adult populations and easily measured and their performance likely had room for improvement. The facilitators and the physicians and their staff were informed of the 53 manoeuvres but not which 26 would be included in the outcome measures.
The primary outcome measure was the composite index of preventive performance, defined as the number of appropriate preventive manoeuvres done minus the number of inappropriate manoeuvres done, divided by the total number of eligible preventive manoeuvres (a total of 12) as detected through a chart review. An identical operationalization was used for the secondary outcome measure, except that the patient surveys served as the data source and included 14 preventive manoeuvres. For each outcome, patient-level summary measures were aggregated for each practice and these scores served as the basis for comparison of preventive performance between the groups. The outcome measure incorporated two different data sources—a patient survey as well as a chart review—because not all preventive manoeuvres (i.e. lifestyle modification counselling) are recorded in patients’ charts. Although not standard measures, composite indices are widely used when interventions target complex situations involving multiple care process and clinical conditions,18 as in this study.
Data were collected at baseline up to 2 months before and up to 2 months after the intervention. Records of patients 17 years of age or older who were regular patients of the practice and had been seen at the practice at least once in the previous 30-day period were considered eligible for random selection for data abstraction. Preventive manoeuvres were included if they were done for screening rather than diagnostic reasons. For instance, if an elderly patient presented urinary track infection symptoms, a prescribed urine culture and sensitivity test would not be included in the outcome’s calculation.
Data from chart reviews were used to determine which services patients were eligible to receive based on age- and gender-specific and time interval recommendations made by the Task Force. For services for which the Task Force did not specify a time frame, an interval of 2 years was chosen. Chart reviews were performed by trained health record reviewers and verified by an independent reviewer. Chart reviewers were not members of the practices, had a background in health services and were not aware of practices’ group allocation. If errors were detected in more than a quarter of the charts being verified per practice, all charts in the practice were reviewed anew. Patient mail-out surveys to consecutive attenders were used to assess implementation of manoeuvres not reliably captured on patient charts, such as those related to health counselling in the area of exercise, smoking/drinking cessation or healthy eating patterns. Surveys were mailed within 1–5 days after seeing their physician, in order to minimize recall bias. Up to two reminders were sent to those who did not respond within 2 weeks. Data were collected from 1620 patients by chart review and 3185 patients by survey at baseline and 1620 patients by chart review and 3049 patients by survey at follow-up. Physicians in the intervention arm were mailed after intervention a 16-item satisfaction questionnaire on their views about the intervention’s components usefulness, overall satisfaction with the program and changes in quality of care due to the intervention. A reminder and a second questionnaire were mailed to non-respondents at 3-week intervals after the initial mailing.
Sample size determination
Sample size calculations were estimated using S-Plus and standard assumptions for a two-sided unpaired t-test. Twenty-four practices were needed for detecting a mean difference of 0.07 in the primary outcome between intervention and control groups, with a SD of 0.083, an alpha of 0.05 and 83% power. Twenty-seven practices per group were recruited to allow for an estimated 15% attrition. The delta selected (0.07) approximates the 10% change in care frequently associated with care improvement interventions.19 Based on a similar trial,20 it was determined that for the primary outcome, 30 randomly selected patient charts per practice at the end of the intervention were needed to meet sample size requirements. At baseline, data were collected from 40 additional patient charts per practice needed for the feedback component of the intervention.
Practice pairing and matching
Practices were matched on solo versus group practice, presence of nursing staff and location (rural or urban) and each pair member was randomly assigned to the intervention or control arm using the Statistical Analysis System software package. The allocation sequence was kept locked and unavailable to the administrative staff until the time of assignment.
Statistical analyses
Frequencies and descriptive statistics were generated on all variables. Means, SDs and 95% confidence intervals (CIs) were computed for continuous variables and frequency distributions for categorical variables, such as sex and age group. Chi-square tests were used to compare the background characteristics of intervention and control practices and paired t-tests to detect differences in preventive care performance between the groups.
Results
Of the 351 FFS practices identified, 297 did not participate in the study (Figure 1). From those identified, 85% (297/351) were not randomized because they refused to participate (2%, 8/351), did not meet study eligibility (2%, 7/351) or failed to reply to the team’s contact efforts (81%, 282/351). The 54 practices enrolled in the study were randomized into the intervention (n = 27) or control (n = 27) group. No practices withdrew from the study. Intervention and control practices did not show differences in seven of the nine characteristics used to compare them. They differed on the percentage of female physicians per practice and on the number of patients seen per half day (Table 1). Two of 54 practices needed to have their charts re-audited due to poor inter-rater reliability. All required charts for primary outcome measurement (1620) were reviewed. The response rate to the patient survey was 56% (3049 patient questionnaires received of 5400 sent out); it was the same for both arms in the trial and did not significantly differ in the pre- and post-periods. The response rate to the intervention arm physician satisfaction questionnaire was 85%. The agreement rate between chart reviewers was 75%.
Characteristics of the intervention and control practices
| Characteristics | Intervention practices (n = 27) | Control practices(n = 27) |
| Percentage of group practicesa | 29.6 | 29.6 |
| No. of group practices | 8 | 8 |
| No. of solo practices | 19 | 19 |
| Mean no. of physicians per group practice | 3.5 | 2.6 |
| Mean percentage of female physicians per practice | 33.2 | 58.7 |
| Mean no. of hours of booked appointments per week | 27.1 | 29.0 |
| Mean no. of patients seen per half day | 15.1 | 17.6 |
| Mean year of graduation from medical school | 1982 | 1984 |
| Percentage of rural practicesa | 29.6 | 33.3 |
| Percentage of practices with nurse(s)a | 51.8 | 59.2 |
| Pre-intervention preventive performance indexab | 33.5 | 33.0 |
Practice characteristics used for matching and pairing.
The pre-intervention index score is higher than the post-intervention because it differs from the latter by including two additional preventive manoeuvres (measurement of blood pressure and of the body mass index).
Results in Table 2 indicate that the composite primary outcome prevention index showed no significant differences on the overall preventive performance score between control and intervention practices (2.0%; 95% CI −3.2 to 7.3%; P = 0.44). Secondary analyses were conducted to test separately the provision of appropriate care (Grade A + B manoeuvres) versus the provision of inappropriate care (Grade D manoeuvres). There was no significant mean difference either between groups in the delivery of appropriate preventive manoeuvres (2.3%; 95% CI −3.6 to 8.3%; P = 0.44) or in the delivery of inappropriate ones (−10.3%; 95% CI −21.6 to 1.1%; P = 0.07). The proportion of manoeuvres adhering to recommendations for the composite preventive index ranged between 19.1% and 21.2%.
Comparison of preventive manoeuvre performance between intervention and control practices, as determined from patient chart review
| Preventive manoeuvre | Mean percentage of eligible patients with manoeuvre performed | ||||
| Intervention practices | Control practices | Mean difference between intervention and control practices | P value | 95% CI for the mean difference between groups | |
| Grade A | |||||
| Nicotine replacement therapy | 20.4 | 13.5 | 6.9 | 0.16 | −2.7 to 16.5 |
| Clinical breast examination | 72.8 | 74.1 | −1.3 | 0.86 | −16.2 to 13.6 |
| Mammography, 50–69 years | 67.2 | 73.1 | −5.9 | 0.29 | −17.2 to 5.4 |
| Screening for colon cancera | 30.0 | 16.5 | 13.5 | 0.05 | 1.8 to 26.8 |
| Grade B | |||||
| Papanicolaou smear | 69.8 | 69.4 | 0.4 | 0.93 | −9.2 to 9.9 |
| Influenza vaccination | 78.2 | 69.2 | 9.0 | 0.04 | 0.4 to 17.6 |
| Determination of rubella antibody titre | 41.5 | 51.7 | −9.4 | 0.32 | −28.6 to 9.9 |
| Visual acuity testing in elderly | 23.0 | 23.4 | −1.8 | 0.74 | −13.2 to 9.6 |
| Clinical hearing examination | 8.7 | 12.7 | −3.3 | 0.44 | −11.9 to 5.4 |
| Grades A + B overall | 50.8 | 48.5 | 2.3 | 0.44 | −3.6 to 8.3 |
| Grade D | |||||
| Urinalysis—urine dipstick for proteinuria | 45.2 | 58.5 | −13.4 | 0.07 | −27.9 to 1.2 |
| Urine C&S (asymptomatic) in the elderly | 14.2 | 17.7 | −4.3 | 0.47 | −16.2 to 7.7 |
| Prostate-specific antigen test | 49.4 | 61.6 | −14.4 | 0.13 | −33.2 to 4.5 |
| Grade D overall | 41.7 | 52.0 | −10.3 | 0.07 | −21.6 to 1.1 |
| Composite preventive performance index | 21.2 | 19.1 | 2.0 | 0.44 | −3.2 to 7.3 |
Hemocult stool test >50 years (A recommendation) or sigmoidoscopy screen for colorectal cancer >50 years (B recommendation).
Table 3 presents the mean proportion of eligible patients who received preventive counselling on manoeuvres related to healthy lifestyle as determined from patient surveys. The composite secondary outcome prevention index revealed a significant 2.8% absolute difference (95% CI 0.7–4.8%; P = 0.01) between the overall preventive performance in control and intervention practices. Intervention practices also performed 3.1% more of the appropriate (A and B) manoeuvres than the control practices (95% CI 1.1–5.0%; P = 0.003), as well as 3.1% more of inappropriate (D) manoeuvres (95% CI −0.4 to 6.6%; P = 0.08).
Comparison of preventive manoeuvre performance between intervention and control practices, as determined from patient questionnaire
| Preventive manoeuvre | Mean percentage of eligible patients with manoeuvre performed | ||||
| Intervention practices | Control practices | Mean difference between intervention and control practices | P value | 95% CI for the mean difference between groups | |
| Grade A | |||||
| History of tobacco use? (t smoking) | 35.0 | 33.3 | 1.7 | 0.64 | −5.6 to 8.9 |
| Noise exposure and prevention | 6.7 | 3.7 | 3.0 | 0.001 | 1.3 to 4.7 |
| Smoking cessation counselling | 41.9 | 38.1 | 3.7 | 0.30 | −3.6 to 11.0 |
| Folic acid supplementation | 29.9 | 23.1 | 7.2 | 0.13 | −2.3 to 16.7 |
| Grade B | |||||
| History of alcohol use? | 32.3 | 28.4 | 3.9 | 0.24 | −2.8 to 10.7 |
| Counselling regarding exercise/physical activity | 67.2 | 67.2 | 0 | 1.0 | −5.0 to 5.0 |
| Diet/nutrition counselling: ↓ dietary fat ↑ fibre, protein | 62.8 | 60.9 | 1.9 | 0.44 | −3.1 to 6.9 |
| Exposure to sun/counselling re cover-up | 29.1 | 23.3 | 5.7 | 0.03 | 0.6 to 10.8 |
| Seat belt use | 12.0 | 7.7 | 4.4 | 0.01 | 1.1 to 7.7 |
| Varicella vaccine, those susceptible | 10.5 | 9.3 | 1.2 | 0.31 | −1.2 to 3.6 |
| Genetic screening (family history of colorectal cancer) | 22.9 | 22.8 | 0.4 | 0.94 | −9.9 to 10.7 |
| Referral to smoking cessation program | 24.0 | 17.8 | 6.2 | 0.05 | 0.0 to 12.5 |
| Grades A + B overall | 31.7 | 28.7 | 3.1 | 0.003 | 1.1 to 5.0 |
| Grade D | |||||
| Teaching breast self-exam | 25.0 | 19.4 | 5.6 | 0.05 | 0 to 11.3 |
| Prostate-specific antigen test | 17.7 | 16.8 | 2.0 | 0.65 | −7.0 to 11.0 |
| Grade D overall | 21.3 | 18.2 | 3.1 | 0.08 | −0.4 to 6.6 |
| Composite preventive performance index | 28.5 | 25.7 | 2.8 | 0.01 | 0.7 to 4.8 |
Over two-thirds (72%) of the physicians in the intervention arm responding to a survey (n = 40) reported that they were satisfied or very satisfied with the prevention facilitation program. Those not satisfied with the program considered that reminder systems (73%), goal setting (55%) and materials for patients (55%) were not useful.
Discussion
This study’s lack of effect contrasts with results from similar trials, where multifaceted, outreach facilitation used in primary care contexts did improve the delivery of preventive care,10,12 diabetic care14 and cancer prevention and detection.13 If the intervention design across trials is similar, why the differing results this time? Several reasons may account for this.
First, compared to similar trials (Table 4), this one facilitated by far the largest number of care manoeuvres (54, compared to 35,12 13,10 1013 and 714), and had the highest ratio of monthly manoeuvres facilitated (4.7 compared to 3.3,13 2.9,12 0.710 and 0.314). Second, the average number of practices assigned per facilitator in this study (13.5) is much higher than in the other two studies for which the figure could be calculated (8.3 and 7.7). It is possible that with more preventive manoeuvres targeted, less time and resources in the practice were available to apply each one of them. A heavier work load per facilitator means the intervention was less intense and it resulted in less intervention time per practice. A large number of targeted manoeuvres could also mean less intervention time assigned per manoeuvre. Third, study practices participated voluntarily. The professionals working in these groups of practices were probably highly motivated and willing to introduce changes in their practices. The same motivation could also mean that they were already providing proper preventive care, making further care improvements hard to reach; however, the overall low scores mitigates against this explanation.
Characteristics of five multifaceted, outreach facilitation interventions used in primary care contexts
| Intervention characteristic | Authors of the study where the intervention was useda | ||||
| Goodwin et al.12 | Dietrich et al.13 | Frijlin et al.14 | Lemelin et al.10 | Current study | |
| Number of practices in facilitation intervention group | 38 | 50 | 62 | 23 | 27 |
| Number of facilitators | NR | 6 | NR | 3 | 2 |
| Average number of practices per facilitator | — | 8.3 | — | 7.7 | 13.5 |
| Length of facilitator training | NR | NR | 80 hours | 30 weeks | 4 weeks |
| Average number of visits to practices per facilitator | 5 | 3 | 15 | 33 | 9 |
| Intervention length | 12 months | 3 months | 21 months | 18 months | 11.5 months |
| Monthly average number of visits to practice per facilitator | 0.4 | 1.0 | 0.7 | 1.8 | 0.8 |
| Number of preventive manoeuvres facilitated | 35 | 10 | NR | 13 | 54 |
| Number of manoeuvres included in outcome measure | 35 | 10 | 7 | 13 | 25 |
| Number of manoeuvres facilitated by month | 2.9 | 3.3 | 0.3 | 0.7 | 4.7 |
| Health care aspect targeted | Prevention | Cancer | Diabetes | Prevention | Prevention |
| Number of intervention tools or strategies used to improve care | 10 | 4 | 3 | 7 | 3 |
| Other characteristics | |||||
| Geographical location for intervention delivery | Northeast Ohio | Vermont and New Hampshire | Southern Netherlands | Ontario (Toronto, Hamilton) | Eastern Ontario |
| Tailored | Yes | Yes | NR | Yes | Yes |
| Practice assessment | Yes | Yes | NR | Yes | Yes |
| Feedback provided to practice | Yes | NR | Yes | Yes | Yes |
NR, not reported.
The superscript number after the author’s name is the number of the corresponding reference in the list of references.
Fourth, we concealed from physicians and facilitators the subset of manoeuvres included in the main outcome measure in an attempt to blind them. This methodological variation, while common in many RCT studies, has not been reported in similar studies and may have contributed to the minimal effect. Fifth, it is also conceivable that record keeping in patient charts was not always accurate, resulting in care manoeuvres actually delivered but not recorded and representing a study data collection limitation. Sixth, this trial’s result may be influenced by the type of practices participating in the study. In FFS practices, physicians’ earnings are determined by the number of consultations provided and they do not receive financial incentives to deliver preventive services. Compared to other service models in Ontario, FFS practices are less likely to use systems to implement preventive guidelines, to have additional personnel to deliver preventive care21 and to deliver preventive services.22 FFS practices may have different priorities, particularly in conditions of physician scarcity, in addressing access to care.23 The study practices were not accepting any new patients at the time of the study. Thus, these motivated FFS practices may simply not have had the capacity (information, infrastructure, staff, etc.) to support improved prevention performance.
Characteristics of the intervention differed considerably across the studies. Intervention length ranges between 3 and 21 months, the number of intervention tools deployed between 3 and 10 and the number of monthly visits to practices by facilitators varied from 0.4 to 1.8.
We want to call attention to the score of the composite preventive performance index in the current study. Its low value clearly shows that there is still much room for improvement in the delivery of preventive care, even as per the secondary outcome measure of the study. It is not clear to us why the intervention produced statistically significant results as measured by the secondary outcome. However, it is worth noting that for both outcomes the intervention effect is very small.
Our study has several strengths: rigorous match-paired RCT design, primary and secondary outcome measures encompassing a large number of evidence-based preventive manoeuvres, data collection via chart review and patient surveys and double blinding of physicians and facilitators to the targeted manoeuvres. Nonetheless, the generalizability of our results is limited due to low practice recruitment rate, as the practices may not be representative of all FFS in Ontario.
Conclusion
Despite core similarities, many characteristics of multifaceted, outreach facilitation interventions vary. In comparison to other outreach facilitation trials, the large number of manoeuvres facilitated monthly and of practices assigned to facilitators produced a weak intervention leading to this trial’s lack of effect. However, it is not clear what the relative importance of each intervention modifications is or how they may have interacted with the practice’s capacity to change, limited by a lack of informational and multidisciplinary team support. External factors like physician supply could have also influenced the lack of effect. Future research could contribute valuable knowledge by testing intervention traits individually for detecting their specific effects. This would help to better calibrate outreach facilitation interventions. Decision makers and researchers interested on the subject could benefit from carefully considering how the setting’s and intervention’s characteristics may influence its effect. In addition, more information is needed to determine what would be the required intervention ‘dosage’ in different primary care contexts for the intervention to be effective.
Declaration
Funding: Canadian Institutes of Health Research (FRN# 44020).
Ethical approval: Ethics approval was granted by the Ottawa Hospital Research Ethics Board.
Conflicts of interest: None.
Authors’ contributions: Drs Hogg and Lemelin conceived the project. Drs Hogg, Lemelin, Graham, Moore, Grimshaw and Martin contributed to the detailed design of the study and oversaw its implementation, data collection, analysis and interpretation of the results. Dr Soto assisted with the analysis, drafted the paper and collated the revisions. Dr O’Rourke calculated the sample size and provided statistical assistance throughout the project. All authors critically reviewed the manuscript.
References
Author notes
Hogg W, Lemelin J, Graham ID, Grimshaw J, Martin C, Moore L, Soto E and O’Rourke K. Improving prevention in primary care: evaluating the effectiveness of outreach facilitation. Family Practice 2008; 25: 40–48.
