


Abstract
Background: Palliative medicine services have invested in the community to support people dying at home. To develop end-of-life care for older people, we need to know where they die.
Aim: To examine trends in age and location of death over the last 20 years.
Design: Retrospective death certificate review.
Method: All Wales death certificates from 1981 to 2001 were examined. Place of death and age were noted.
Results: Total deaths decreased from 35 015 in 1981 to 32 966 in 2001, and mortality decreased from 12.45 per 1000 population in 1981 to 11.33 in 2001. Deaths in the community decreased from 37.6% (n = 13 155) to 22.1% (n = 7293) (p < 0.001); deaths increased in hospital from 56.7% (n = 19 871) to 61.7% (n = 20 334) (p < 0.001) and in care homes from 5.7% (n = 1989) to 16.2% (n = 5339) (p < 0.001). Between 1981 and 2001, deaths in those aged 65–74 years dropped from 9752 to 6361, but increased in the over-85s from 5661 to 9779. Deaths amongst 75–84-year-olds remained stable at around 11 000. The biggest rise in hospital and care-home deaths was in those over 85: hospital deaths increased from 2928 in 1981, to 5438 in 2001; care-home deaths increased from 941 to 3141.
Discussion: The last 20 years have seen a significant shift in location of death from the community to hospitals and care homes. Those aged over 85 years account for the biggest rise in hospital and care-home deaths. End-of-life needs for older people need to be addressed in hospital and care homes, not just in the community.
Introduction
Palliative care arose in the 1950s and 60s from the observations of patients’ unrelieved physical and mental distress when dying.1 Hospitals at the time were commonly unsympathetic to the needs of the dying—terminally ill patients often being given low priority and perceived as medical failures2—whereas hospices emphasized patient-centred care.
Following the development of the hospice movement, home care services were incorporated into the speciality, as many patients express a wish to die at home.3,4 Currently, palliative care services manage most people at home, with nearly 10 times more being cared for at home than as in-patients.1,5 Many of the ongoing developments in palliative care are focused on the community.6
Although palliative care exists as a specialty, it only deals with a small proportion of dying patients, and mainly those with cancer. The model of care for cancer patients which encompasses diagnosis, treatment and palliative care is now well established.7,8 The majority of patients with non-cancer diagnoses have less access to specialist palliative care. Most are cared for by generalist medical staff.9
Patients with non-cancer diagnoses are also more likely to be older, have multiple co-morbidities and have a more unpredictable disease trajectory.10 There is good evidence that compared with cancer, end-of-life needs in non-cancer conditions such as heart failure are currently not being met.10 If anything, hospitals are even less focused on the needs of the dying nowadays, given medical and technical advances and current emphasis on diagnosis and treatment.11
Over the last 20 years, there has been a steady rise in the older population; the number aged 85 and over has nearly doubled. The number of people aged 60 and over is projected to increase from 12 million in 2001 to 18.6 million in 2031.12 Little progress to date has been made in extending end-of-life care to the older population.11,13 If we are to develop appropriate palliative services for older people, we need to know where they are dying.
The aim of this study was to examine trends in place of death, for young and old within the last 20 years throughout Wales.
Methods
Information was collected from the office of National Statistics for Wales. Death certificates over a 20 year period were examined from 1981 to 2001.
From each death certificate, place of death and age were noted. The variable ‘place of death’ was categorized as: care home, community, or hospital. Information on the age structure of the Welsh population and demographic shifts between 1981 and 2001 was obtained from the office of National Statistics for Wales (Health Solutions Wales). In 2001, Wales had a population of 2 903 085 serviced by 14 208 NHS hospital beds, of which 11 800 were occupied daily. Since the data were already in the public domain, the ethics committee advised that no further approval was necessary.
Statistical analysis used SPSS. The differences in proportions dying in the community vs. care homes vs. hospital were examined using χ2 analysis.
Results
Total deaths over the 20-year period gradually fell from 35 015 in 1981 to 32 966 in 2001. The total population has increased from 2.8 million to 2.9 million in this time period, hence total mortality has fallen from 12.45 to 11.33 per 1000 of the population.
In this time period, the age structure of the population of Wales has changed, with a fall in the population aged 0–44 years old (1 729 561 to 1 677 294) and 65–74 years old (272 271 to 264 123) while the numbers in the other age groups have risen 45–64 years old (643 454 to 724 745), 75–84 years old (138 979 to 182 825) and the over-85s (29 230 to 58 605). Of note, the numbers over 85 have doubled.
There has been a fall in the number of deaths under the age of 75, while deaths among 75–84-year-olds have remained relatively static, and deaths amongst the over-85s have nearly doubled, from 5661 deaths in 1981 to 9779 in 2001 (Table 1). From 1995 onwards, there were more deaths in the over-85s than in those aged 65–74 years. The greatest absolute reduction in deaths has been in the 65–74-year-olds, from 9752 deaths in 1981 to 6361 deaths in 2001. The shift in deaths from <75 years to >85 years is consistent with the ageing of the population.
Total deaths for all ages and (age specific mortality rate per 1000 population)
| Age (years) … | 0–44 | 45–64 | 65–74 | 75–84 | 85+ |
|---|---|---|---|---|---|
| 1981 | 1711 (0.99) | 6398 (9.94) | 9752 (35.82) | 11 493 (82.7) | 5661 (193.67) |
| 1982 | 1572 (0.91) | 6299 (9.83) | 9710 (36.09) | 11 800 (83.15) | 5771 (189.83) |
| 1983 | 1591 (0.92) | 6437 (10.05) | 9404 (35.66) | 11 877 (81.82) | 5933 (189.13) |
| 1984 | 1472 (0.86) | 6026 (9.38) | 8936 (34.40) | 11 373 (76.37) | 5845 (178.46) |
| 1985 | 1558 (0.91) | 6153 (9.68) | 9106 (34.31) | 12 210 (80.32) | 6507 (190.01) |
| 1986 | 1531 (0.89) | 5844 (9.28) | 9009 (33.30) | 12 078 (78.59) | 6250 (173.61) |
| 1987 | 1537 (0.89) | 5552 (8.85) | 8803 (32.11) | 11 635 (74.55) | 6392 (168.38) |
| 1988 | 1434 (0.83) | 5299 (8.40) | 8797 (31.82) | 11 525 (72.68) | 6926 (174.09) |
| 1989 | 1475 (0.85) | 5098 (8.03) | 8934 (32.04) | 12 238 (75.69) | 7389 (178.07) |
| 1990 | 1397 (0.80) | 5027 (7.88) | 8617 (30.71) | 11 721 (71.76) | 7201 (166.51) |
| 1991 | 1409 (0.81) | 4684 (7.31) | 8665 (30.49) | 11 753 (71.74) | 7625 (169.16) |
| 1992 | 1376 (0.80) | 4640 (7.10) | 8532 (29.83) | 11 399 (69.49) | 7845 (167.22) |
| 1993 | 1372 (0.80) | 4824 (7.25) | 8820 (30.63) | 12 096 (74.56) | 8714 (176.96) |
| 1994 | 1324 (0.77) | 4613 (6.85) | 8545 (29.57) | 11 178 (69.68) | 8146 (161.15) |
| 1995 | 1436 (0.84) | 4531 (6.65) | 8359 (29.48) | 11 886 (71.52) | 9025 (172.58) |
| 1996 | 1342 (0.79) | 4361 (6.34) | 7930 (28.44) | 11 884 (69.71) | 9103 (169.65) |
| 1997 | 1364 (0.81) | 4326 (6.23) | 7778 (28.36) | 11 726 (67.35) | 9488 (172.90) |
| 1998 | 1294 (0.77) | 4229 (6.02) | 7428 (27.40) | 11 385 (64.52) | 9374 (166.55) |
| 1999 | 1409 (0.84) | 4296 (6.06) | 7232 (27.04) | 11 818 (66.41) | 9975 (174.58) |
| 2000 | 1365 (0.81) | 4107 (5.73) | 6654 (25.08) | 11 402 (63.44) | 9785 (168.19) |
| 2001 | 1323 (0.79) | 4111 (5.67) | 6361 (24.08) | 11 392 (62.31) | 9779 (166.86) |
Age-specific mortality rates have fallen in all age groups. Despite the big increase in total deaths for the over-85s, their age-specific mortality rate has fallen. The relative reduction in age-specific mortality has been greatest in those 45–64 years old (43%), then 65–74 years old (32.8%), 75–84 years old (24.7%), 0–44 years old (20.2%) and lastly the over-85s (13.8%).
Throughout this 20-year period, there has been a steady fall in the absolute numbers and percentage of deaths occurring in the community (p < 0.001) (Table 2). From 1981 to 1986, the percentage of deaths occurring in hospital started to rise from 56.7% to 58.7%, while deaths in care homes also showed a modest rise for this period from 5.7% to 7.8%. From 1986 to 1994, there was a fall in the percentage of deaths occurring in hospital from 58.7% to 57%, and a steep rise in deaths occurring in care homes from 7.8% to 15.8%.
The number and (percentage of deaths in each location) over the 20-year period
| Location … | Hospital | Community | Care home |
|---|---|---|---|
| 1981 | 19 871 (56.7%) | 13 155 (37.6%) | 1989 (5.7%) |
| 1982 | 19 940 (56.7%) | 13 009 (37.0%) | 2203 (6.3%) |
| 1983 | 20 118 (57.1%) | 12 834 (36.4%) | 2290 (6.5%) |
| 1984 | 19 501 (58.0%) | 11 968 (35.5%) | 2183 (6.5%) |
| 1985 | 20 736 (58.3%) | 12 178 (34.3%) | 2620 (7.4%) |
| 1986 | 20 384 (58.7%) | 11 625 (33.5%) | 2703 (7.8%) |
| 1987 | 19 836 (58.5%) | 10 899 (32.1%) | 3184 (9.4%) |
| 1988 | 19 813 (58.3%) | 10 385 (30.6%) | 3783 (11.1%) |
| 1989 | 20 272 (57.7%) | 10 468 (29.8%) | 4394 (12.5%) |
| 1990 | 19 459 (57.3%) | 9 860 (29.0%) | 4644 (13.7%) |
| 1991 | 19 419 (56.9%) | 9 750 (28.6%) | 4967 (14.5%) |
| 1992 | 19 167 (56.7%) | 9 425 (27.9%) | 5200 (15.4%) |
| 1993 | 20 484 (57.2%) | 9 485 (26.5%) | 5857 (16.3%) |
| 1994 | 19 281 (57.0%) | 9 203 (27.2%) | 5322 (15.8%) |
| 1995 | 20 318 (57.7%) | 9 205 (26.1%) | 5714 (16.2%) |
| 1996 | 20 169 (58.3%) | 8 769 (25.3%) | 5682 (16.4%) |
| 1997 | 20 346 (58.7%) | 8 532 (24.6%) | 5804 (16.7%) |
| 1998 | 20 125 (59.7%) | 7 971 (23.6%) | 5614 (16.7%) |
| 1999 | 20 937 (60.3%) | 8 012 (23.1%) | 5781 (16.6%) |
| 2000 | 20 254 (60.8%) | 7 604 (22.8%) | 5454 (16.4%) |
| 2001 | 20 334 (61.7%) | 7 293 (22.1%) | 5339 (16.2%) |
From 1994 onwards, the percentage of deaths occurring in care homes has remained relatively static, and the percentage of deaths in hospital has continued to rise up to 61.7%. Throughout this whole period, the percentage of deaths occurring in the community continuously fell, from 37.6% to 22.1%.
Thus there has been a significant shift in location of death from the community into the hospital and care home over the 20-year period. The increases in care-home deaths occurred mainly in the mid-80s and early 90s, and the increase in hospital deaths has been mainly from the mid-90s.
Much of the shift in location of death into hospital and care home for the whole population has occurred in the over-85 age group. This is the group in whom there has been a big absolute increase in deaths of over 4000 (Table 1). Hospital deaths in the over-85s have nearly doubled, from 2928 in 1981, to 5438 in 2001, and care home deaths have tripled, from 941 in 1981, to 3141 in 2001 (Figure 1). In the 75–84-year-olds, hospital deaths increased slightly (6746 in 1981, 7437 in 2001) and care home deaths increased from 748 to 1627 over the 20-year period. In the other age groups, total deaths have fallen, and on the whole there has been a reduction in both hospital deaths and community deaths (Figure 2).
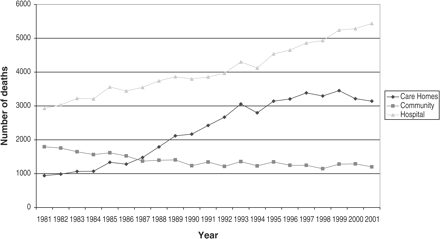
Deaths in those aged 85+ years, by location.
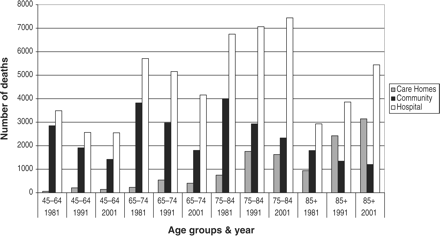
Deaths in various age groups, by year and location.
By 2001, the majority of hospital deaths were in the over-75s (63.3%), while in the community, deaths were more evenly distributed across age groups: 48.4% in the over-75s and 51.6% in the under-75s. The majority of care-home deaths are in the older age group as expected: 89.3% in the over-75s and 10.7% in the under-75s, in 2001.
Discussion
This study has demonstrated a shift in the last 20 years in the location of death from the community into care homes and hospitals. The total number of deaths in the community has been halved, while the number in hospital has gone up slightly and the number in care homes has nearly trebled. These changes in location of death have been particularly marked in the over-85s, the age group that has experienced a large increase in absolute number of deaths. Their end-of-life needs need to be addressed.
This is a new growth area for palliative medicine, as the older population is predicted to continue to increase in numbers for the next 40–60 years.12 Much palliative care research and service development has focused on cancer patients and the need to support patients dying in the community.14 Palliative care services in Wales consist of 16 in-patient units with a total of 141 beds (73 NHS, 68 voluntary sector). This is approximately 48 beds per million population. The majority of palliative care is delivered by community services comprising 33 home care units, 11 hospice at home and 20 day-care units.15
Traditionally, palliative care in the UK has focused on meeting the needs of the middle-aged cancer population. Palliative care needs of the old may be very different to those of a younger population. Much of the older population's palliative care needs are in relation to non-malignant conditions and multiple pathology.14 Older people's social and family support structures differ from those of younger people, particularly given changes in society in the last 20 years, including loss of the extended family, women working and a shift towards a more secular society. Existing palliative care models developed for a predominantly younger, commonly single pathology group may not fit well onto the very old. The needs and preferences of the very old need to be addressed, with appropriate development of services centred around their needs. Most cancer patients want to die at home,3,4 but recent qualitative research suggests that many older people would prefer to be cared for somewhere other than in their own home, as they do not want to burden their families during their final stage of life.16 Further research in this field is vital in order to plan/develop services in a patient-centred fashion, for an older population who are probably quite heterogeneous in their wishes and needs.
Currently, the vast majority of over-75s die in hospital and care homes. There is a suspicion that the majority who die in acute hospitals and nursing homes have a bad experience.17 Health care professionals inexperienced in the philosophy of palliative care often undertake the care of these predominantly elderly patients.17 Palliative care needs to be holistic and extend beyond physical needs: alleviation of individual patients’ emotional, social and spiritual problems should be an integral part of care.11 In order to achieve this, training in palliative care needs to be extended to generalists, geriatricians and the multi-disciplinary team.
Beyond the hospital, palliative care in care homes needs to be developed. Maximizing quality of life and individual choice should help ensure that spending one's last days in a long-term care facility is a humane and dignified experience.
Currently, there are very few proactive structures in place for managing end-of-life needs in care homes in the UK.18,19 It has largely been left to social services to identify and address needs. Neither GPs nor geriatricians are contracted to manage patients in nursing homes proactively. Instead reactive episodic care is the norm, with some emphasis in the new GP contract on chronic disease management for individual diseases, but no focus on multiple co-morbidities in the setting of complex disabilities.20 This contrasts with the US, where geriatricians have a proactive role in managing frail elderly patients within the nursing home.21,22
End-of-life needs in nursing homes are complicated by dementia, which affects almost two-thirds of nursing home patients in the UK.23 The presence of dementia impacts on end-of-life needs in several ways. Pain is under-assessed and under-treated in patients with significant cognitive impairment and/or communication difficulties.24 Further work needs to done on the prevention, assessment and alleviation of agitation and distress in these patients. There are also complex practical and ethical issues surrounding the maintenance of adequate nutrition in this population.25 Advance directives/living wills have been used in the USA to assist with such complex decisions. The Mental Capacity Act (passed by Parliament 2005, due to come into effect in 2007) has now clarified the legal status of advance directives for the UK.
Finding solutions to many of these challenges needs skills in palliative medicine as well as geriatric medicine. Collaborative training and exchange of expertise across specialities is needed, if we are to meet the needs of older people who are dying.
This study has shown that despite the development of community palliative care services, there has been a significant shift in the location of death from community to hospital and care home in the last 20 years. Much of this shift in location of death has occurred because of the ever-increasing number of older people who are dying, especially those aged over 85 years. Their needs in hospital and care homes need to be urgently addressed.
References
The Hospice Information Service.
Higginson I, Sen-Gupta GJA. Place of care in advance cancer: A qualitative systematic literature review of patient preferences.
Department of Health.
Scottish Executive Health Department.
Murray SA, Boyd H, Kendall M, Worth A, Benton TF, Clausen H. Dying of lung cancer or cardiac failure: prospective qualitative interview study of patients and their carers in the community.
Seymour J, Clark D, Philip I. Palliative care and geriatric medicine: shared concerns, shared challenges.
The Hospice Information Service.
Gott M, Seymour J, Bellamy G, et al. Older people's views about home as a place of care at the end of life.
Goodman C, Woolley R, Knight D. District nurse involvement in providing palliative care to older people in residential care homes.
Froggatt KA, Hoult L. The provisions of palliative care in nursing homes and residential care homes.
Royal College of General Practitioners.
Winn PA, Dentino AN. Quality palliative care in long term care setting.
Ouslander JG, Osterweil D, Morley J.
Fox PL, Raina P, Jadad AR. Prevalence and treatment of pain in nursing homes.
