Article Text

Abstract
Background An algorithm that detects errors in diagnosis, classification or coding of diabetes in primary care computerised medial record (CMR) systems is currently available. However, this was developed on CMR systems that are episode orientated medical records (EOMR); and do not force the user to always code a problem or link data to an existing one. More strictly problem orientated medical record (POMR) systems mandate recording a problem and linking consultation data to them.
Objective To compare the rates of detection of diagnostic accuracy using an algorithm developed in EOMR with a new POMR specific algorithm.
Method We used data from The Health Improvement Network (THIN) database (N = 2,466,364) to identify a population of 100,513 (4.08%) patients considered likely to have diabetes. We recalibrated algorithms designed to classify cases of diabetes to take account of that POMR enforced coding consistency in the computerised medical record systems [In Practice Systems (InPS) Vision] that contribute data to THIN. We explored the different proportions of people classified as having type 1 diabetes mellitus (T1DM) or type 2 diabetes mellitus (T2DM) and with diabetes unclassifiable as either T1DM or T2DM. We compared proportions using chi-square tests and used Tukey’s test to compare the characteristics of the people in each group.
Results The prevalence of T1DM using the original EOMR algorithm was 0.38% (9,264/2,466,364), and for T2DM 3.22% (79,417/2,466,364). The prevalence using the new POMR algorithm was 0.31% (7,750/2,466,364) T1DM and 3.65% (89,990/2,466,364) T2DM. The EOMR algorithms also left more people unclassified 11,439 (12%), as to their type of diabetes compared with 2,380 (2.4%), for the new algorithm. Those people who were only classified by the EOMR system differed in terms of older age, and apparently better glycaemic control, despite not being prescribed medication for their diabetes (p < 0.005).
Conclusion Increasing the degree of problem orientation of the medical record system can improve the accuracy of recording of diagnoses and, therefore, the accuracy of using routinely collected data from CMRs to determine the prevalence of diabetes mellitus; data processing strategies should reflect the degree of problem orientation.
- computerized
- diabetes mellitus
- epidemiology
- medical records
- medical record systems
- problem-oriented
- records as topic
Commons license http://creativecommons.org/licenses/by/4.0/
Statistics from Altmetric.com
- computerized
- diabetes mellitus
- epidemiology
- medical records
- medical record systems
- problem-oriented
- records as topic
Introduction
Diabetes is a global epidemic with an international consensus that there is an increasing prevalence.1,2 In the UK, diabetes is increasingly being recognised as one of the biggest threats to health. It is predicted that prevalence levels are set to climb over the coming 25 years as the western populations continue to age.3 Accurate record keeping is important if health services are going to accurately monitor the burden of diabetes and other chronic diseases. Computerised medical records (CMR) now occupy a central role within health systems, particularly primary care; increasingly monitoring of chronic disease prevalence is based on routinely collected data and for many conditions, this is based on routinely collected data derived from CMR systems.4
We developed computerised algorithms to detect errors in diagnostic accuracy in diabetes within CMR. These algorithms were primarily developed as self-audit tools to identify potential errors in the recording of information about diabetes cases.5,6 Errors in diagnostic accuracy can be broadly divided into miscoding, misclassification and misdiagnosis.
Miscoding most commonly arises from the use of an ambiguous code which does not allow the type of diabetes to be determined. For example, the Read code C1001: Diabetes mellitus, adult onset, with no complications is more likely to be type 2 diabetes mellitus (T2DM), but it could also be type 1 diabetes mellitus (T1DM), as T1DM can start at all ages. C1001 is therefore a ’miscoding‘ if it is the only label of diabetes within a CMR system. Whilst classification can sometimes be challenging, our experience is that is not what underlies most of this miscoding.6
Misclassification is defined as when a case is incorrectly classified into a category to which the subject does not belong. For example, a person who really has T2DM is classified as T1DM.7 This matters because management plans, treatment goals and educational programmes are orientated towards the correct type of diabetes.
Misdiagnosis is the allocation of an incorrect diagnosis, which is diagnosing diabetes in someone who does not have the condition. For example, people might have one abnormal test or impaired fasting hyperglycaemia but would have not fully met the diagnostic criteria for diabetes.
The CMR systems used in UK primary care are described as problem orientated, in that information and prescriptions can be linked to the relevant problem. However, the degree of problem orientation varies. In this paper, we describe those systems that are strictly problem orientated as problem orientated medical records (POMR) and those that don’t strictly impose linking data to an existing problem we describe as episode orientated medical records (EOMRs). The latter CMR systems record episodes of care, generally consultations between doctor and patient, but lack strict problem orientation and do not enforce the recording of a problem title or linkage of a consultation to an existing or new problem.
The problem-oriented patient record was proposed in the late 1960s by Weed 8,9 who at the time lamented on what he described as the dismal state of patient record keeping. Weed proposed that data be ordered according to the patient’s problems. In POMR, each problem should be described according to the subjective information (patient’s history of the problem), objective information (collected by the physician), assessment (again largely made by the physician) and plan; these elements are known by the acronym ’SOAP‘ (for Subjective, Objective, Analysis, Plan). POMR should also assist the physician in relating each patient attendance to previously identified problems, including chronic conditions. The POMR structure is intended to improve record structure and promote better care; however, this approach has not been adopted by all system vendors; where it has been, the strictness of the problem orientation varies.10
The algorithms we originally developed to measure the diagnostic accuracy of medical records were largely evaluated using EOMR systems. Because multiple distinct codes for diabetes were common in these systems, the algorithms required at least two separately recorded, or identical or nearsynonym codes, supporting a diagnosis; and also allowed up to one contradictory code. Research using video observation of clinical consultation suggests that there is less variation of coding in strictly POMR CMR systems compared with those that we describe as EOMR.11,12 We therefore developed a different approach for POMR systems.
This study was carried out to explore how the new algorithm, designed for use in POMR systems, performed compared with our existing algorithms largely developed on EOMR systems.
Method
Overview
There were three stages to the method:
Stage 1: Creating a subset of The Health Improvement Network (THIN) database made up of people with: a diabetes disease code, prescribed therapy used in diabetes, or random or fasting blood glucose results compatible with a diagnosis of diabetes. Those with a definite other type of diabetes (e.g. genetic and steroid induced) were excluded. The codes for diabetes were classified into those that could be directly or partially mapped, or had no clear mapping to a diagnosis of T1DM or T2DM.
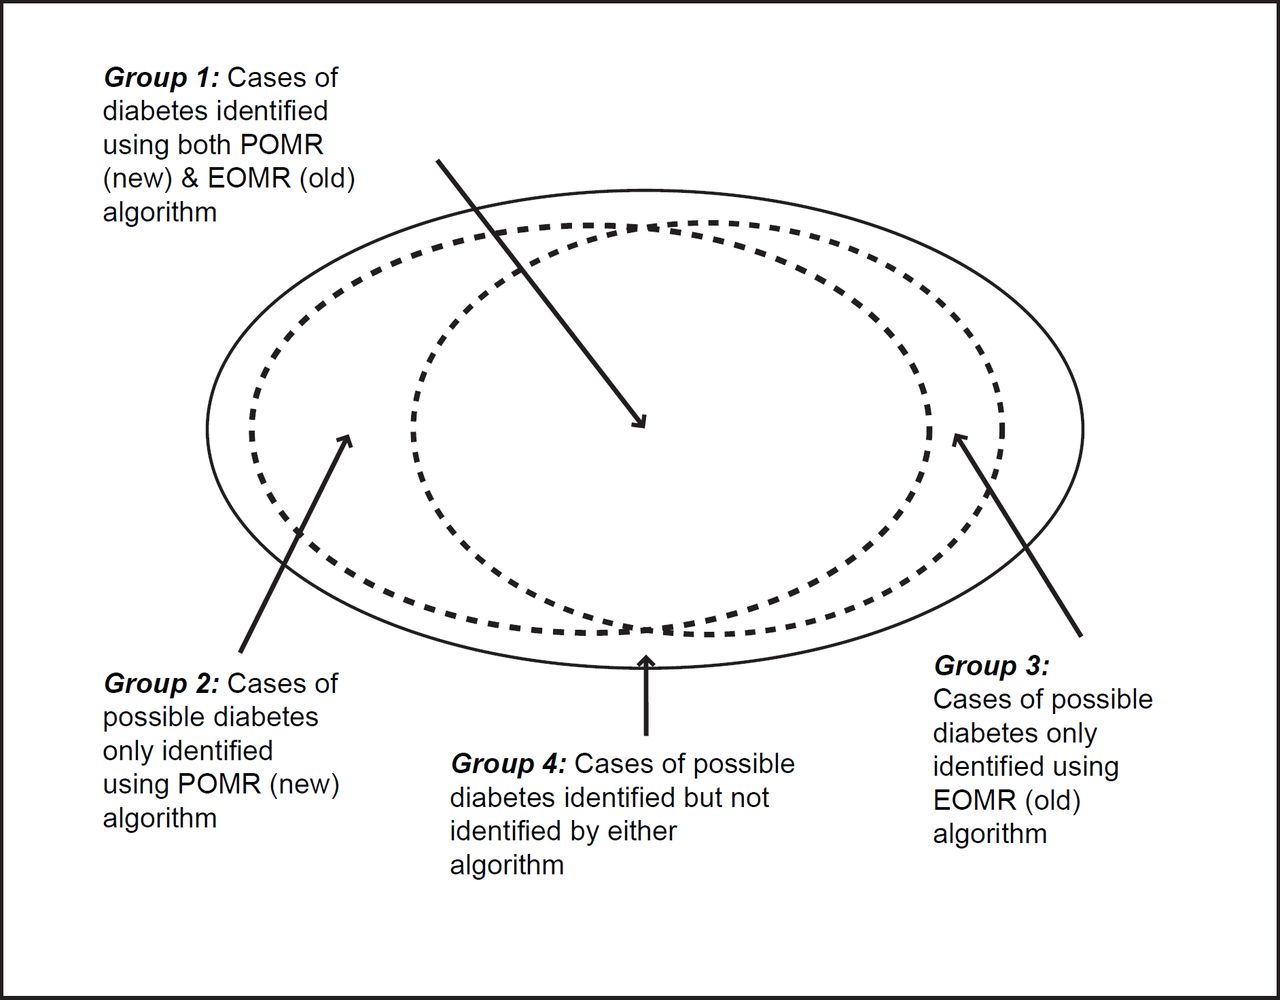
Stage 2: Applying both our original EOMR compatible algorithm and the modified POMR algorithm to this subset. Our principle analysis looked at the number and proportion of people who could be classified into definite, probable and possible T1DM or T2DM cases (Figure 1), or who could not be so classified.
Stage 3: Comparing the characteristics of patients who could be dual-classified by both algorithms (i.e. EOMR and POMR), only one algorithm (EOMR-only or POMR-only), or neither of the algorithms.
Stage 1: Creating a subset of the THIN database with possible diabetes and code mapping.
The THIN database comprised practices that use InPS Vision, which is one of the most strictly problem orientated CMR systems available in the UK. This POMR system insists that all data entered are linked to a problem.
By way of contrast, EOMRs allow the user to file notes without a problem being entered. They also allow the user to enter multiple near synonyms for the same problem. For example, in an EOMR a patient with diabetes might have definite diagnostic codes combined with more vague codes. (e.g. the Read code C10F: T2DM is a ‘definite code’ for T2DM; whereas C104z: diabetes mellitus with nephropathy NOS is a code stating a complication, and does not allow the type of diabetes to be determined.)
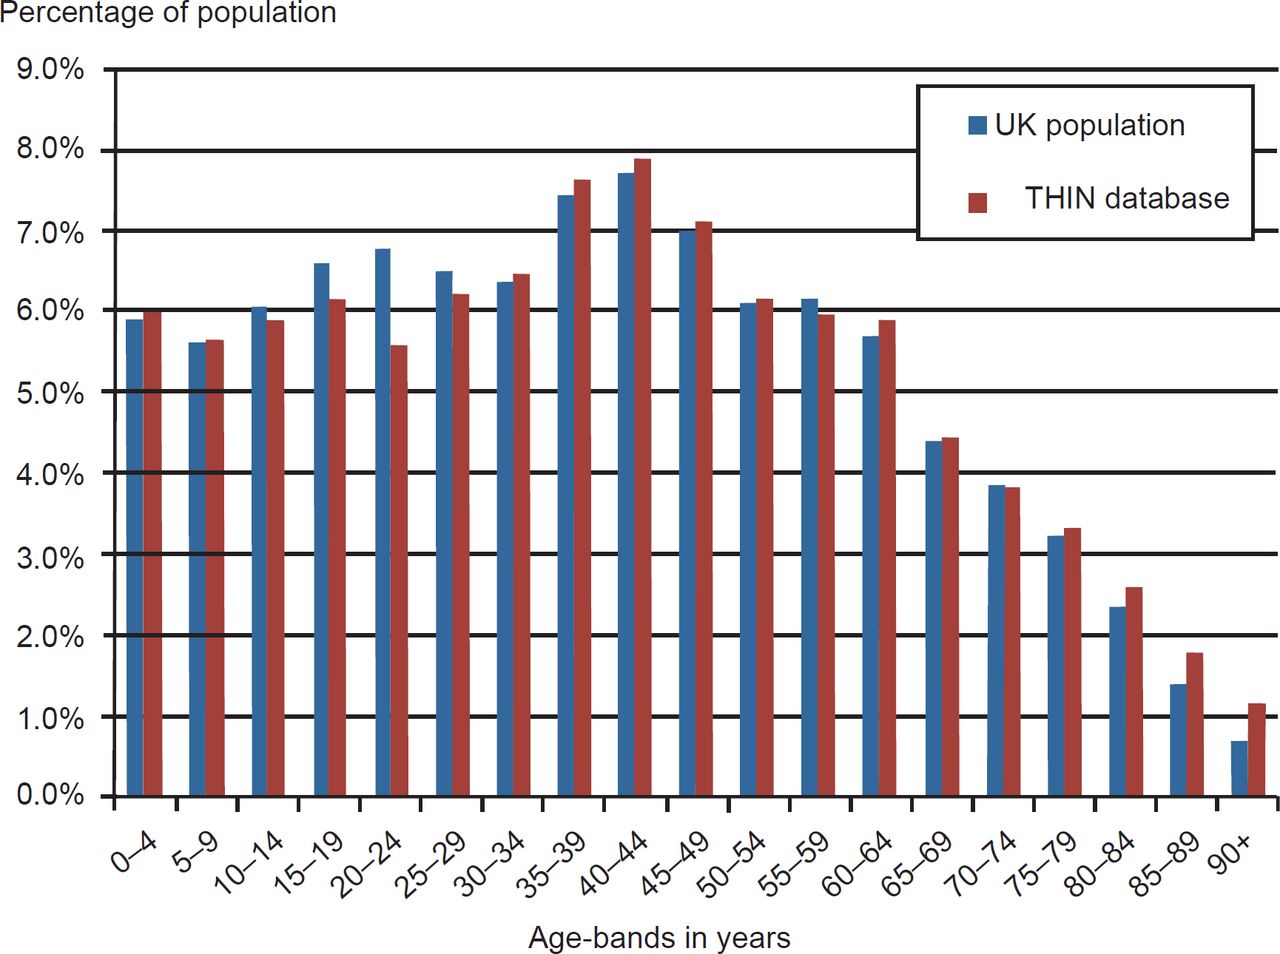
The THIN database comprised approximately 2.5 million records (N = 2,466,364) with an age–sex distribution similar to the English National population (Office for National Statistics 2007 estimate shown in Figure 2). The distribution of men and women was 1,225,008 and 1,241,356, respectively. The age distribution within the THIN cohort followed a similar distribution of the UK national population of 2007. Practices throughout the UK belong to THIN and are broadly representative of the UK population in terms of patients’ demographics and other characteristics.13,14 We performed our analyses on data collected up to 2009. The subset we created included any diagnostic code for diabetes (Read code C10%) or coded records of therapy for diabetes and blood glucose measures that met the WHO diagnostic diagnosis of diabetes.15 Additionally for all patients, we extracted age, gender, latest random or fasting blood glucose and recording of body mass index (BMI). We excluded people with a definite other type of diabetes (n = 393). These 393 excluded individuals comprised 253 people with rare forms of diabetes; steroid induced (n = 123) and autosomal dominant (n = 64) were the commonest. One hundred and forty people had C10 codes for metabolic disorders that are not diabetes. The crude prevalence of T1DM and T2DM diabetes was 4.08% (100,513/2,466,364), based on any code that implied diabetes.

We mapped all the diabetes codes in the subset. Codes were categorised into those which could be definitely or partially mapped to T1DM or T2DM, and those with no clear mapping. Additionally there was a fourth category of codes which could not be mapped to either T1DM or T2DM. For example, the Read codes C10E, C10F and nearly all their child codes directly map onto codes for T1DM and T2DM, respectively. Some codes partially map. For example, the Read code C1001: maturity onset diabetes probably represents T2DM. Other codes have no clear mapping, and it is impossible to tell what type of diabetes, though most of these are likely to represent possible T2DM.16 Our mapping was based on the work completed as part of the NHS Diabetes⁄Royal College of General Practitioners (RCGP) practical classification of diabetes.17,18
Stage 2: Applying our POMR (new) and EOMR (old) algorithms to the subset of data
The primary categorisation of patients was based on the mapping diagnostic codes, our original EOMR algorithm required at least two codes and our new POMR algorithm accepted single diabetes code that were not contradicted and continued to accept near synonyms (e.g. type 2 and maturity onset). Additional steps included checking therapy and blood tests were compatible with the diagnosis; these were the same steps used in.5,6,16,18 The details of these steps were as follows:
Diabetes diagnosis. We categorized T1DM, T2DM into definite, probable, and possible; those we could not categorise we labelled as uncertain. We used chi-square tests to compare the proportions assigned to each type of diabetes identified by the two algorithms.
Definite cases had specific diagnostic code that could be directly mapped to a specific type of diabetes (in the UK, the Read codes C10E are used for T1DM and C10F for T2DM), and there were no contradictory codes. In EOMR systems, we required a minimum of two directly mapped codes for that type of diabetes with no contradictory codes to qualify as a definite diagnosis of a specific type of diabetes. In the POMR algorithm, we allowed a single not contradicted code, because the strict problem orientation does not allow other coding variants to be readily recorded.
Probable cases were selected on the basis of codes that could only partially be mapped to a specific type of diabetes (e.g. maturity onset diabetes instead of T2DM) or where there were two definite codes for a type of diabetes with one contradictory code allowed (e.g. someone with most codes for T1DM but with one for T2DM). We restricted our mapping to T1DM and T2DM. Alternatively, especially in EOMR systems, they might have two not contradicted codes that partially map to T1DM or T2DM.
Possible cases comprised people with vague high-level codes with no clear mapping to either T1DM or T2DM (e.g. just C10: Diabetes mellitus), and those with type specific but contradictory Read codes or therapeutic information. Often their therapy indicated if they were possible T1DM or T2DM. It is generally basing our categorisation on latest therapy.
Uncertain cases are where we lacked sufficient data to meet the criteria above; for example, a patient prescribed insulin with both T1DM and T2DM codes.
Therapeutic data. Prescribed medications were divided into the following groups: insulin and other oral antidiabetes drugs (OADs). The following logic was applied: everyone with T1DM should be prescribed insulin. People with T2DM can be prescribed insulin alone (causing potential confusion with T1DM), insulin plus OAD, or OAD, or no therapy. People with either type of diabetes may be prescribed urine or blood test strips for testing for glucose. Incompatible therapy was considered to be a coding contradiction.
Laboratory data. Blood glucose measures were extracted where recorded in the last year, prior to the extraction. These results are coded as random blood glucose (RBG), fasting blood glucose (FBG) or simply as glucose levels. The latter category does not allow differentiation between fasting and non-fasting specimens; such results were grouped with random blood glucose.19
Other data. Where available, we used age and BMI recorded in the last year to assist in categorising cases into the most likely category. People with T1DM we presumed would be more likely to be younger more obese people. We applied cut-offs at age < 35 years and BMI > 30 kg/m2 to identify this group.6
These data were therefore divided into those with a classifiable code of diabetes (definite, probable and possible) and those with unclassifiable codes for diabetes.
Stage 3: Comparing the groups identified by the POMR and EOMR algorithms
Patients were further grouped according to how they were classified by the two algorithms. Patients who were classifiable (as definite, probable or possible T1DM or T2DM) by both the EOMR and POMR algorithm are referred to subsequently as the ’dual-classified‘ group, or group A. Patients who were classifiable by only one algorithm are referred to as POMR-only (group B) or EOMR-only (group C), respectively. Patients who could not be assigned a diabetes type using either algorithms are referred to subsequently as ‘unclassifiable’ (group D).
For the four groups so defined, we compared the following characteristics: age, BMI, RBG and FBG. We compared the group mean values using Tukey’s test to allow for multiple pairwise comparisons, reporting any differences at the 0.05 level of significance. Tukey’s test is one that compares all possible combinations of means to give an estimate if they are truly different. It is used to determine which among a set of means truly differ from the rest. Analysis of variance would tell if the means differ, while Tukey’s test informs which of the means are different. This approach is used in this paper to differentiate between those who are, or are classified as, having diabetes in the different types of record system.
We also report the therapy in each group; we did this to see if we could infer what type of diabetes it was likely that people identified by either of the algorithms alone might have.
Results
Comparing estimated prevalence of T1DM and T2DM using the new POMR – and the original EOMR – algorithms
We compared the prevalence of T1DM, T2DM and unclassified diabetes as estimated using the POMR and EOMR algorithms (Table 1). The POMR algorithm identified around 16% fewer cases of T1DM (7,750/2,466,364 for an estimated prevalence of 0.31%) compared with the EOMR algorithm (9,264 cases, prevalence 0.38%). In contrast, the POMR algorithm identified 13% more cases of T2DM (89,990 cases and prevalence 3.65%) than the EOMR estimate (79,417 cases and prevalence 3.22%). A much smaller proportion (2.4%) of diabetes cases was unclassifiable by the POMR algorithm than by the EOMR algorithm (11.4%). All these differences were highly significant (p < 0.0001).
Comparing the age, BMI and blood glucose levels between dual classified, POMRonly, EOMR-only and unclassifiable patient groups
We compared the age, BMI, and blood glucose (RBG and FBG) for the cases classified by either of the algorithms (Figure 1). The dual classified (group A) and POMR only (group B) patients were very similar in terms of mean (66 years) and median (68 years) age, while the EOMR-only (group C) were on average 7 years older (mean 73 years and median 75 years).
Mean BMI was highest in the dual-classified group (30.8 kg/m2) and the POMR-only group (30.3 kg/m2). Both these groups had significantly higher mean BMI than the EOMRonly group (mean 29.4 kg/m2), which had the lowest mean BMI of all groups (Tables 2 and 3).
RBG was highest in the POMR-only (11.1 mmol/L) and dualclassified groups (10.4 mmol/L), and in both these were significantly higher than the EOMR-only group (6.9 mmol/L) and the unclassifiable group (7.6 mmol/L). FBG levels showed a very similar pattern, being highest in the POMR-only and dual classified groups, and significantly lower in the EOMR-only and unclassifiable groups.
In summary, the higher BMI and blood glucose levels in the cases classified by both and the new POMR algorithm appear to be more compatible with diabetes than the lower BMI and much lower levels of glucose recorded in people not classified by either of the algorithms.
Comparing the therapy and blood glucose testing between dual classified, POMRonly, EOMR-only and unclassifiable patient groups
Almost a quarter (24.5%) of the dual classified group and over a third (34.6%) of the POMR-only group were prescribed insulin (Table 4). By contrast, only 4.8% of the unclassifiable cases and none of the EOMR-only group were prescribed insulin.
As expected, the majority of prescribing overall was for OAD mainly used in T2DM. Some form of OAD was prescribed to 79.9% of the dual-classified and 91% of the POMR-only groups. Only 12.2% of the unclassifiable group were prescribed OADs, and none of the EOMR-only groups were receiving any medical therapy for diabetes.
Summary of Results
Based on their age, BMI and blood glucose profiles, along with their prescribing history, the dual-classified group looks quite typical of a mixed population of T1DM and T2DM patients. The additional group of cases classified by the POMR algorithm alone are very similar to the dual classified group, and their characteristics are also highly consistent with them having a mixture of T1DM and T2DM. In contrast, the group classifiable only using the EOMR algorithm was somewhat atypical: one the one hand they appear to be the best controlled in terms of blood glucose level, while on the other hand, they are receiving no prescriptions for anti-diabetic therapy. On this basis, it is tempting to speculate that many patients in this group either do not have diabetes, or maybe borderline cases. Finally, based on blood glucose, many of the people not classifiable by either of the algorithms appear not to have diabetes, yet approximately 13% of this group are receiving medical treatment for this condition.
Discussion
Principal findings
Compared with the original EOMR algorithm, the ’new‘ POMR algorithm identified significantly fewer patients with T1DM (7,750 versus 9,264, p < 0.0001, Table 1), and significantly more patients with T2DM (89,990 versus 79,417, p < 0.0001). There are a large number of cases where the type of diabetes is uncertain from the code used. The new POMR algorithm left 2.4% of diabetes diagnosis labelled ’uncertain‘ and the EOMR 11.4%; when run against data from a strictly problemorientated system.
The characteristics of the cases classified by both algorithms and the additional cases just identified by the new POMR algorithm are strongly suggestive of these individuals having diabetes. The cases just identified by the EOMR algorithm may be less likely to have diabetes. However, there are potentially cases not identified by either of the algorithms.
Implications of the findings
Our results suggest that the algorithms which underpin such tools may need to be tailored to the specific CMR system on which they are run. Specifically, we found that the algorithm developed for a more EOMR system performed less well when applied to more a strictly POMR database, than an algorithm that was specifically adopted to that system.
Improving the quality of diabetes related coding has clear benefits in terms of patient management and safety. For example, patients with a non-specific diabetes diagnosis are more likely to have poor glycaemic control.20
The quality of routinely collected electronic information and their fitness for purpose is determined by more than just the GIGO – garbage in garbage out – principle; there needs to be a wider adoption of ontological principles that confirm the compatibility of diagnostic codes with the demographics of the patient, other diagnoses, therapy and investigations.21
Different types of clinical computer system may require different approaches. Algorithms that have performed well in one system may not do so on another. It is also plausible that strict problem orientation, as found in this system, resulted in improved data quality compared with less problem orientated systems. Researchers using primary care databases need to take into account both the limitations of coding within a single CMR system as well as systematic differences in coding between databases derived from different CMR systems.
Comparison with the literature
This study confirms the findings of previous research which identified different types of errors and discrepancies in the recording of information about diabetes.5–7,16,18,19 Practitioners using CMR will increasingly need access to tools, which identify and allow for correction of diabetes related coding errors.
Systematic reviews have found that, despite methodological shortcomings, inconsistent definitions and considerable heterogeneity in interventions, patient populations, processes and outcomes of care,22 integrated care programs can improve the quality of patient care.10 Good quality data collected as part of routine clinical care is required to address this evidence gap cost effectively. Routinely collected electronic health care data, aggregated into large clinical data warehouses, are increasingly being mined, linked and used for audit, continuous quality improvement in clinical care, health service planning, epidemiological study and evaluation research. Managing the increasing amount of routinely collected data is therefore a priority.
The benefit of a POMR system is it encourages users to commit to a previously entered condition as opposed to creating a separate stand-alone entry. This ‘joined up’ coding system has the added advantage of reduced variability in coding for any given patient. By doing so, the chance of vague coding reference from multiple attendances is avoided. This system design assists, therefore, in maintaining data quality. This is the first set of data to critically compare how different data extract approaches might be needed for POMR compared with EOMR.
We have stopped short of saying that POMR are superior to EOMR, though they may be for chronic diseases such as diabetes. This is because we know from multichannel video observation of the clinical consultation that users of more problem orientated systems appeared to code more, and to be more likely to code consistently chronic diseases such as diabetes.11,12 However, the downside of this approach is that the small number of doctors we directly observed using these systems would link minor problems to make common threads. An example of this was a doctor who widely used the code: Had a chat to patient (Read code 8CR), which was of less use in understanding the nature of the consultation than a more problem related new episode title.
Limitations of the methods
We have no gold standard for those who truly have diabetes in the population. This study like much of our other work in this area seeks to infer meaning from routine data.
The limitations of routine data are well described; they are not only rich but also inconsistent. The data quality is poor in about 5% of records in health organisations.23–25 Many studies regularly report a range of deficiencies in the routinely collected electronic information for clinical6,26 or health promotion23 purposes in hospital27 and general practice28 settings.
Larger studies simultaneously comparing data from more than one CMR system are required to elucidate if there are other more subtle differences between the algorithms.
Call for further research
We need to develop more formalised ways of developing and sharing algorithms and ontologies to sort complex datasets.29,30 The aggregation of increasingly large datasets raises issues of semantic interoperability and a need for automated methods to assess and manage data quality.30
Finally, the pros and cons of different levels of problem orientation should be an important part of the design and development of requirements analysis for CMR systems.
Conclusion
Medical informatics is playing an increasing important role in the management of diabetes. Ensuring that records have good data quality is imperative for the clinical care of patients. This study has implications of those conducting research and measuring quality using routine data as well as those involved in designing and commissioning information systems.
The implications for researchers and those improving quality is that they need to recognise that how searches are conducted can also have an impact on case ascertainment and measurement of quality; simplistic approaches will very likely result in errors. Measures of the prevalence of diabetes and how well diabetes is controlled will vary depending on the search strategy used; search strategies should be adjusted to take account of the degree of problem orientation of the record.
Health service managers and system designers should specify the use of algorithms that would help flag potential quality gaps not only in terms of possibly incorrect diagnoses, but also in ensuring decision support and prompts for treatment are correctly applied.
Acknowledgments
This study was supported by NHS Diabetes as part of an RCGP–NHS Diabetes quality improvement initiative.