Derivation and validation of QRISK, a new cardiovascular disease risk score for the United Kingdom: prospective open cohort study
BMJ 2007; 335 doi: https://doi.org/10.1136/bmj.39261.471806.55 (Published 19 July 2007) Cite this as: BMJ 2007;335:136
- Julia Hippisley-Cox, professor of clinical epidemiology and general practice1,
- Carol Coupland, senior lecturer in medical statistics1,
- Yana Vinogradova, research fellow in medical statistics1,
- John Robson, senior lecturer in general practice2,
- Margaret May, research fellow in medical statistics3,
- Peter Brindle, research and development strategy lead4
- 1Tower Building, University Park, Nottingham NG2 7RD
- 2Centre for Health Sciences, Queen Mary's School of Medicine and Dentistry, London
- 3Department of Social Medicine, University of Bristol
- 4Avon Primary Care Research Collaborative, Bristol Primary Care Trust
- Correspondence to: J Hippisley-Cox julia.hippisley-cox@nottingham.ac.uk
- Accepted 27 June 2007
Abstract
Objective To derive a new cardiovascular disease risk score (QRISK) for the United Kingdom and to validate its performance against the established Framingham cardiovascular disease algorithm and a newly developed Scottish score (ASSIGN).
Design Prospective open cohort study using routinely collected data from general practice.
Setting UK practices contributing to the QRESEARCH database.
Participants The derivation cohort consisted of 1.28 million patients, aged 35-74 years, registered at 318 practices between 1 January 1995 and 1 April 2007 and who were free of diabetes and existing cardiovascular disease. The validation cohort consisted of 0.61 million patients from 160 practices.
Main outcome measures First recorded diagnosis of cardiovascular disease (incident diagnosis between 1 January 1995 and 1 April 2007): myocardial infarction, coronary heart disease, stroke, and transient ischaemic attacks. Risk factors were age, sex, smoking status, systolic blood pressure, ratio of total serum cholesterol to high density lipoprotein, body mass index, family history of coronary heart disease in first degree relative aged less than 60, area measure of deprivation, and existing treatment with antihypertensive agent.
Results A cardiovascular disease risk algorithm (QRISK) was developed in the derivation cohort. In the validation cohort the observed 10 year risk of a cardiovascular event was 6.60% (95% confidence interval 6.48% to 6.72%) in women and 9.28% (9.14% to 9.43%) in men. Overall the Framingham algorithm over-predicted cardiovascular disease risk at 10 years by 35%, ASSIGN by 36%, and QRISK by 0.4%. Measures of discrimination tended to be higher for QRISK than for the Framingham algorithm and it was better calibrated to the UK population than either the Framingham or ASSIGN models. Using QRISK 8.5% of patients aged 35-74 are at high risk (20% risk or higher over 10 years) compared with 13% when using the Framingham algorithm and 14% when using ASSIGN. Using QRISK 34% of women and 73% of men aged 64-75 would be at high risk compared with 24% and 86% according to the Framingham algorithm. UK estimates for 2005 based on QRISK give 3.2 million patients aged 35-74 at high risk, with the Framingham algorithm predicting 4.7 million and ASSIGN 5.1 million. Overall, 53 668 patients in the validation dataset (9% of the total) would be reclassified from high to low risk or vice versa using QRISK compared with the Framingham algorithm.
Conclusion QRISK performed at least as well as the Framingham model for discrimination and was better calibrated to the UK population than either the Framingham model or ASSIGN. QRISK is likely to provide more appropriate risk estimates to help identify high risk patients on the basis of age, sex, and social deprivation. It is therefore likely to be a more equitable tool to inform management decisions and help ensure treatments are directed towards those most likely to benefit. It includes additional variables which improve risk estimates for patients with a positive family history or those on antihypertensive treatment. However, since the validation was performed in a similar population to the population from which the algorithm was derived, it potentially has a “home advantage.” Further validation in other populations is therefore required.
Introduction
Cardiovascular disease is the leading cause of premature death and a major cause of disability in the United Kingdom.1 Asymptomatic patients thought to be at high risk of cardiovascular disease need to be identified so they can be offered advice about lifestyle changes, such as smoking cessation, physical activity, and diet, about treatment to lower blood pressure and modify cholesterol levels, and about use of aspirin when appropriate.
Many guidelines recommend that the risk of cardiovascular disease is estimated by combining different risk factors into a numeric estimate of risk. A variety of risk calculators are available, as charts, tables, computer programs, and web based tools.2 3 4 Equations derived from the American Framingham cohort study are the most widely used in the United Kingdom.5
Although the Framingham risk equations have been the most used method for many years they have major limitations. The Framingham cohort is almost entirely white and recalibration may be needed in more ethnically diverse populations.6 The Framingham risk equations were developed during the peak incidence of cardiovascular disease in America. They perform well in similar populations but may over-estimate risk by up to 50% in contemporary northern European populations where the incidence of cardiovascular disease is lower.7 The confidence intervals for estimates produced from the Framingham algorithm have been difficult to quantify and any estimate is uncertain for estimation of an individual's risk. The equations may also underestimate risk in some high risk subgroups, such as patients from deprived areas, potentially exacerbating health inequalities.8 9 Lastly, the Framingham algorithm does not include factors such as social deprivation, body mass index, family history of cardiovascular disease, and current treatment with antihypertensives. The evidence supporting the utility of cardiovascular risk scores for primary prevention in the United Kingdom is scarce.10
In a major initiative to improve public health in the United Kingdom the National Institute for Health and Clinical Excellence has lowered the threshold for primary prevention with statins from a 10 year cardiovascular disease risk of 40% to that of 20%.11 12 We refer to a 10 year cardiovascular disease risk of 20% or more as high risk. Any systematic over-estimation of risk results in an excessive number of people being identified for treatment. Not only would this have a major impact on prescribing costs and NHS resources supporting lifelong treatment, it potentially also exposes patients to unnecessary treatments and hence possible side effects. It is important that this new public health programme includes social deprivation to reduce rather than to exacerbate existing social inequalities in cardiovascular disease and to target those at greatest risk.13 In recognition of these problems Scotland has adopted ASSIGN equations that include social deprivation.14
For these reasons the underlying methods of risk prediction should be fit for purpose, targeting those likely to benefit most and avoiding inappropriate treatment of those at lower risk. The equation underpinning the estimate of cardiovascular disease risk needs to be revised and calibrated for the contemporary UK population, with an appropriate weighting for social deprivation and current treatment with antihypertensives. We therefore carried out a study to derive and validate a new cardiovascular disease risk score and compared this with the Framingham5 and the new ASSIGN equations.15
Methods
Our prospective cohort study was carried out within a large UK primary care population. We used version 14 of the QRESEARCH database (www.qresearch.org). This is a large, validated electronic database representative of primary care and containing the health records of 10 million patients over a 17 year period from 529 general practices using the EMIS computer system. It covers about 7% of the current UK population and the contributing practices are similar to over 8000 practices nationally for a wide variety of measures.16 It has been used for a wide range of health service analyses and research studies, including studies of the incidence, risk, and treatment of cardiovascular disease.17 18 19 20 21 The database contains area measures of ethnicity and deprivation evaluated at output area on the basis of the 2001 census and linked to every patient's record. The Townsend score22 is a good area measure of material deprivation based on four variables (unemployment, overcrowding, non-car ownership, and non-home ownership) and has been widely used in medical research. It is available at output area, about 125 households. Most recently QRESEARCH has been linked to cause of death data from the Office for National Statistics enabling sensitivity analyses including certified cause of death. QRESEARCH is sufficiently large to allow modelling on two thirds of the database, with validation using the remaining third.
Practices and cohorts
We included all the contributing practices in the United Kingdom once they had been using their EMIS system for at least a year. We randomly allocated two thirds of eligible practices to the derivation dataset, saving the remaining third for the validation dataset. The derivation dataset was used to derive a new risk equation for estimating cardiovascular risk, validated using the validation dataset.
We identified an open cohort of patients aged 35-74 at the date of study entry, drawn from patients registered with eligible practices from 1 January 1995 to 1 April 2007. We excluded those with a diagnosis of cardiovascular disease or diabetes before their entry date. We also excluded temporary residents and patients with interrupted periods of registration with the practice. We also excluded 4% of patients who did not have a valid postcode related Townsend score.
For each patient we determined an entry date to the cohort analysis, which was the latest of the following dates: 35th birthday, date of registration with the practice, date on which the practice computer system was installed, and the beginning of the study period (1 January 1995). In addition we only included patients in the analysis once they had a minimum of one year's complete data in their medical record.
For each patient we determined the right censor date, which was the earliest date of the dates on which they developed the outcome of interest, the study period ended (1 April 2007), date of death, date of deregistration with the practice, or date of last upload of computerised data. We determined the person years at risk—the difference between the entry date and the right censor date. We used person years at risk as the denominator term for the incidence rates.
Cardiovascular disease outcomes
The primary outcome was the first recorded diagnosis of cardiovascular disease on the general practice's clinical computer system either before or at death occurring between 1 January 1995 and 1 April 2007. Our definition included myocardial infarction, coronary heart disease, stroke, and transient ischaemic attack. We used nationally agreed definitions—that is, computer recorded Read codes—from the General Medical Services contract quality and outcomes framework.
We have used the general practitioner's clinical diagnosis of cardiovascular disease for our main analysis. At the time of writing, however, patient level data for cause of death were available from the Office for National Statistics for the five years between 2002 and 2007. We were able to link these data at patient level within the general practices' clinical computer systems and extract the resulting data onto the QRESEARCH database. We were therefore able to identify patients who had a primary or underlying certified cause of death as either coronary heart disease (codes I20-I25, international classification of diseases, 10th revision), stroke, or transient ischaemic attack and to use these data to examine the completeness of outcome data on QRESEARCH.
Risk factors for cardiovascular disease
We included the following risk factors in our analysis, using the value closest to the entry date to the cohort for each patient and imputing missing values when necessary: age (in single years); sex (men v women); smoking status (current smoker, non-smoker—including former smoker); systolic blood pressure (continuous); ratio of total serum cholesterol to high density lipoprotein levels (continuous); left ventricular hypertrophy recorded in clinical records (yes or no); body mass index (continuous); family history of cardiovascular disease in a first degree relative aged less than 60 (yes or no); Townsend deprivation score (2001 census data at output area level evaluated as a continuous variable); percentage of South Asian residents at output areas (2001 census data evaluated at output areas as a continuous variable); current prescription of at least one antihypertensive—thiazide, β blocker, calcium channel blocker, or angiotensin converting enzyme inhibitor (yes or no).
Model derivation and development
We used the Cox proportional hazards model in the derivation dataset to estimate the coefficients associated with each potential risk factor for the first ever recorded diagnosis of cardiovascular disease for men and women separately. A priori we specified the variables we intended to include in the model on the basis of traditional risk scores (for example, Framingham equation). We compared models using the Bayes information criterion. This is a likelihood measure in which lower values indicate better fit and in which a penalty is paid for increasing the number of variables. We examined the strength of the association between one unit increases in each continuous variable and we compared categories for other variables—for example, current smoking compared with non-smoking. Continuous variables were centred for analysis. We checked the assumptions of the proportional hazards model for each variable and tested for any non-linear relation between continuous independent variables and the outcome. We used fractional polynomials to model non-linear risk relations with continuous variables when appropriate.23 24 Modelling using fractional polynomials is a flexible approach for modelling non-linear risk relations with continuous variables. We tested for interactions between systolic blood pressure and antihypertensive treatment and between smoking and deprivation.
Initially our models were fitted using patients without any missing data (complete case analysis), and the fractional polynomial terms were obtained from the complete case analysis using a multivariable approach. However, because patients with complete data might have a different health status and risk of cardiovascular disease compared with those with missing data, we fitted our principal models on the basis of multiple imputed datasets using Rubin's rules to combine effect estimates and estimate standard errors.24 25 We used the ICE procedure in Stata26 to obtain five imputed datasets.
We took the log of the hazard ratio for each of the risk factors (that is, the coefficients from the Cox regression) from the final model and used these as weights for the new cardiovascular disease risk equation. We then estimated each patient's probability of experiencing a cardiovascular event within 10 years by combining these weights with the characteristics of the patient and also using the baseline survivor function for all participants, as in other studies.15 27 The baseline survivor function was estimated from the Cox regression model centred on the means of continuous risk factors and we extracted the value for 10 years' follow-up.
Validation of the new cardiovascular disease risk equation
Having obtained the risk equation in the derivation dataset (the QRISK score) we tested its performance (calibration and discrimination) in the validation dataset. We calculated the 10 year estimated cardiovascular disease risk for each patient in the validation dataset, replacing missing values for continuous variables with mean values obtained from the derivation dataset by five year age-sex bands and assuming patients were non-smokers when smoking status was not recorded.
To assess calibration (the degree of similarity between observed and predicted risks) we calculated the mean predicted risk of cardiovascular disease at 10 years and the observed risk at 10 years obtained using the 10 year Kaplan-Meier estimate. We then compared the ratio of the predicted to the observed cardiovascular disease risk for patients in the validation cohort in each tenth of predicted risk. We also compared predicted and observed risks overall for men and women by age band and by fifth of Townsend score. We calculated the area under the receiver operating curve to assess discrimination—that is, the ability of a risk prediction equation to distinguish between those who do and those who do not have a cardiovascular event during the follow-up period. We also calculated the D statistic28 and an R2 statistic,29 which are measures of discrimination and explained variation for survival models.
Comparison with the Framingham and ASSIGN equations
We compared the performance of QRISK against the risk estimates derived from Framingham equations.5 We used an equation for cardiovascular disease risk that was computed by summing the coronary risk (including myocardial infarction and coronary heart disease death plus angina plus coronary insufficiency) and stroke risk (including transient ischaemic attack) as these outcomes are closest to those used in randomised trials of drug effectiveness. They are also the outcomes used to define cardiovascular disease in the current Joint British Society Guidelines.30
We calculated the area under the receiver operating curve and the D statistic for the Framingham estimates in the validation dataset and compared them with the corresponding QRISK values. We also compared the performance of QRISK against the ASSIGN equation.15 ASSIGN contains similar variables to QRISK except it uses the number of cigarettes smoked per day instead of a categorical variable for smoking and the index of multiple deprivation as the measure of deprivation.
Finally, we calculated the proportion of patients in the validation sample who have a 20% or more risk of cardiovascular disease at 10 years, by age, sex, and deprivation according to QRISK and the Framingham and ASSIGN equations. We determined the proportion of patients who would be reclassified into a higher or lower risk category using the new risk equations. We estimated the number of people in the United Kingdom with a 10 year cardiovascular disease risk of 20% or more for each score, using UK population estimates for 2005. Stata (version 9.2) was used for all analyses.
Results
Overall, 478 UK practices met our inclusion criteria of which 318 were randomly assigned to the derivation dataset and 160 to the validation dataset.
In the derivation cohort 3 374 617 patients of all ages were registered with 318 practices at some point during the study period. Of these, 1 283 174 were aged 35-74 years and were free of cardiovascular disease and diabetes at baseline. These patients were included in the study. Of these, 50.4% were women. During the study period 65 671 incident cases of cardiovascular disease from 8.2 million person years of observation occurred giving a crude incidence rate for cardiovascular disease of 7.96 per 1000 person years. Incidence rates were higher in men than in women and increased steeply with age (table 1⇓). The computer recorded incidence of cardiovascular disease was also significantly higher among men and women from deprived areas, the effect being more noticeable for women. The median follow-up was 6.5 years (range 0-12 years) and 306 259 patients were followed-up for at least 10 years. The 10 year observed risk of a cardiovascular event in women aged 35-74 was 6.69% (95% confidence interval 6.61% to 6.78%) and in men was 9.46% (9.36% to 9.56%).
Computer recorded incidence of cardiovascular disease per 1000 person years with 95% confidence intervals in derivation and validation cohorts by age, sex, and deprivation fifth
In the validation dataset 614 553 eligible patients were aged 35-74 and of these 50.3% were women. Incidence rates among patients in the validation cohort were similar to those in the derivation cohort (table 1⇑). The 10 year observed risk of a cardiovascular event in women aged 35-74 was 6.60% (6.48% to 6.72%) and in men was 9.28% (9.14% to 9.43%).
Table 2⇓ compares the characteristics of eligible patients in the cohorts. Although the validation cohort was drawn from an independent group of practices, the baseline characteristics were similar to those for the derivation cohort.
Baseline clinical characteristics for men and women aged 35-74 initially free from cardiovascular disease and diabetes in derivation and validation datasets. Values are means (standard deviations) unless stated otherwise
Outcome comparison with data from the Office for National Statistics
A subgroup analysis was undertaken in the period 2002-7 for practices with linked data on death to determine the degree of under-ascertainment of deaths from cardiovascular disease on the general practice's clinical computer record—that is, patients with a cardiovascular disease death recorded on Office for National Statistics data who had not been identified through the general practice's clinical record. Of the 39 507 patients with a cardiovascular disease outcome on either record between 2002 and 2007, 37 074 (93.8%) had already been identified on the basis of their general practice record alone—that is, an additional 6.2% of patients were identified by virtue of their Office for National Statistics cause of death linked record.
Baseline characteristics of derivation cohort
At baseline 8.4% of men and 12.4% of women were receiving treatment for blood pressure. A family history of premature coronary heart disease in a first degree relative aged less than 60 was recorded in 9.1% of men and 12.1% of women and 0.4% had a recorded diagnosis of left ventricular hypertrophy.
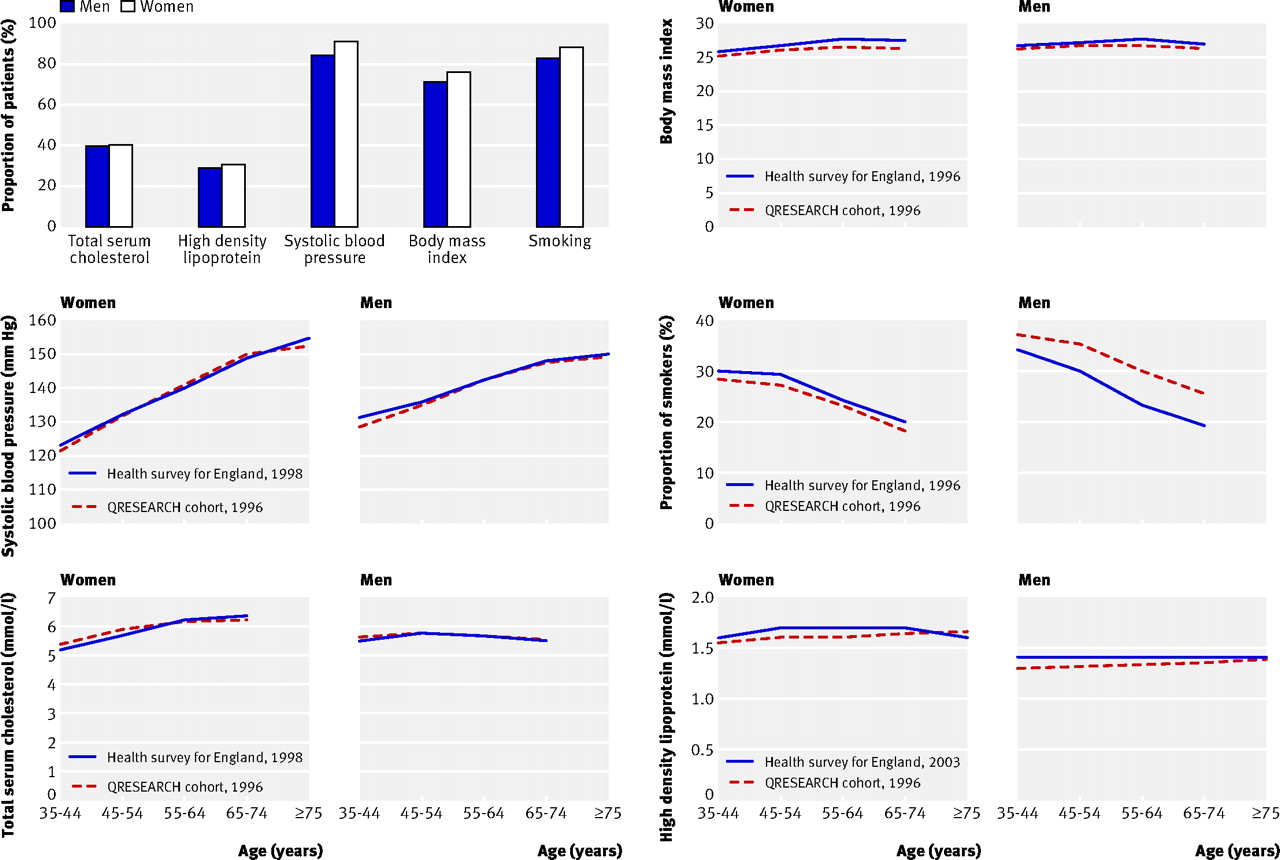
The figure⇓ shows the percentage of patients with recorded values. It also shows mean values for body mass index, systolic blood pressure, total serum cholesterol and high density lipoprotein, and the proportion of smokers at baseline compared with data from the health survey for England for the year closest to 1996 that included measurement of the risk factor. Values by age for most variables were similar to those in the health survey suggesting that the study cohort is representative of the general population. The exception was smoking where the survey rates were slightly higher than the study rates for women but lower than the study rates for men.

Comparison of mean values for variables by age and sex in the derivation cohort compared with health survey for England (year nearest to 1996 with risk factor measured). Mean high density lipoprotein levels from health survey were not available until 2003
We compared characteristics of patients with and without recorded values. Women with missing data on smoking status were less likely to be taking blood pressure treatment or to have a family history of premature coronary heart disease. Women with missing values for body mass index were less likely to be receiving treatment for blood pressure, less likely to smoke, and less likely to have a family history of premature coronary heart disease. Women with missing blood pressure measurements were less likely to be receiving treatment for blood pressure, less likely to smoke, less likely to have a family history of premature coronary heart disease, and were slightly younger. Women with missing data on the ratio of total serum cholesterol to high density lipoprotein were less likely to be receiving treatment for blood pressure or to have a family history of premature coronary heart disease, were more likely to be smokers, were younger, had lower systolic blood pressure, and had a slightly lower body mass index. A similar pattern was observed for men. In general patients with missing data had significantly different survival rates—for example, women with a cholesterol ratio recorded had a 10 year observed risk of a cardiovascular event of 4.0% compared with 7.9% for those with missing values. For men the values were 4.9% and 10.9%.
Model derivation
Table 3⇓ shows the results of the Cox regression analysis for the final model. A log transformation was used for age but otherwise variables were fitted as linear terms as this best fitted the data according to the fractional polynomial analysis. Three main models were compared for fit and interpretability. The final model included the logarithm of age, ratio of serum cholesterol to high density lipoprotein levels, systolic blood pressure, body mass index, family history of premature cardiovascular disease, smoking status, Townsend deprivation score, and use of at least one blood pressure treatment. The final model also included an interaction term between systolic blood pressure and blood pressure treatment. Left ventricular hypertrophy was omitted from the final model as the prevalence of recording was low and its inclusion made little difference to the overall model. The area measure of ethnicity was also omitted from the final model since it did not improve the model fit over and above the inclusion of the area measure of deprivation and interpretation of the results was difficult. Overall the final model was superior to the other models according to the Bayes information criterion statistic.
Adjusted hazard ratios with 95% confidence intervals for preferred QRISK model for men and women aged 35-74
Hazard ratios for the final model show that the risk of a cardiovascular disease event increased with increasing age, body mass index, and Townsend deprivation score. The risk was higher in patients who smoked, had a family history of premature cardiovascular disease, and were receiving blood pressure treatment at baseline. Risk increased more steeply with systolic blood pressure in those not receiving treatment for blood pressure. The hazard ratio associated with the ratio for total serum cholesterol to high density lipoprotein level was just above and close to one for both sexes. However, we decided a priori to include this risk factor in the model. The model was repeated omitting the cholesterol ratio term and a small change was found to the coefficients for some of the other variables.
Calibration and discrimination of QRISK v Framingham v ASSIGN
Table 4⇓ compares predicted and observed risks of a cardiovascular disease event at 10 years across each tenth of risk (the first tenth representing the lowest risk) for the Framingham, ASSIGN, and QRISK equations. Overall, the Framingham equation over-predicted risk at 10 years by 35%, ASSIGN by 36%, and QRISK by 0.4%. All three equations tended to over predict risk in the lowest three tenths for men and women. The most noticeable over-prediction occurred with ASSIGN, followed by the Framingham equation and then QRISK. The Framingham equation, however, consistently over-predicted risk in men across every tenth, with a 51% over-prediction in the top tenth compared with 36% for ASSIGN and 8% for QRISK
Ratio of predicted to observed risks of cardiovascular disease event at 10 years across tenths of estimated risks
Table 5⇓ shows the validation statistics for QRISK compared with the Framingham and ASSIGN equations. The receiver operating curve statistic indicates that the final QRISK score has at least as good as, if not slightly better, discrimination than the Framingham and ASSIGN equations.
Summary statistics comparing QRISK equation for 10 year risk of cardiovascular disease to predictions based on Framingham and ASSIGN equations applied to validation cohort in patients aged 35-74
The R2 statistic (standard error) for QRISK in women was 36.4% (0.43%), which is higher than the corresponding value for the Framingham equation which was 31.7% (0.44%). Similarly, the R2 statistic for the model for men was higher for QRISK than for the Framingham equation. The D statistic for QRISK was 1.45 for men and 1.55 for women, both higher than the corresponding values for the Framingham equations which were 1.31 and 1.39 respectively, indicating better discrimination for QRISK.
Predictions with age, sex, and social deprivation
Table 6⇓ shows the proportion of patients with a cardiovascular disease risk score of ≥20% (high risk) by Townsend fifths and sex according to each of the three risk prediction scores.
Numbers (percentages) of patients with a cardiovascular disease risk score ≥20% by sex and Townsend fifth in patients aged 35-74, estimated using three risk scores
The most noticeable differences were observed for women. QRISK predicts 9.9% of women aged 35-74 from the most deprived fifth to be at high risk compared with 3.0% of women from the most affluent fifth. The corresponding values for the Framingham equation are 6.3% (most deprived) and 4.6% (most affluent).
QRISK predicts 12.6% of men from the most deprived areas to be at high risk compared with 9.6% of those from the most affluent areas. The corresponding values for the Framingham equation were 19.5% (most deprived) compared with 20.5% (most affluent).
Overall QRISK predicted 8.5% of patients aged 35-74 to be at high risk compared with 12.8% for the Framingham equation and 14.0% for ASSIGN (table 7⇓). Using QRISK 34.5% of women and 72.9% of men aged 64-75 would be at high risk compared with 24.1% and 86.0% using the Framingham equation. Estimates based on QRISK give 3.2 million patients aged 35-74 at high risk in the United Kingdom for 2005, with the Framingham equation predicting 4.7 million and ASSIGN 5.1 million.
Numbers (percentages) of patients by age and sex with cardiovascular disease risk ≥20% in validation cohort and estimated numbers in UK population in 2005 according to QRISK and Framingham scores
Overall, 53 668 patients in the validation dataset (9% of total) would be reclassified from high to low risk or vice versa using QRISK compared with using the Framingham equation. Of these, 13 494 patients were classified as low risk using the Framingham equation but high risk using QRISK, and their observed 10 year risk was 22.32% (95% confidence interval 21.36% to 23.32%). Conversely, of those 40 174 at high risk using the Framingham equation but at low risk using QRISK, the observed 10 year risk was 16.45% (15.98% to 16.93%).
Discussion
We derived and validated a new cardiovascular disease risk equation (QRISK) in the United Kingdom in readiness for a major change in national policy on the identification of patients at high risk of cardiovascular disease. It is the largest such study to have ever been undertaken and the first time that routine data in a UK general practice population have been used rather than an observational study in a predefined cohort. The study was validated on an independent sample of practices (although data capture methods are uniform in the derivation and validation sample) and performs as well if not better than the Framingham algorithm in the UK population. However, since the validation was carried out in a similar population to the population from which the algorithm was derived, it potentially has a “home advantage.” Further validation in other populations is therefore required.
QRISK includes standard as well as additional risk factors for cardiovascular disease, such as deprivation, family history of premature coronary heart disease, body mass index, and the effect of existing antihypertensive treatment. Inclusion of antihypertensive treatment at baseline is of relevance to 1 in 10 of the population and failure to take this into account would lead to a significant underestimation of cardiovascular disease risk in the population. The positive associations with antihypertensive treatment and cardiovascular disease risk were expected as these patients might have several factors as well as blood pressure associated with increased risk. Also these patients might have subclinical disease.
Unlike the existing Framingham equations and the European SCORE equation,31 QRISK identifies and includes deprivation in the estimation of cardiovascular disease risk. This will be an important step in supporting national initiatives to reduce health inequalities in cardiovascular disease32 and is likely to be an improvement on the Framingham algorithm, which tends to over-estimate risk in affluent areas and underestimate risk in deprived areas.8 Also, a weighting for social deprivation might help to minimise health inequalities, which may increase when new interventions are introduced because of the inverse equity hypothesis.33 The inclusion of a family history of premature coronary heart disease is important because observational studies indicate that such disease in a first degree relative increases risk by 50% or more,34 35 although our estimates were lower. Further work is needed to identify the utility of using self reported ethnicity rather than an area based measure, because the inclusion of area measures of ethnicity in QRISK did not improve the utility of the score possibly as a result of the correlation with the area based measure of deprivation. QRISK tackles components not included in SCORE, which was designed for European use. SCORE does not include cardiovascular disease morbidity, which is an integral part of both trial data (non-fatal myocardial infarction and stroke) and cost effectiveness reviews. The health technology assessment of statins in the United Kingdom has identified a cardiovascular disease event of 20% in 10 years as the threshold for treatment, of which most are non-fatal events.36
Although QRISK includes more variables than the Framingham algorithm and therefore seems more complex, QRISK has been derived from routinely collected clinical data from general practice. Not only is QRISK likely to have a face validity in the setting where it is likely to be applied, but software can be developed within the general practice clinical system to automatically calculate scores. Therefore this could be implemented simply in clinical practice to flag high risk patients for further assessment. Furthermore, the case for inclusion of antihypertensive treatment has already been made with respect to Framingham equations for risk prediction of stroke, a component of this new equation.37
This study is based on a large, representative and contemporary UK population with data obtained from a validated research database. We used an open cohort study design, which allowed patients to enter the study population throughout the study period. This was done so that patients who had more recent data could be included in the estimation of the model coefficients. The disadvantage of this approach is that not all our patients had the opportunity to contribute 10 years worth of follow-up data although we did have over 300 000 patients with at least 10 years of follow-up data. The median follow-up time was therefore relatively short compared with the long established Framingham cohort and the more recent cohort used for ASSIGN. This could introduce some imprecision in the estimate of survival at 10 years. To assess this we restricted the analysis to the closed cohort and found minimal difference in the baseline survivor function. As incidence of cardiovascular disease is changing over time it is important to update this algorithm periodically as planned. The cohort is socially, ethnically, and geographically diverse and over 250 times the size of the original Framingham cohorts from 30-50 years ago. It includes both men and women.
The utility of any tool for risk prediction depends on the quality of the data used to derive it; both risk factors and outcome measure. Although levels of completeness for some risk factors were good (notably body mass index, smoking, and blood pressure), recording levels were low for serum cholesterol. This is a likely source of bias and may have contributed to the attenuation of the hazard ratio of the cholesterol ratio term towards one. However, comparison with the mean values for systolic blood pressure, cholesterol, and body mass index from the health survey for England shows that this population is likely to be representative of the population in England. This means our results should be generalisable. The exception was smoking where the survey rates were higher than the study rates for women but lower than the study rates for men. This could reflect a differential bias in self reported smoking status either within the survey, within the patients' electronic health record, or within both. A strength of our study, however, is the use of multiple imputation of missing values, a technique that is designed to increase the power of the analysis and produce models that are more statistically reliable and applicable within clinical practice.24 25 The pattern of missing values, including differences in survival for patients with and without missing data, supported the use of this approach as compared with a complete case analysis. We used a single baseline measure for systolic blood pressure, which might lead to underestimation of its association with cardiovascular disease risk owing to large variation within individuals. Also we included a relatively crude measure of blood pressure treatment rather than undertaking a more complex time varying approach.
The outcome measures in our study were not formally adjudicated—that is, some patients with a diagnosis of cardiovascular disease may have been misdiagnosed. Validation studies of similar general practice databases show that false positive diagnoses occur in fewer than 10% of cases.38 Similarly, the information for some patients with cardiovascular disease may not be recorded on the clinical records. Such misclassification of outcomes, if present and if non-differential for risk factors, will result in hazard ratios tending towards one, which would reduce the discriminatory power of a risk score. Our subgroup analysis between 2002 and 2007, however, showed a 94% ascertainment rate for cardiovascular disease outcomes based on the general practice clinical record alone compared with outcomes including death certification data.
Under-ascertainment is more likely to affect patients from the most deprived areas and so it is possible that our algorithm will underestimate risk in these patients. This underlines the need to include measures of deprivation in both the development and the application of risk prediction scores as well as the need for more and better data linkage across the health service. It is worth noting that this is the first time that cause of death data from the Office for National Statistics have been linked to general practice data across 60% of the United Kingdom. Only a five year subset of data were ready in time for this analysis, data back to 1993 will be used to update algorithms for coronary heart disease and stroke.
Lastly, although we have validated QRISK on a separate sample of one third of practices from QRESEARCH (that is, a different population from the population used to develop the algorithm), it could be argued that this is not an entirely independent population because all the practices were using the EMIS clinical system. This potentially gives a “home advantage” to QRISK as prediction algorithms tend to perform better in populations similar to the ones in which they were derived. A second validation is therefore underway using a different general practice database (THIN) derived from practices using a different clinical computer system. This analysis, which will be a more severe test of the performance of QRISK, will be reported separately when complete.
Comparison with Framingham and ASSIGN algorithms
The Framingham cohort is an invaluable resource for epidemiology and aetiology owing to the completeness of data. The weakness is that it was based on exceptionally high rates of cardiovascular disease at the height of an epidemic but is now used as a tool to describe risks in contemporary European populations for the purpose of drug treatment. It has repeatedly been shown to be seriously inaccurate. QRISK explains a higher percentage of the variation than either the Framingham or ASSIGN algorithms in both men and women. Discrimination (the ability to differentiate between high and low risk patients) with QRISK was better than with the Framingham equation. Improved discrimination using QRISK results in a steeper gradient of cardiovascular disease risk for social deprivation compared with estimates using the Framingham equation. QRISK tends to increase cardiovascular disease risk estimates in people living in deprived areas relative to those in more affluent areas. This effect is most noticeable for women from deprived areas. Inclusion of area based deprivation measures within the QRISK prediction algorithm is likely to predict more accurately which patients are at high or low risk and so target interventions more appropriately on the basis of likely clinical need.
Our analysis shows that neither the Framingham nor ASSIGN equations is well calibrated for this UK population, with both scores tending to over-predict risk. If the patient's absolute risk is lower than predicted, the absolute benefits of an intervention will be smaller and the balance of risks and benefits will be less favourable. Additionally, overestimation of risk prediction will adversely affect direct prescribing costs as well as the costs associated with monitoring for, and managing, side effects. The degree of over-prediction for the Framingham algorithm is consistent with that reported in other validation studies of the Framingham equation in the United Kingdom.39 We think that the over-prediction is probably the result of a combination of differences in risk factor means and prevalences and baseline survival function. In ASSIGN, for example, 41.5% of patients smoked compared with 26% of the study population; 26% of patients in the ASSIGN cohort had a family history of premature coronary heart disease in a first degree relative compared with 11% recorded in the study population. The mean serum cholesterol level in the ASSIGN cohort was 6.23 mmol/l compared with 5.8 mmol/l in our population. ASSIGN is calibrated to the incidence of cardiovascular disease in Scotland, which is higher than that in England. Although much less noticeable, some over-prediction occurred in the top tenth using QRISK, which might reflect an effect of increasing age when the effect of risk factors diminish and survivors are more resilient. Alternatively it could be due to competing risks of death, such as cancer, which become more important at higher ages.
Conclusion
We have derived and validated a new cardiovascular disease risk prediction score that is better calibrated for the UK population and has better discrimination. Overall in patients aged 35-74, the Framingham algorithm over-predicted cardiovascular disease risk at 10 years by 35%, ASSIGN by 36%, and QRISK by 0.4%. QRISK predicted 9% of patients aged 35-74 to be at high risk compared with 13% for the Framingham equation and 14% for ASSIGN. Using QRISK we estimate that 34% of women and 73% of men aged 64-75 would be at high risk compared with 24% and 86% according to the Framingham equation. UK estimates on the basis of QRISK give 3.2 million patients at high risk in 2005, compared with 4.71 million for the Framingham equation and 5.1 million for ASSIGN. Overall, QRISK would reclassify about 1 in 10 patients from high to low risk or vice versa compared with the Framingham algorithm.
We think that QRISK is likely to provide more appropriate estimates of cardiovascular disease risk in contemporary UK populations and better discriminate those at high risk on the basis of their age, sex, and social deprivation as well as existing antihypertensive treatment. It is likely therefore to be a more equitable tool to inform patient management decisions.
What is already known on this topic
Current cardiovascular risk prediction algorithms based on the Framingham model tend to over-predict risk and are not well calibrated for the UK population
The Framingham model does not include measures of deprivation, family history, body mass index, or current treatment with antihypertensives
What this study adds
A new risk score, QRISK, performed at least as well as the Framingham model for discrimination and was better calibrated to the UK population than either the Framingham model or ASSIGN
QRISK would identify a different high risk group of patients than the Framingham equation, with one in ten patients being reclassified into high or low risk
QRISK includes additional variables that allow better tailoring of management to the individual patient and will help to minimise health inequalities
Footnotes
We thank EMIS and the EMIS practices contributing to QRESEARCH; Patrick Royston for advice on multiple imputation, fractional polynomials, and the D statistic; Rod Jackson, Stuart Pocock, Philip Bath, Hugh Tunstall-Pedoe, and Mark Woodward for reviewing the protocol; and the following who enabled the project, contributed to discussions, or facilitated the linkage of cause of deaths data with general practice data—Nirupa Dattani and Sir Peter Goldblatt (Office for National Statistics), Steve Daniels (Connecting for Health), John Fox and Dave Roberts (Information Centre), Andy Whitwam and David Stables (EMIS), Bill Kirkup, Maggie Rae, Michael Soljak, and Roger Boyle (Department of Health).
Contributors: JHC initiated and designed the study, obtained approvals, prepared the data, undertook the analysis and interpretation, and wrote the first draft of the paper. CC, YV, and MM contributed to the development of the protocol, design, analysis and interpretation, and drafting of the paper. CC and YV undertook some of the primary analyses with JHC. JR and PB contributed to the conception, design, analysis, interpretation, and drafting of the article and approved the final version.
Funding: The study received no external funding.
Competing interests: JR chairs, and PB is a member of, the NICE guideline development group on cardiovascular risk assessment “The modification of blood lipids for the primary and secondary prevention of cardiovascular disease.” JHC is codirector of QRESEARCH, a not for profit organisation that is a joint partnership between the University of Nottingham and EMIS (leading supplier of information technology for 60% of UK general practices). QRESEARCH undertakes analyses for the Department of Health and other government organisations. All research using the database is peer reviewed and published. QRESEARCH is not used for studies for the pharmaceutical industry.
Ethical approval: This study was approved by the Trent multicentre research ethics committee.