Article Text

Abstract
Background The UK's Quality and Outcomes Framework (QOF) was introduced in 2004/5, linking remuneration for general practices to recorded quality of care for chronic conditions, including diabetes mellitus. We assessed the effect of the incentives on recorded quality of care for diabetes patients and its variation by patient and practice characteristics.
Methods Using the General Practice Research Database we selected a stratified sample of 148 English general practices in England, contributing data from 2000/1 to 2006/7, and obtained a random sample of 653 500 patients in which 23 920 diabetes patients identified. We quantified annually recorded quality of care at the patient-level, as measured by the 17 QOF diabetes indicators, in a composite score and analysed it longitudinally using an Interrupted Time Series design.
Results Recorded quality of care improved for all subgroups in the pre-incentive period. In the first year of the incentives, composite quality improved over-and-above this pre-incentive trend by 14.2% (13.7–14.6%). By the third year the improvement above trend was smaller, but still statistically significant, at 7.3% (6.7–8.0%). After 3 years of the incentives, recorded levels of care varied significantly for patient gender, age, years of previous care, number of co-morbid conditions and practice diabetes prevalence.
Conclusions The introduction of financial incentives was associated with improvements in the recorded quality of diabetes care in the first year. These improvements included some measures of disease control, but most captured only documentation of recommended aspects of clinical assessment, not patient management or outcomes of care. Improvements in subsequent years were more modest. Variation in care between population groups diminished under the incentives, but remained substantial in some cases.
Statistics from Altmetric.com
Introduction
In the last 15 years the National Health Service in the UK has undergone a series of reforms aimed at improving the quality of care for people with chronic conditions. These include the creation of the National Institute for Health and Clinical Excellence, and the introduction of National Service Frameworks which set minimum standards for the delivery of health services in specified clinical areas, including diabetes mellitus.1 The quality of primary care generally, and of diabetes care in particular, improved in the early 2000s,2 partly in response to these quality improvement initiatives.3 In 2004 new contractual arrangements for family doctors allowed them to opt out of out-of-hours care and linked financial incentives to quality of care under the Quality and Outcomes Framework (QOF),4 the largest and most ambitious pay-for-performance scheme ever attempted in health care.5 ,6
The QOF initially included 76 clinical indicators, covering a range of processes of care (eg, measurement of blood pressure) and intermediate outcomes (eg, glycaemic control). A further 70 indicators covered aspects of practice organisation and patient experience of care. Eighteen of the clinical indicators related to care for patients with diabetes, reflecting in part the national importance of the disease, the recorded prevalence of which had increased by 75% in the previous decade.7 By achieving all the diabetes targets, an average practice could earn over £7500 in the first year of the scheme and £12 500 in subsequent years, when incentives were increased.8
To date, most studies on the effect of the QOF on diabetes care have been conducted with aggregate data at the practice level. These studies suggest that the quality of diabetic care increased over and above the underlying trend in the first 3 years of the QOF scheme,9 leading to modest reductions in emergency hospital admissions,10 but this effect was not sustained.11 ,12 However, Calvert et al, using patient level data, concluded that the introduction of the QOF scheme had little impact, although practices from which data were drawn were not necessarily nationally representative and the analyses did not control for potential confounders including age and co-morbidity.13 Millett et al14 investigated the effect of the QOF on three of the 18 incentivised activities—control of blood pressure, cholesterol and HbA1c levels. They concluded that improvements in care in the first year of the scheme were greater for patients with multiple medical conditions and that improvements were similar for patients from affluent and deprived areas.15
We use data for individual patients registered with a nationally representative sample of practices to investigate quality and outcomes of diabetes care from 2000/1 to 2006/7. Our approach aimed to: (a) establish the effect of the introduction of the QOF on all incentivised aspects of diabetes care at the patient level, (b) assess whether there was variation in the impact depending on patient and practice characteristics, and (c) identify inequalities of care before and after the intervention.
Methods
Patients and practices
Patient-level data were extracted from the General Practice Research Database (GPRD), which contains complete electronic medical records of patients attending primary care practices in the UK. Practitioners used Read codes, a hierarchical coding rule set, to enter data on their clinical computing systems. In October 2010, data were available for 593 practices and over 10 million patients.
We selected a structured sample of 148 practices. Selected practices were nationally representative in terms of patient sex and age distribution and area socioeconomic deprivation, but had a relatively high average list size, reflecting a bias towards larger practices in the GPRD. All patients—registered with a selected practice for at least 1 day during the study period—were selected from practices with list sizes of 4500 or below. For larger practices, a random selection of 4500 patients was drawn from each practice. By including a larger percentage of patients from smaller practices we were able better control for the nested structure of the data in the analyses. We do not expect bias to have been introduced since practice list size seems to have no effect in quality of diabetes management under the QOF.16 The final sample consisted of 653 500 patients. The characteristics of the sampled practices have been described elsewhere.17
Study period
We divided the study period into financial years (1 April to 31 March the following year), to correspond to the timings of QOF years. Following QOF inclusion criteria, we selected for each year patients aged 17 or over that had been registered with their practice for the whole of that year. This created three pre- (2000/1, 2001/2 and 2002/3) and three post-implementation time points (2004/5, 2005/6 and 2006/7). We treated the financial year 2003/4 as a transition year, because information on the forthcoming pay-for-performance framework was made publicly available, although practices were not yet financially incentivised. We provide a summary of the main characteristics of the scheme and its remuneration policy in the online supplementary appendix; a more detailed description has been provided elsewhere.18
Diabetes and co-morbidities
Patients with either type 1 or type 2 diabetes mellitus were identified using the relevant diagnostic codes. We did not limit ourselves to the standard QOF business rules on Read codes for identifying patients with diabetes, since prevalence estimates based only on these codes may underestimate the true prevalence due to changes in coding behaviour following the introduction of the scheme and subsequent changes to QOF business rules.19 We therefore identified additional diagnostic codes linked to diabetes, including codes in the older Oxford Medical Information System coding scheme. As many diagnostic codes do not differentiate between type 1 and type 2 diabetes mellitus, we did not differentiate between types in the study. The same procedure was used to identify nine co-morbid conditions: asthma, coronary heart disease (including angina), chronic kidney disease, chronic obstructive pulmonary disease, depression, heart failure, hypertension, hypothyroidism and stroke. We selected conditions for which quality of reporting was verified using prevalence trends reported in previous studies.17 We also extracted information on patient age, gender and date of diabetes diagnosis. Deprivation was measured at the practice level using the Index of Multiple Deprivation (IMD) score at the super-output area level, a low level geographical area categorisation with unchanged boundaries over time and a relatively small and consistent population size across areas (around 1500).20 Codes used to create condition registers are available from the authors upon request.
Quality of care
Quality of care was measured by achievement of the 17 diabetes quality indicators from the QOF (table 1). For each patient in each year, an indicator was deemed to be achieved if a relevant process event or outcome was identified in the required time period (usually 15 months prior to the end of the financial year—see table 1) and a diagnosis of diabetes pre-dated the event.
Sample characteristics and indicator performance scores across time
A composite quality of care score was calculated for each patient and time point as the number of indicators achieved for that patient as a percentage of the number that applied to that patient:

where QSjy the composite recorded quality score for patient j in year y; DMaijy a binary variable quantifying whether indicator i was applicable to patient j in year y (DMaijy = 1) or not (DMaijy = 0); DMmijy a binary variable quantifying whether indicator i was applicable and met for patient j in year y, in which case DMmijy = 1. In all other cases, that is, applicable but unmet or not applicable, DMmijy = 0.
The scores had a Cronbach's α coefficient of 0.82, above the threshold for acceptable reliability of 0.7, and represent the degree to which each patient was recorded to have received the ‘necessary care’ for their diabetes, as stipulated by the QOF indicator set.
Statistical analyses
We modelled the changes over time in the patient-level composite recorded QOF care score using Interrupted Time Series (ITS) methods, to estimate the changes in level and trend associated with the intervention.21 This quasi-experimental design uses the pre-intervention trend of the data to estimate its projection in the first post-intervention year and compare it with the observed data. The approach is similar for following years but the post-intervention slope also needs to be taken into account.
Therefore, our model estimated three key components of the trend across time: (i) the slope in patient scores in the pre-QOF years (2000/1–2002/3); (ii) the change in level in scores in the first year of the intervention (2004/5); (iii) the change in slope in scores from the pre-QOF to the QOF period (2000/1–2002/3 to 2004/5–2006/7). We then used these components in post-estimation tests to examine the impact of pay-for-performance on overall recorded QOF patient care at two points: (i) 2004/5 (‘short-term’ impact) and (ii) 2006/7 (‘long-term’ impact).
We conducted three main analyses. Analysis 1 examined the overall impact of pay-for-performance in the study population, regardless of any changes in the patient population over time. Analysis 2 controlled for a range of patient and practice characteristics, and examined whether the impact of the intervention varied in relation to these. In analysis 2 interaction terms were added into the model between the three ITS components and a series of covariates: age, gender, time since diagnosis (in years), number of co-morbid conditions, practice diabetes prevalence and area socioeconomic deprivation (measured by the IMD at the practice post-code). By introducing covariates at the patient level this analysis also controlled for changes in the practice samples over time. Model complexity necessitated examination of each covariate in a separate regression. Analysis 3 compared mean recorded QOF scores across the levels of each covariate in the pre-QOF (2000/1–2002/3) and post-QOF (2004/5–2006/7) periods. To aid interpretability of results, continuous covariates (eg, age) were recorded as categorical variables (table 2). To identify overall differences across covariate categories we performed omnibus significance tests.
Composite performance scores, intervention effects and differences in mean levels of care (overall and by patient and practice characteristics)
Floor and ceiling effects (scores at, or approaching, 0% and 100%) can bias results based on linear models. We therefore applied a logit transformation to the data prior to analysis.9 ,11 Instances where the composite score was at 100% or 0% were dealt by applying the empirical logit.22 The non-loglinear component of the pre-QOF trend was found to be non-significant (p>0.05), indicating a good fit to the logit model. Residual autocorrelation was found to be negligible (Pearson's correlation coefficient between the residuals and their lagged values, across patients and over all available time points, was 0.03). Results from the logit-transformed analyses were back-transformed to percentages for ease of interpretation, but we additionally conducted a sensitivity analysis using the untransformed scores.
The data had a complex multi-level structure. Patients were nested within practices, with each practice sample partially changing year-by-year (as some patients left or joined). We modelled patients across time using the Stata xtmixed procedure and allowed for random intercepts at the patient and practice levels. Stata V.11.1 and an α level of 5% were used throughout.
Results
A total of 23 920 diabetic patients who met our inclusion criteria were identified and 23 780 were included in the regression analyses. The recorded prevalence of diabetes in the study practices increased from 3.3% to 5.0% between 2000/1 and 2006/7. The recorded incidence rate of new cases increased from 0.38% to 0.49% between 2000/1 and 2002/3, and remained relatively stable thereafter. The mean age of diabetic patients increased from 62.9 to 63.7 over the study period, and the mean number of co-morbid conditions increased from 1.4 to 1.7, from a maximum of nine monitored conditions (table 1).
Quality of diabetes care
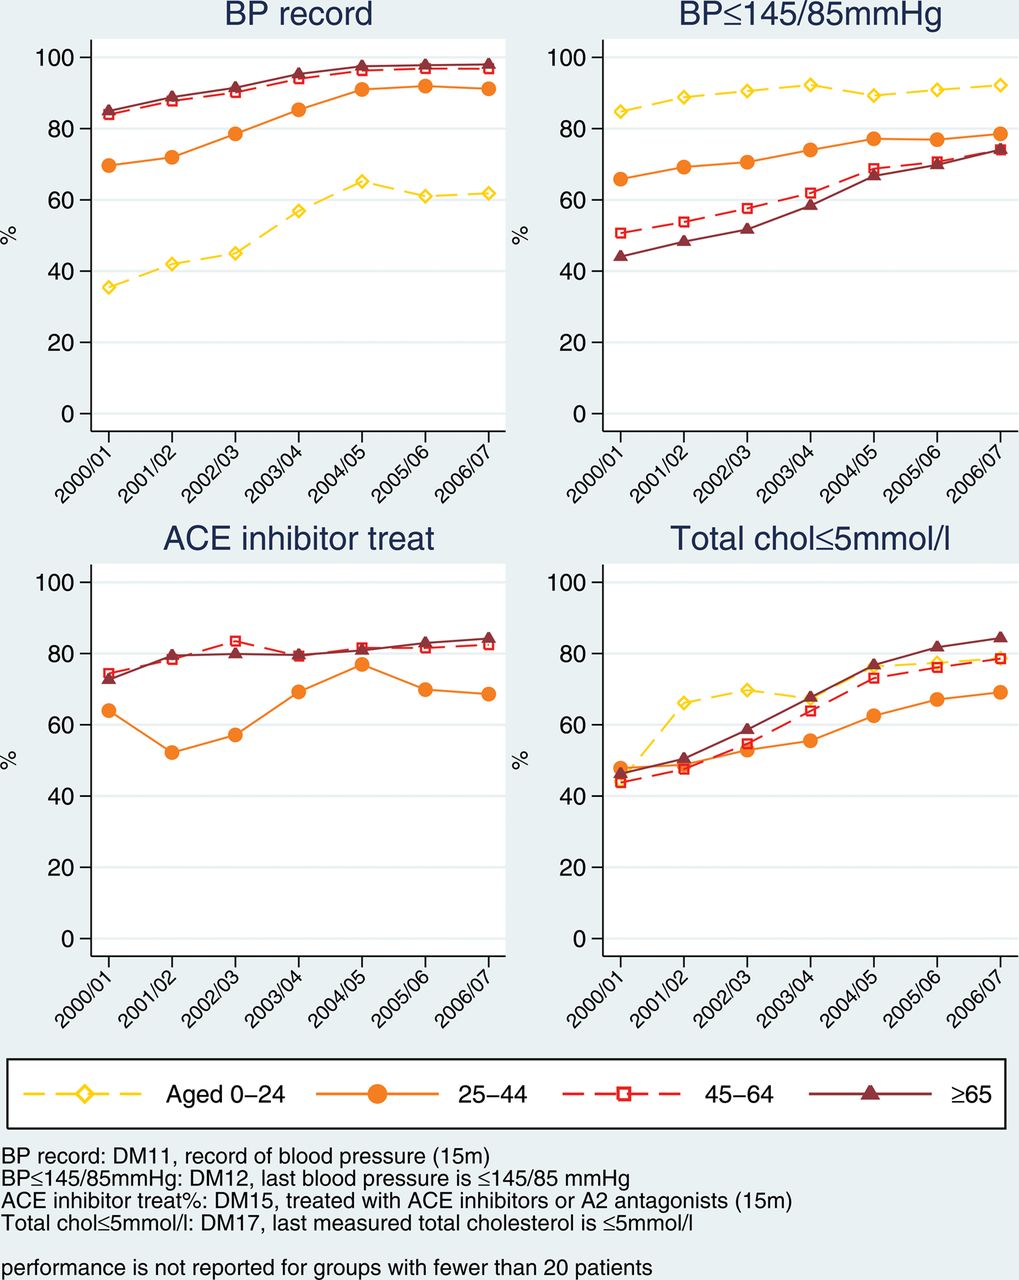
Recorded quality of care across the 148 practices increased for all individual indicators between 2000/1 and 2006/7 (table 1), with absolute improvements ranging from 4.2% (control of HbA1c levels ≤10%) to 85.5% (providing smoking cessation advice). Recorded QOF care as measured by the composite quality of care score increased from 46.5% in 2000/1 to 81.0% in 2006/7 (table 2), with scores increasing for all subgroups. On average, the highest scores across the whole period were observed for patients with three or more co-morbid conditions and patients aged 65 or over. Newly diagnosed cases and patients aged 17–29 consistently had the lowest recorded care levels. The relationship between age and recorded QOF care was not uniform across indicators, for example, control of blood pressure (indicator DM12) was, predictably, better for younger patients (see figure 1 and online supplementary appendix).

Prevalence and recorded Quality and Outcomes Framework care by age group.

Continued.
Overall effect of the introduction of the quality and outcomes framework
In the first year of the QOF (2004/5) there was an improvement in composite recorded QOF care, over-and-above that expected from the pre-intervention trend, of 14.2% (95% CI 13.7% to 14.6%; p<0.001). By the third year (2006/7), the difference was smaller, but still statistically significant, at 7.3% (95% CI 6.7% to 8.0%; p<0.001) (table 2 and figure 2).

Aggregate patient level Quality and Outcomes Framework care and predictions based on the pre-incentivisation trend.
Variations in care and in the impact of the QOF by patient and practice characteristics
The effect of the intervention did not vary significantly by age category although older patients were recorded to have received better care throughout the study period. The composite score for patients aged 65 years or over was higher than that for patients aged 17–39 years by on average 11% in the pre-QOF and 11.7% in the post-QOF period. Recorded QOF care was marginally lower for women in both time periods, by around 2%, but the impact of the intervention did not differ by gender. There were no significant differences in the intervention effect between multi-morbidity categories, although recorded QOF care increased with number of conditions, with performance scores for patients with three or more conditions being higher on average by 6.3% in the pre-intervention and 6.1% in the post-intervention periods compared with patients with no co-morbid conditions.
In the pre-intervention period recorded QOF care varied with the number of years living with diabetes. It was highest for patients living with the condition for 1–4 years and lowest for newly diagnosed patients. The gap in recorded care between these two groups widened from an average of 4.7% in the pre-QOF period to 9.1% in the post-QOF period. This is reflected in the intervention effect: compared with new diagnoses, all other patient subgroups were more positively affected by the intervention both in 2004/5 and 2006/7, and to a similar extent (around 6–7%).
Recorded QOF care did not vary significantly by area deprivation before or after the introduction of the incentivisation scheme. However, the effect of the intervention did vary with area deprivation: patients attending practices from the most deprived quartile appear to have gained less from the intervention compared with patients in the most affluent quartile of practices, by 4.9% in 2004/5 and 3.8% in 2006/7.
There was significant variation in recorded QOF care by practice diabetes prevalence rates, but the differences were small and diminished over time. The intervention effect also varied with practice diabetes prevalence. Compared with practices in the first quartile (lowest diabetes prevalence), the QOF effect was larger for practices in the second and third quartiles—by 1.4% and 2.1% respectively in the short term (2004/5) and by 3.2% and 4.8% respectively in the long term (2006/7).
Sensitivity analyses
The sensitivity analysis (based on untransformed data) agreed with the main analysis in all respects except for the relationship between the intervention and patient gender. In the sensitivity analysis both the short- and long-term impact of the pay-for-performance scheme was significantly larger, though small in scale, for female patients (1.2%, p=0.048 and 2.5%, p=0.01 respectively).
Discussion
The main aim of pay-for-performance schemes is to incentivise physicians to provide high quality care and thereby improve patient outcomes. Research to date suggests that pay-for-performance schemes have limited impact when implemented in isolation, but when supported by other quality improvement initiatives can have a positive effect on quality of care.3 We found that recorded quality of primary care in the UK, as measured by the QOF diabetes indicators, was already improving prior to the introduction of the scheme in 2004, and that it improved at an accelerated rate in the first years of its implementation, supporting the findings of previous studies.11 ,23 However, this accelerated improvement did not seem to benefit all population groups equally.
Strengths and limitations of the study
The main strength of our study was in the use of data for individual patients drawn from a nationally representative sample of practices. However, the study is subject to certain limitations. First, the QOF was introduced universally and was not implemented as part of a randomised experiment. The lack of a practice control group entails that analyses of its effect in quality of care are only possible using quasi-experimental methods. Results obtained with these methods can be method- and assumptions-sensitive; however, the interrupted time-series design is one of the most effective and powerful of all quasi-experimental designs and is routinely being used as the best possible approach when such research scenarios arise.24 Second, we are reliant on the accurate and consistent recording of data by practices; however, usage of clinical computing systems has changed over time and practices may have exaggerated their performance in response to the financial incentives. This study has investigated the quality of recorded diabetes care and there may be differences with care actually delivered. On the other hand, improved measurement is a necessary prerequisite for improved quality of care and one could argue that it is improved quality of care. Third, most of the measures refer to documentation levels and do not necessarily lead to the intended improvements in outcomes if not properly followed-through or the interventions are not offered in an appropriate manner (eg, advising a patient briefly ‘perhaps you should consider quitting smoking’ in order to ‘tick’ the relevant QOF box is not really a smoking cessation intervention). Fourth, some quality indicators are dependent on others, for example, indicator DM12 (blood pressure controlled) cannot be met unless indicator DM11 (blood pressure measured) has also been met. However, we aimed to quantify and assess overall quality of care as measured by the whole diabetes domain in the QOF and to be as inclusive as possible. Fifth, the conditions we modelled to investigate the effect of co-morbidity were not an exhaustive list and only the presence or absence was modelled and not the severity of each condition. However, the number of chronic co-morbidities is a well-established marker of the overall clinical complexity of a patient.25 Sixth, our findings assume that the observed trends in indicator achievement prior to QOF would have continued unchanged had the incentive scheme not been introduced, while only 3 years of data were available between the publication of the National Service Framework for diabetes1 and the implementation of the QOF (not including the transition year), on which we based our trend estimates. Finally, certain patient characteristics, such as ethnicity and socio-economic position, were not adequately recorded in the dataset and therefore could not be directly analysed.
Quality of diabetes care and patient characteristics
Recorded quality of diabetic care continuously improved over the period of our study, against a background of increasing disease prevalence. Recorded prevalence increased from 3.3% to 5% between 2000/1 and 2006/7, which is broadly in line with national trends.26 Overall levels of recorded quality of care improved in the pre-QOF period across all subgroups, following a general trend which has also been noted in other countries.27 ,28 In the first year of the QOF scheme (2004/5), recorded quality improved above the underlying trend. However, gains in the following years were smaller, especially in the third year (2006/7), a finding consistent with previous research.11 ,23 Our finding of an increase in recorded quality of care for diabetes in the pre-incentivisation period, leading to difficulties in separating the effect of the intervention, was also noted by Calvert et al,13 who found a significant QOF effect only on tight HbA1c control for type II diabetes patients.
The diminution of the gains in recorded quality of diabetes care under the QOF in the second and third years may be attributed to two factors. First, achievement for some indicators was close to 100% in 2004/5 and large improvements were not possible. Second, in 2004/5 most practices exceeded the maximum payment thresholds (the level of achievement required to secure maximum remuneration) for most indicators, hence there was limited financial incentive for further improvement. As a result, the QOF may not ultimately have resulted in higher quality of care than would have eventually been achieved in its absence, although it may have hastened practices’ arrival at that end point. The high annual cost of the QOF scheme—over £1billion per year, with almost 10% (£100 m) allocated to diabetes care—needs to be assessed in this light. In addition, the QOF relied on a large investment in information technology, which is likely to have contributed to the increase in recorded levels of care. However, that uniform investment across the whole of the UK primary care would be very unlikely to have taken place in the absence of the incentivisation scheme. Even if the Information Technology investment was there, it is doubtful the General Practitioners would choose to adapt to the new systems altogether, as they have, if not rewarded to do so.
As for differences between patient groups, women appear to have received slightly poorer QOF care both before and after the intervention. Levels of recorded care also varied substantially by patient age, with younger patients consistently receiving poorer quality care. This finding may be partly attributable to the higher proportion of type 1 diabetic patients in the younger age groups, for whom some quality targets are more difficult to achieve. Improvements in recorded quality over time were similar across all age groups, and the absolute gap between older and younger patients therefore did not close. Hamilton et al15 reported similar findings, with larger improvements for women, smaller benefits for younger patients and similar improvements for patients in deprived and affluent areas alike.
Under the QOF scheme some activities, such as measurement and control of blood pressure, are individually incentivised for patients with different conditions—for example, diabetes and coronary heart disease. Practices therefore receive greater financial rewards for achieving these targets for patients with multiple conditions. However, we found that recorded QOF care tended to be higher for patients with more co-morbid conditions throughout the entire study period, including the pre-intervention years, which suggests that practices may be more attentive towards diabetic patients with co-morbidities even in the absence of incentives.
Prior to the introduction of the scheme, newly diagnosed and long-standing (10 or more years) diabetic patients were recorded to have received worse QOF care, compared to patients who had been registered with the condition for 1–9 years. Improvements in recorded quality under the QOF were smaller for newly diagnosed patients and consequently the gap between newly diagnosed and established patients widened. One possible explanation is that cases diagnosed towards the end of the financial year (within 3 months for measurement indicators and 9 months for control indicators) are automatically excluded from QOF payment calculations for that year, and practices may therefore be more likely to defer care for these patients to the following year when they become eligible for participation in the programme. Another possible explanation is that practices may simply have insufficient time to achieve the targets for these patients, especially controlling for risk factors if they have had undiagnosed diabetes for some time.
Quality of diabetes care and practice characteristics
Practices with fewer diabetic patients generally performed better before the intervention, but less well afterwards. In the pre-intervention period, practices in deprived areas provided slightly higher overall recorded QOF care than those in more affluent areas. However, recorded improvements in the first year of the QOF scheme were greater for practices in more affluent areas and practices in deprived areas therefore fell behind. In the second and third year of the scheme practices in deprived areas closed the gap again, as has been noted in previous research.18 ,29 This suggests that practices in affluent areas were likely to have responded more quickly to the incentives, thus gaining a financial advantage in the early years of the scheme.23
Conclusions
The introduction of financial incentives was associated with an acceleration in the underlying improvement in recorded quality of primary care for diabetic patients in the UK, as measured by the QOF indicators. These improvements mostly captured documentation of recommended aspects of clinical assessment and only some measures of disease control. Although incentive schemes operating in other countries may be less successful, given the size of the financial incentives in the UK and the existence of parallel quality improvement initiatives. Most assessed diabetic patients appeared to benefit, but improvements were not as great for some sub-groups, for example, newly diagnosed patients and those attending practices in deprived areas and inequalities between some population groups remain. Overall, the introduction of the QOF significantly improved recorded quality of diabetes care, although the gains from the expensive scheme seem to be diminishing over time.
What is already known on this topic
-
Aggregate analyses at the practice level suggest that diabetes care was increasing before the introduction of the Quality and Outcomes Framework (QOF) and continued to increase after the scheme came into effect, above the underlying trend.
-
These improvements have been linked with modest reductions in emergency hospital admissions, although this effect was not sustained.
-
However, more recent patient level analyses using data from a primary care database concluded that the impact of the QOF on quality of care for diabetes is unclear.
What this study adds
-
Although levels of quality of diabetes care were on the increase before the intervention, the Quality and Outcomes Framework did have a significant impact and led to improvements in overall recorded patient-level diabetes care.
-
All patient subgroups seem to have benefited from the intervention but variation in care between them largely remains.
-
Patients with a new diagnosis of diabetes benefitted the least from the intervention and their care may be deferred to the next financial year.
References
Supplementary materials
Supplementary Data
This web only file has been produced by the BMJ Publishing Group from an electronic file supplied by the author(s) and has not been edited for content.
Files in this Data Supplement:
- Data supplement 1 - Online appendix
Footnotes
-
Contributors EK, TD and DR designed the study. EK extracted the data and performed the statistical analyses. EK and TD wrote the manuscript. DR, JV and SC edited the manuscript. EK is the guarantor of this work and, as such, had full access to all the data in the study and takes responsibility for the integrity of the data and the accuracy of the data analysis.
-
Funding This work received no specific funding.
-
Competing interests EK was partly supported by a NIHR School of Primary Care Research (NSPCR) fellowship in primary health care; no other relationships or activities that could appear to have influenced the submitted work.
-
Provenance and peer review Not commissioned; externally peer reviewed.
-
Data sharing statement The lists of Read and OXMIS codes used are available from the corresponding author. However, the General Practice Research Database data cannot be shared due to licensing restrictions.