Article Text

Abstract
Aim: To apply in practice a series of validated indicators for preventable drug related morbidity (PDRM).
Design: A pilot study to identify retrospectively potential PDRM events over a 2 year 3 month time frame using the MIQUEST computer software program.
Subjects and setting: The electronic patient record of all patients aged 18 years and over in nine English general practices.
Outcome measures: The number of potential PDRM events identified, as defined by the indicators.
Results: Five hundred and seven potential PDRM events were identified from 49 658 electronic patient records, giving an overall incidence of 1.0%. A small number of the indicators (n = 4) accounted for approximately 60% of the events, while for many indicators few events were identified. The most common events related to the use of non-steroidal anti-inflammatory drugs in patients with congestive heart failure or hypertension, lack of monitoring in patients prescribed angiotensin converting enzyme inhibitors, and the use of hypnotic-anxiolytic agents.
Conclusions: A small number of indicators contributed to the majority of the PDRM events. Interrogation of electronic patient records in primary care using computerised queries shows potential for detecting PDRM.
- drug related morbidity
- general practice
- quality indicators
- electronic patient records
Statistics from Altmetric.com
Recent reports from the US1 and the UK2 have raised the profile of the problem of drug related morbidity. Furthermore, drug related problems have been identified in a systematic review3 as a frequent cause of hospital admissions. This review identified, from 15 studies conducted worldwide, the median drug related hospital admission rate to be 7.1%. In more than 50% of cases these admissions were judged to have been preventable. In a recent UK study4 6.5% of admissions to a hospital medical admissions unit were considered to be drug related, with 67% judged to have been preventable. Preventable admissions were identified as being mainly due to problems with prescribing and monitoring of drug treatment.
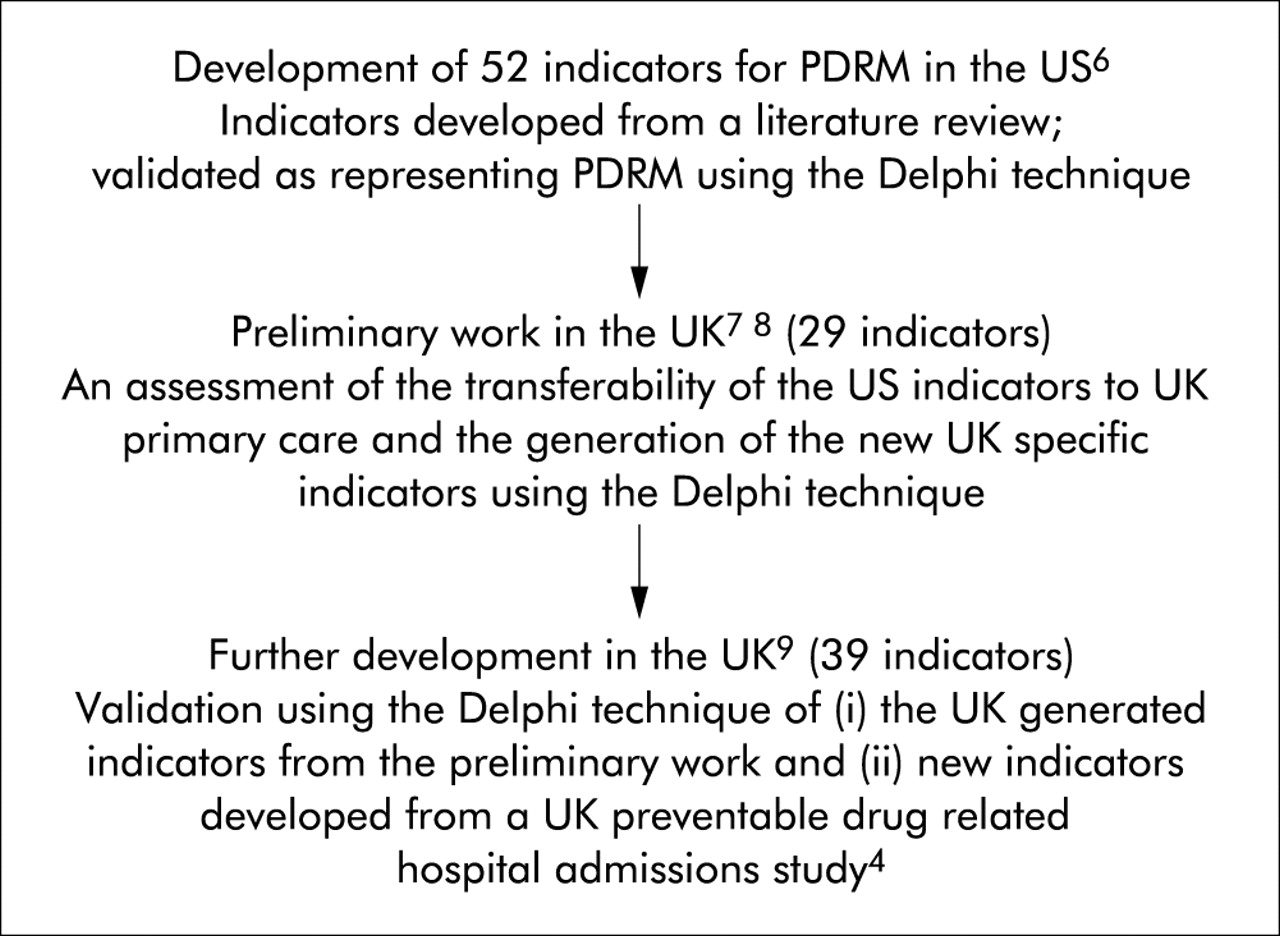
The adverse clinical outcomes of drug related morbidity are potentially substantial, while the economic impact in ambulatory care patients in the US has been estimated to cost $177 billion each year.5 Work in the area of preventable drug related morbidity (PDRM) has been primarily focused on secondary care in North America. No work has been undertaken in English primary care. This is surprising since the management of medicines in primary care is likely to make a significant contribution to the majority of preventable drug related hospital admissions. To develop effective strategies to reduce drug related morbidity and prevent drug related admissions, we need to be able to identify potential PDRM in primary care. The use of quality indicators representing PDRM is one possible way of doing so, thereby improving the safety and quality of health care. In the US, MacKinnon and Hepler6 developed a series of PDRM indicators. Taking their work as a starting point, two of the authors (CJM and JAC) have already undertaken a substantial volume of work to produce validated indicators for PDRM in the UK.7–9 A summary of the indicator development is shown in fig 1.

Development of PDRM indicators.
Building on a feasibility study,10 the work presented in this paper aimed to apply these indicators in three English primary care trusts (PCTs). The role and place of PCTs in the English NHS11 is shown in fig 2.

The place of primary care trusts (PCTs) in the NHS.11
In this pilot study our objective was to apply the indicators retrospectively in computerised general practices to identify potential cases of PDRM. By doing so, we aimed to identify the most common PDRM events in these study practices.
METHODS
Practices
Practices from three PCTs in the north west and east Midlands areas of England were eligible for inclusion in the study if they fulfilled the following inclusion criteria:
-
Member of either the Trent Focus Collaborative Research Network or the Primary Care Information Services (PRIMIS) network.
-
Running the EMIS 5 byte operating system.
-
MIQUEST (Morbidity Information Query and Export Syntax) software installed.
-
Electronically laboratory linked.
Inclusion was restricted to members of the specified networks because these organisations place an emphasis on the quality of the electronic patient record data.
Applying the indicators in practice
The number of potential PDRM events (as defined by the indicators) was assessed retrospectively by searching the electronic patient record of all patients aged 18 years and over in each practice over a 2 year 3 month time frame (1 November 1999 to 31 January 2002). The computer searches were run in each practice by a member of the research team (CJM, SR or VSH) between July and November 2002. This was achieved using the MIQUEST computer software program. The steps involved in this process are shown in fig 3.

Application of the indicators using MIQUEST software. EPR = electronic patient record.
PDRM indicators
A series of indicators for PDRM were applied in the GP practices. A summary of their derivation is shown in fig 1. From this previous work we had validated 39 PDRM indicators suitable for application in primary care.7–9 However, only 29 indicators were successfully applied in this study. The reasons for the exclusion of 10 indicators are shown in box 1.
Box 1 Reasons for exclusion of 10 indicators
-
Data not in electronic patient record (n = 6), for example:
Outcome: hospital admission due to an acute exacerbation of asthma or chronic obstructive airways disease (COAD).
Pattern of care: dispensing and issuing a prescription by a pharmacist for β blocker eye drops to a patient with a known history of asthma or COAD without advising them to contact their GP in the event of any deterioration of their respiratory symptoms.
-
Too complex to be written as a MIQUEST query (n = 3), for example:
Outcome: osteoporosis or broken bone.
Pattern of care: use of long term steroids at a dose equivalent to ⩾7.5 mg prednisolone per day without osteoporosis prophylaxis.
-
Technical error in query: miscoding a diagnosis (n = 1)
The indicators encompass a variety of different clinical situations and all take the form of an adverse therapeutic outcome (the PDRM event) resulting from an associated pattern of patient care.
Data analysis
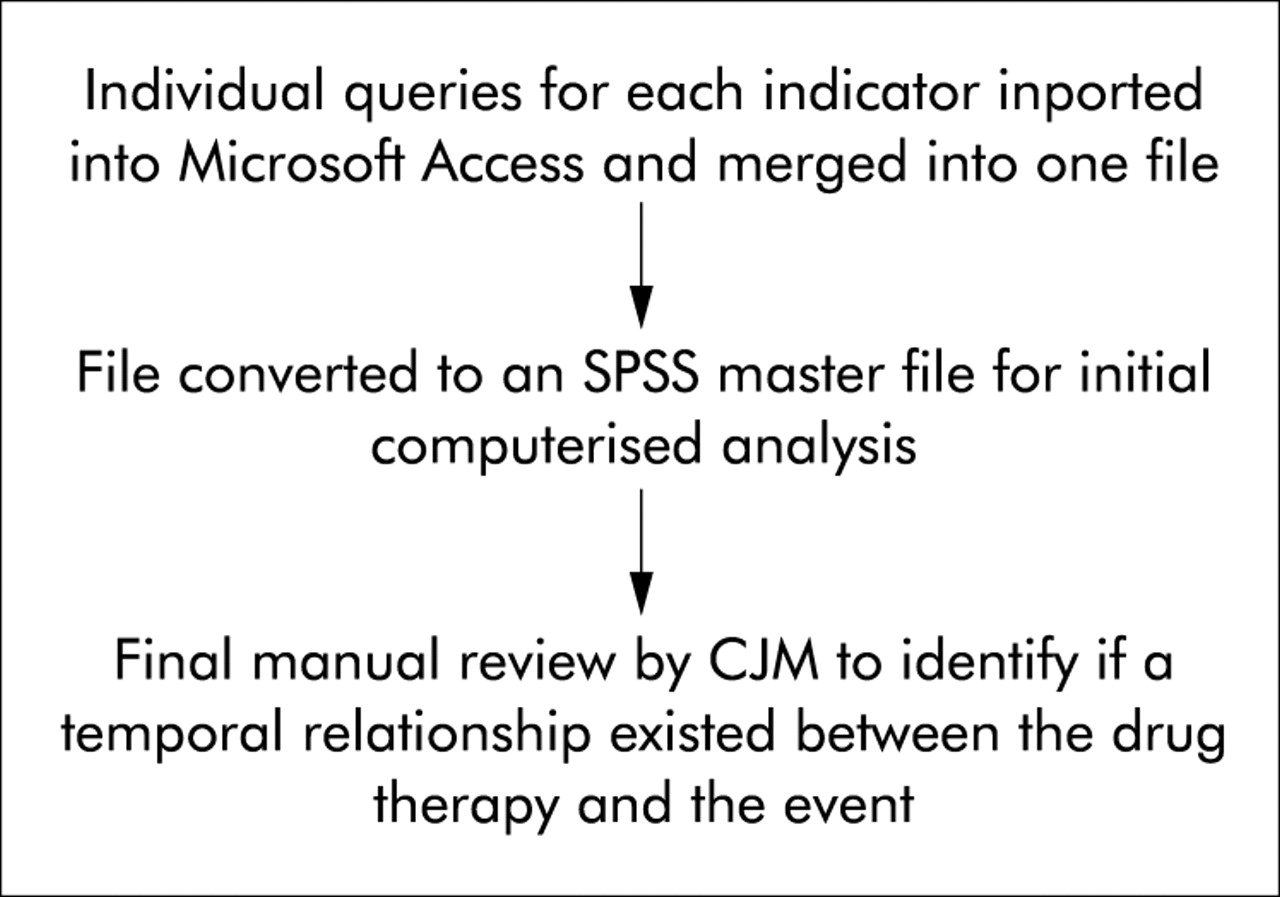
Up to six individual queries were required to collect the relevant data for each indicator, thus considerable data manipulation was required after data extraction. This process was automated as far as possible and is shown in fig 4.

The analysis process.
Completing this process identified the number of potential PDRM events for each indicator and therefore the most commonly occurring events in the study practices.
The study was approved by the local research ethics committee in each locality and the University ethical committee.
RESULTS
Fifteen practices were approached, 12 of which agreed to participate in the study. However, data from only nine practices were used as two were not laboratory linked and one did not have functioning software. In addition, two of the practices had linked computer support and were therefore treated as a single practice for the purposes of this study.
Key messages
-
A potential PDRM event was identified in 1.0% of electronic patient records.
-
Four indicators accounted for approximately 60% of these events.
-
The most commonly occurring events related to the prescribing of non-steroidal anti-inflammatory drugs and hypnotic-anxiolytics and the monitoring of angiotensin converting enzyme inhibitors.
The number of GP partners ranged from 1 to 7. Five practices held GP training status and they were located in urban (n = 3), suburban (n = 3), and rural areas (n = 2).
PDRM events
A total of 49 658 electronic patient records were identified for patients aged 18 years and over which were eligible for interrogation by the MIQUEST queries. In all, 507 potential PDRM events were identified, giving an overall incidence of PDRM of 1.0%. The incidence of PDRM at the individual practice level is shown in table 1. Table 2 shows the total number of events identified for each indicator and the range of numbers of events for each indicator in individual practices. It can be seen from table 2 that four indicators accounted for the majority of the events (302/507, 59.6%). These related to the use of non-steroidal anti-inflammatory drugs in patients with congestive heart failure or hypertension, lack of monitoring of potassium and creatinine in patients prescribed angiotensin converting enzyme (ACE) inhibitors, and the use of hypnotic-anxiolytic agents. No events were identified for five indicators, 1–10 for 11 indicators; 11–20 for five indicators, and 21–40 for four indicators.
Incidence of preventable drug related morbidity (PDRM) events in individual practices
Number of potential preventable drug related morbidity (PDRM) events by indicator and range of number of events at individual practice level
DISCUSSION
This pilot study has shown that a substantial number of potential PDRM events occur in English primary care. The computerised queries were able to interrogate GP systems, resulting in the identification of potential PDRM events in one in 100 electronic patient records.
Identification of potential PDRM events enables us to consider strategies that are likely to have the greatest impact on reduction of future PDRM. This in turn will benefit patients by improving the safety and the quality of health care and also have a positive impact on healthcare resource utilisation.
It is notable that most of the indicators contributed to very few events, while four (the prescribing of NSAIDs and hypnotic-anxiolytics and the monitoring of ACE inhibitors) contributed to approximately 60% of the PDRM events. However, the clinical implications for individual patients may be great, irrespective of the number of events identified by each indicator. To date, limited research has been undertaken on PDRM. As this work took place in the North American healthcare system,6,12,13 only cautious comparisons can be made. Nevertheless, despite the fact that MacKinnon and Hepler12 applied PDRM indicators within a managed care organisation using the database of a hospital based healthcare plan in Florida, a similar pattern emerged. A small number of indicators accounted for the majority of the PDRM events. Furthermore, some similarities existed in the clinical issues that contributed to the seven most frequently occurring PDRM events,12 with NSAIDs, ACE inhibitors, and failing to prescribe a β blocker after myocardial infarction appearing in both data sets.
However, when interpreting the study results a number of factors need to be considered. Although a temporal relationship was identified between drug therapy and the PDRM event, it does not necessarily mean that the drug was the direct or only cause of that event. Furthermore, the quality of our data is dependent upon the quality of the data present on the practice system. Although prescribing data are generally of better quality than diagnostic or lifestyle data on primary care computer systems,14 we accept that the quality of data recording in the practices was beyond our control. For this reason, the PDRM incidence data should be interpreted cautiously. At present it would be inappropriate to use these data to draw comparisons between practices but, with current moves to improve data recording in the UK and the implications of the new GP contract,15 computerised data from general practices are likely to be more reliable in the future and appropriate comparisons may then prove useful. Despite some practical difficulties, electronic patient records have considerable potential in the detection of PDRM.
We have shown that a substantial number of potential PDRM events are occurring in primary care. However, because of the problems of assigning direct causality of the drug to the event, rather than aiming to collect prevalence data our ultimate purpose is to use the indicator data to generate discussion in facilitated multidisciplinary discussion forums attended by key practice personnel (GPs, nurses, pharmacists and the practice manager). These will use the key principles of root cause analysis (prioritisation, root cause identification and root cause elimination).16 The outcome of these meetings will form the focus of a subsequent paper describing how the overall process can facilitate improvements in medicines management and ultimately the quality of patient care.
Acknowledgments
We would like to thank the staff at all the GP practices for their help and support with this study.
REFERENCES
Footnotes
-
See editorial commentary, p 170