Article Text

Abstract
Study objective: To investigate whether the Index of Multiple Deprivation 2000 (IMD) is more strongly related to inequalities in health in rural areas than traditional deprivation indices. To explore the contribution of the IMD domain “geographical access to services” to understanding rural health variations.
Design: A geographically based cross sectional study.
Setting: Nine counties in the south west region of England.
Participants: All those aged below 65 who reported a limiting long term illness in the 1991 census, and all those who died during 1991–96, aged less than 65 years.
Main results: The IMD is comparable with the Townsend score in its overall correlation with premature mortality (r2 = 0.44 v 0.53) and morbidity (r2 = 0.79 v 0.76). Correlation between the Townsend score and population health is weak in rural areas but the IMD maintains a strong correlation with rates of morbidity (r2 = 0.70). The “geographical access to services” domain of the IMD is not strongly correlated with rates of morbidity in rural areas (r2 = 0.04), and in urban areas displays a negative correlation (r2 = −0.47).
Conclusions: The IMD has a strong relation with health in both rural and urban areas. This is likely to be the result of the inclusion of data in the IMD on the numbers of people claiming benefits related to ill health and disability. The domain “geographical access to services” is not associated with health in rural areas, although it displays some association in urban areas. This domain is potentially important but, as yet, inadequately specified in the IMD for the purposes of health research.
- access
- Index of Multiple Deprivation 2000
- rural
- IMD, Index of Multiple Deprivation 2000
- LLTI, limiting long term illness
Statistics from Altmetric.com
Traditional census based deprivation indices such as the Townsend score1 are not strongly related to health in rural areas of the UK.2 The reasons for this are unclear. It has been suggested that rural areas do not suffer from deprivation, and that where deprivation does exist in rural areas it is not related to health in the same way as urban deprivation. However, it has also been argued that the underlying relation between health and deprivation is the same in rural as in urban areas, and that the difficulties lie in detecting rural deprivation.3,4
There are several reasons why this might be the case. Firstly, deprived populations in rural areas may be too scattered to be identified by aggregate measures like deprivation indices. In the UK, analyses of deprivation and health often use the census ward as a unit of analysis. A ward averages over two thousand households and, although a convenient source of readily available data, may not reflect natural communities. Rural wards are more likely than urban wards to be socially heterogeneous, and this may dilute the impact of that part of the population who experience deprivation.5
It has also been argued that the measurement of deprivation is specific to the urban situation: that the indices do not include the important markers of rural deprivation.6,7 For example, car ownership (an element of the Townsend deprivation score) may be a marker only of urban deprivation, as travel distances and poor public transport provision in rural areas make car ownership a necessity for rich and poor alike.8 Geographical accessibility to essential services may be a key concept contributing to deprivation in rural populations, but it has not been captured by census based measures of deprivation and it has therefore received comparatively little attention in rural health related research in the UK.
The Index of Multiple Deprivation 2000 (IMD), the latest version of the 1998 Index of Local Deprivation, does include access to services.9 It also differs from many other deprivation measures by going beyond census data and using a range of information from local government and other agencies to create a measure of deprivation comprising six themes, or “domains”, which are combined to create an overall score. Wards are ranked by their score in each domain, and overall by the combined IMD score. One of these domains (contributing 10% of the total IMD score) is “geographical access to services”, which captures the distance to local services. This measurement of access may potentially have captured an element of rural deprivation that had previously been neglected.
The inclusion of the access domain in the IMD has resulted in a proliferation of analyses by health authorities, identifying their ranking on this domain, on the basis that the addition of access has added a vital new dimension to the measurement of rural deprivation. However, there has been little research to investigate whether the IMD or the access domain of the score actually measure rural deprivation by demonstrating associations with health outcomes in the rural population.10 One reason may be that the IMD is only available for 1998 ward boundaries. Many of the data available on health outcomes are for 1991 census wards, while alternative measures of deprivation and of rurality are readily available for 1991 based geographical units. Geographical comparability between the IMD and other data has therefore been a problem. Unfortunately, the IMD geography is also incompatible with that used for standard 2001 census outputs.
In this paper, we describe how the IMD relates to another widely used census based measure of deprivation, the Townsend Index, and investigate its association with two population health outcomes: premature limiting long term illness (LLTI), and all cause premature mortality. We investigate how the different domains within the IMD contribute to its relation with these health outcomes, and in particular how the access domain compares with other measures of access to health services.
METHODS
The study area is the nine 1991 counties of Avon, Cornwall and the Isles of Scilly, Devon, Dorset, Hampshire, the Isle of Wight, Gloucestershire, Somerset, and Wiltshire which made up the former South and West Health Region. This area has a population of about six million. The region has a substantial rural population and includes Cornwall, one of the most rural and lowest income areas of England. Data were assembled for all wards in the study area, using 1991 boundaries.
The Townsend deprivation score is calculated from 1991 census small area statistics.11 It comprises four variables: the proportion of people without a car, the proportion of households in overcrowded accommodation, the proportion of households not owner occupied, and the proportion of people unemployed. The six IMD domains are: income; employment; health deprivation and disability; education, skills and training; housing; and geographical access to services (access). Thirty three indicators are used to make up these domains including, for example, Department of Social Security (DSS) benefits data identifying households in receipt of means tested benefits, in addition to information from the 1991 census. Table 1 lists the domains and their constituent indicators. The access domain is made up of four indicators: the straight line distance to three local services (food shops, post offices, and general practices) and to primary schools. The first three indicators are measured for those claiming means tested benefits, the fourth for all children of primary school age.
Indicators and domains of deprivation in the Index of Multiple Deprivation 2000*
The six domains give a score for each ward, and are combined into a single summary index that cannot be recalculated for different geographical units without access to the original data and details of the methods used in calculating the original score, neither of which is publicly available. To match the IMD score to the rest of the data it was therefore necessary to re-weight the original score to reflect the degree of overlap between wards described by 1991 and by 1998 boundaries. The UK Look-up Tables facility based on the ONS All Fields Postcode Directory12 was used to quantify the degree of overlap between the two sets of wards in terms of households resident.
Each component of the IMD score was re-allocated from 1998 to 1991 wards in proportion to the numbers of households in the overlapping areas (table 2). The resulting scores for each of the six domains of the IMD, and for the final score, are necessarily estimates of the “true” scores, and the limitations of our method are discussed below.
Example of calculating a re-weighted Index of Multiple Deprivation 2000 (IMD) score for two 1991 wards
Rurality was measured using the ONS classification of 1991 wards.13 Wards were allocated to 14 categories, of which we were particularly interested in “rural” and “rural fringe”, the remaining 12 being combined to give a third “urban” grouping. We have also used population density, measured as persons per hectare for each ward, to describe rurality. As well as the access domain of the IMD, access to health care was measured using both the straight line distance and the road network travel time to the nearest general practice and the nearest acute hospital. Distances were measured between postcodes and averaged for wards; travel times by road were measured using average driving speeds along roads in the Bartholomew road network. Full details of our spatial data modelling are given elsewhere.14
We calculated two measures of health: premature LLTI for those aged 0 to 64, and premature mortality from all causes for the same age group. Numbers of LLTI cases in each ward were taken from the 1991 census, and numbers of deaths were taken from ONS records for 1991 to 1996, aggregated for the period to reduce the problem of small numbers of events in some wards. Rates of LLTI and mortality were indirectly standardised to the age and sex rates of the region, using population data in five year age groups, taken from the 1991 census.
Scatter plots of the IMD and Townsend score against standardised rates of the two health outcomes were used to assess the relation between deprivation and ill health in urban, rural fringe, and rural wards. Pearson correlation coefficients were calculated for these relations, and the role of access in determining the fit of the IMD to health outcomes was assessed. The access domain of the IMD and other measures of access were also compared, using scatter plots and correlation coefficients, and the correlation between the IMD and health data in the different area types was calculated.
RESULTS
The area’s population (in contrast with its land use) is mostly urban, with 1031 of 1448 wards (containing 83% of the population) urban under ONS definitions, although a significant rural area remains (n = 253 wards, 7% of the population), the remainder being classified as “rural fringe”. According to the Townsend score, the area is less deprived than the national average, with a mean score of −1.04, where 0 is the mean for England and Wales. In 1998 the most deprived ward in the region was ranked 133 under the IMD (rank one being the most deprived in the country and rank 8414 the least deprived). The median rank for the region was 4404, compared with the national median of 4207, again suggesting that the study area is slightly more affluent than England and Wales overall.
The IMD is comparable to the Townsend score in its correlation with both mortality and morbidity. Neither the Townsend score nor the IMD had a strong linear relation with all cause premature mortality (fig 1). In rural areas there is very little relation with either measure of deprivation. This was stronger in rural fringe and urban areas with the Townsend score being more closely related to premature mortality in all three area types, and overall (r = 0.53 versus r = 0.44).

Relation beween premature mortality*, the Twonsend score, and the Index of Multiple Deprivation 2000 (IMD) in rural, rural fringe, and urban areas. * The age/sex standardised rate of mortality from all causes in those aged under 65.
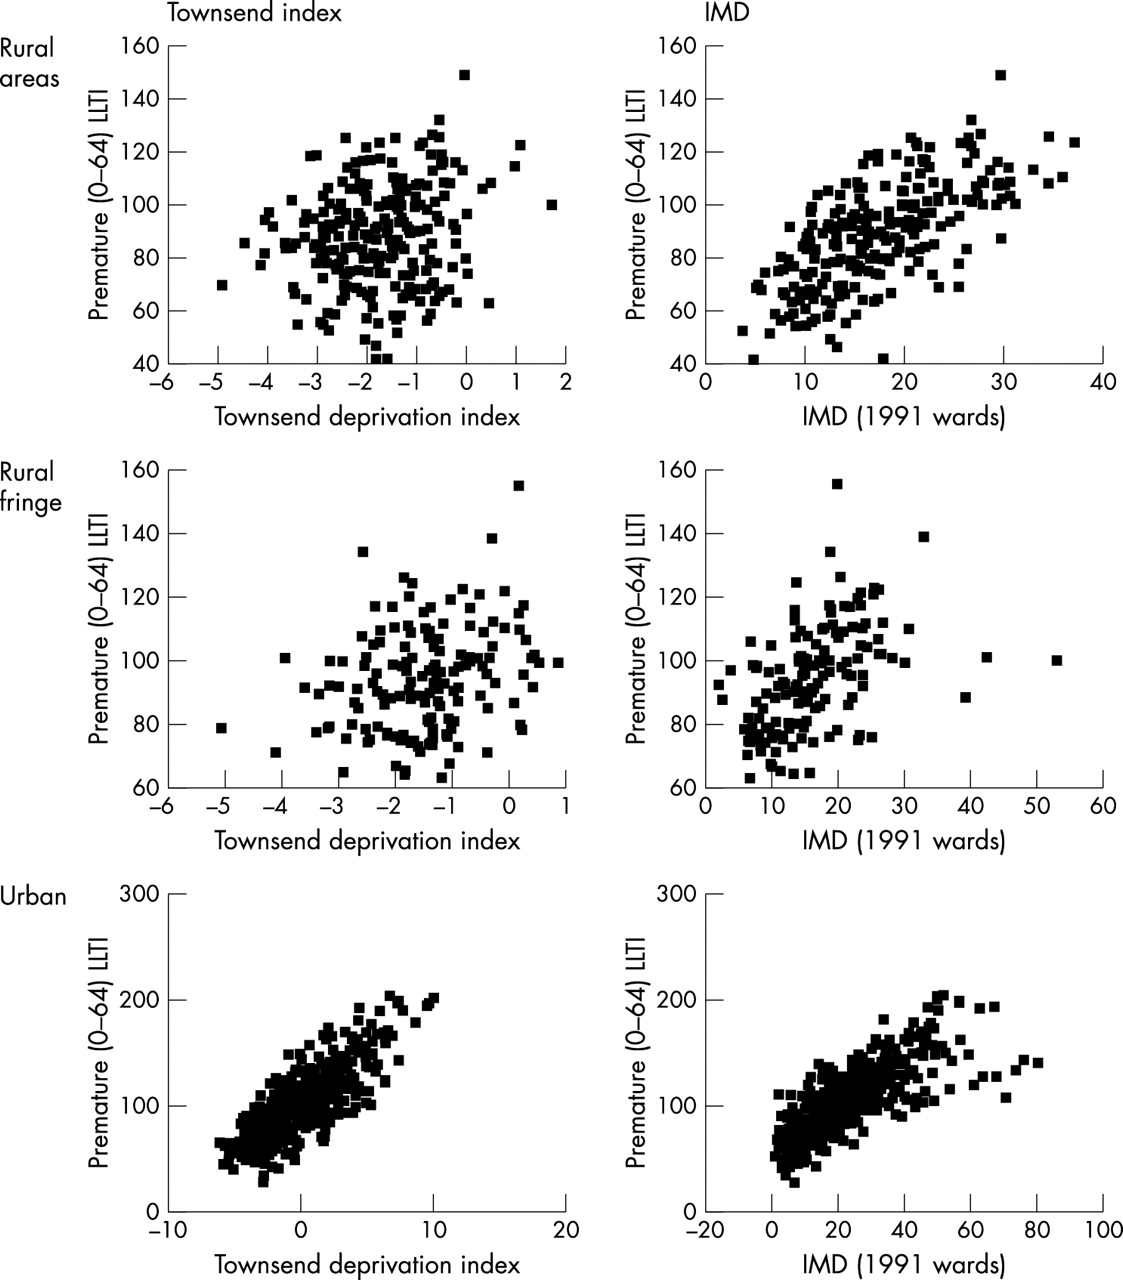
The pattern is different for LLTI, with which the IMD has a strong relation in both rural and urban areas, whereas the Townsend score is only strongly related in urban areas (fig 2). However, as these make up most of the wards in the region, the overall relation with LLTI is very similar for the two indicators (r2 = 0.76 for the Townsend score versus 0.79 for the IMD). The access domain of the IMD does not contribute to the strong relation with LLTI in rural areas, where there is no linear relation between this domain and either LLTI or premature mortality. In urban areas, the correlation between access and health is negative, with less accessible areas associated with lower rates of premature mortality and morbidity (fig 3). In rural areas, the access domain has the weakest relation with the two health outcomes of all the IMD domains. Table 3 shows the correlation coefficients. The IMD is more strongly correlated with rates of LLTI than with rates of premature mortality in every domain and in all area types.
Pearson correlation coefficients for the relation between deprivation, mortality, and morbidity

Relation between the Townsend score and IMD and premature LLTI* in rural, rural fringe, and urban areas. *The age/standardised rate of self reported limiting long term illness in those aged under 65.

Relation between the IMD access domain, premature mortality, and LLTI* in rural, rural fringe, and urban areas. *The age/standardised rate of self reported limiting long term illness in those aged under 65.
The strongest relations with premature mortality are found in the health deprivation and disability and education domains in rural areas, and in the income and housing domains in rural fringe and urban areas. For LLTI, health deprivation and disability is the domain most strongly related to rates in all areas, with employment also highly correlated in rural and rural fringe areas, and income in urban areas.
Other measures of access do not improve on the correlation with health shown by the IMD access domain. Access to secondary care shows a slightly higher correlation with LLTI in rural areas than the IMD access domain but in all other areas, and overall, there is no improvement on the correlation shown by the IMD access domain (table 4).
Pearson correlation coefficients for the relation between access measures, mortality, and morbidity
The IMD access domain correlates well with other measures of access to general practice, but more weakly with population density and access to secondary health care, the strongest correlation being with the straight line distance to the closest GP, which is to be expected as this measure is one of the IMD’s constituent parts, albeit only calculated for those in receipt of benefits (table 5).
DISCUSSION
Although the strong correlation between deprivation and health is well known, this relation does not hold in rural parts of the UK, where it may be that deprivation and hardship are poorly captured by conventional deprivation indicators.2 These indicators may underestimate the degree of deprivation experienced in rural areas, which can suffer from problems of seasonal unemployment, low pay, and isolation.4,15 The IMD is unique in its inclusion of a measure of geographical access as an element of deprivation and in its direct measure of poverty (through data on benefit receipts). This has the potential to provide a missing dimension of deprivation in rural areas.
We have shown that the IMD is more strongly correlated with rates of LLTI in rural areas than the Townsend score, but it performs very similarly to the Townsend score for premature mortality, with poor correlation in rural areas, becoming stronger in urban areas. Overall, the income and health deprivation and disability domains provide the closest fit, with employment an important predictor of both health outcomes in rural wards, the association being much stronger for LLTI than mortality. The employment domain of the IMD contains two measures directly related to chronic ill health: the number of Incapacity Benefit claimants, and the number of Severe Disablement Allowance claimants of working age; the income domain is calculated using measures of Disability Working Allowance and disabled Council Tax Benefit claimants; and the health deprivation and disability domain also contains data on Disability Living Allowance, Incapacity Benefit and Severe Disablement Allowance claimants, as well as the two outcome measures we have used here: the age-sex standardised rate of premature mortality and of LLTI. In the IMD, mortality data are only available at the district health authority level, and are directly rather than indirectly age standardised. LLTI data were taken from 1991 census ward data: the same source as our measure. It seems very likely therefore that, despite our reallocation of data from 1991 to 1998 wards, the strong correlations we have seen with LLTI in all areas are due to the use of the same underlying data for this element of the index.
We have also shown that the IMD access domain is the most weakly related to health outcomes. In rural areas there is effectively no relation and in urban areas there is an inverse relation. It certainly appears to be capturing some elements of rurality: access scores are higher in ONS “urban” areas than in “rural” and in areas of high population density. Despite being calculated only for people receiving benefits, we found the access score correlated strongly with ward level measures of access to primary care, especially with the straight line distance to a main GP surgery. The correlation with the distance to secondary care was far weaker. With the exception of the correlation between access to hospital and rates of LLTI in rural areas, no other measure of access calculated for this study improved on the IMD’s poor correlation with health in any area.
Access as measured in the IMD, by population density or by the distance to health services thus does not help to explain the rural health outcomes used here. It is, however, a long established and important feature of rural deprivation and is a relevant consideration for health planners and policy makers. Equity of access is important to the NHS, influencing both the personal and financial costs of using health services for those in need of care, and possibly the timely and appropriate use of health services.
There may be several explanations why the geographical access to services domain of the IMD is not related to health outcomes in our study. Firstly, and perhaps most importantly, distance barriers to accessing health care may have an impact on the timely use of services and quality of care but without directly affecting the global health outcome measures used here. However, from the perspective of equity of access, we still need to ensure that those with the highest need for health services in rural areas do have accessible primary and secondary care. Secondly, the IMD only measures access to local level services, and not access to secondary or tertiary health care. An interesting alternative model that deals with access to services at a range of different geographical scales is provided by the Australian ARIA index,16 which uses GIS based road distances to population centres of various sizes in the construction of a standard measure of remoteness, which is considered suitable for a broad range of applications. Finally, the IMD uses straight line distance as a global proxy measure of access for all modes of transport. The greatest disadvantage is experienced by those without access to a car (including members of one car households without daytime access). For these groups, straight line travel distance is likely to provide the least appropriate measure of the obstacles of access. Although the access domain focuses on the more vulnerable groups in society, there may also be considerable hidden poverty, for example relating to low pay and seasonal employment that are especially prevalent in rural areas, but are inadequately captured by the index.
Limitations
There are several limitations to our study, the most serious of which is the re-weighting of the IMD to 1991 ward boundaries. Most variables in the score are calculated for postcodes for the period of the late 1990s. These were assigned to 1998 ward boundaries. When re-weighting to 1991 wards the allocation of the score is proportional to estimates of the number of households within each ward. This is likely to be an overestimate in some cases and an underestimate in others. The greatest misallocation will occur in areas that have experienced significant changes in socioeconomic profile between 1991 and 1998. This misclassification is likely to be non-differential and will tend to reduce any associations in the data.
Another potential limitation, which may have a similar effect, is our use of wards as the unit of analysis. Although data on health and deprivation were readily available at this level, wards may be too large and diverse to reflect local community boundaries, especially in rural areas, which tend to be more socially mixed than urban areas. This may reduce both our ability to detect rural deprivation and the chance of finding a relation between access, deprivation, and health.
This is an ecological study, and shares the limitations of all such studies: because measurements are averaged over populations the relation between variables may be weakened, resulting in less power to detect relations that exist, and the relations between aggregate measures may not reflect the true relations between individuals. Also, all of our measures were area based and we were unable to distinguish between the influence of the surrounding area (“contextual effects”) or the individuals within an area (“compositional effects”)17 both of which may contribute to spatial inequalities in health. A multilevel analysis including both individual and area estimates of deprivation and access would be an interesting development of this work.
A further limitation that may act to attenuate any relation between health and deprivation is the temporal mismatch between our datasets. The data used in this study come from several different time periods, ranging from 1991 for LLTI and Townsend deprivation score data to 2000 for IMD data. Although the relations with access to health services should be less affected—both GP and DGH locations are from 1991–96—we were not able to take into account the possible effect of any lag between the pattern of access to health services and reported health outcomes. Future work relating changes in access over time to patterns of health deprivation would be a useful addition to this work.
Finally, we have explored the relation between health and the IMD score in just one region of England. This area is not only relatively affluent, but also does not display the extremes of remoteness seen, for example, in the Scottish Highlands. It may be that a threshold level of remoteness from services is needed before an effect of access is seen, and that this level is simply not reached in the south west of England. It has no substantial ethnic minority populations, and a generally good level of population health. We have used only general measures of health outcome. More work is needed to test the utility of this index as a general predictor of health in other areas of the country, and against different measures of health.
CONCLUSIONS
In conclusion, we have shown that the IMD has a strong relation with health, particularly self reported illness, in both rural and urban areas, but this is likely to be the result of the inclusion of benefit claimant data related to ill health and disability, and to the explicit measures of health in the health deprivation and disability domain of the score. By contrast, the geographical access to services domain is not strongly correlated with global measures of rural health, and is inversely related to health outcomes in urban areas. The access domain, along with all other measures of access considered here, provides a comparatively unsophisticated measure that does not include the influence of different modes of transport on distinct population subgroups, and may in particular be a weak reflection of the rural access challenges facing the most vulnerable groups. Furthermore, it concentrates primarily on access to local services that are comparatively good in both urban and rural areas, but does not incorporate any measurement of access to more specialist services.
The policy importance of ensuring equitable access to health services as far as possible covers the principle of equity—it can be argued that the NHS should not disadvantage people in terms of cost or time to health services even if there are no directly detectable health disbenefits—and the effectiveness of health care: the need to minimise direct disbenefits to health from poor access to services. Measuring and understanding the effects of variations in geographical access to health services is important from both of these perspectives. We believe that considerable work still remains to be done in developing a truly representative measure of access to health services. Such a measure should include a well developed measure of public transport access10 and an estimate of travel time by car. It should also be possible to apply the measure appropriately to selected populations. These issues are of particular importance in the period surrounding the release of 2001 census data (http://www.statistics.gov.uk/census2001/) and the further enhancement of the government’s Neighbourhood Statistics service (http://www.neighbourhood.statistics.gov.uk/), both of which will initiate a new round of debate concerning the construction of indicators such as IMD for policies focused on the eradication of area based disadvantage. The IMD access domain covers a broad range of potential policy areas, but with only limited data. We suggest that the access to services dimension, along with all the other measures of access considered here, is potentially important but as yet inadequately specified for health research. It would therefore be inappropriate to simply reproduce the IMD using updated data without a fuller evaluation of its interpretation, and particular caution should be exercised in its use as a deprivation measure for studies involving access to health care.
Key points
-
We investigated the relation between the full IMD, access to health care, and global measures of health in rural and urban areas of south west England.
-
We found that the IMD had a strong relation with health, particularly self reported illness, in rural as well as urban areas, but that the domain geographical access to services did not contribute to this relation.
-
The simple measure of distance used to describe access to local services in the IMD correlated well with distance to general practice, but less well with distance to hospitals. Caution should be exercised when using the access to services domain of the IMD in studies involving access to health care.
-
Further research is needed to devise a measure of access that adequately captures the access challenges facing the most vulnerable rural groups in need of secondary and tertiary health services.
Policy implications
-
Geographical access to health services is an important aspect of rural health policy: the government white paper “Our Countryside: the future” (DETR, November 2000) emphasised the need for the development of a robust method for measuring access and a better understanding of the relations between access, health service use, and health outcomes.
-
The IMD is a readily available measure of deprivation that includes an access component.
-
A better understanding of the relations between access, as specified in the IMD, other measures of access to health services, the use of health care, and population health outcomes is necessary if the IMD is to be a useful tool for rural policy making.
Footnotes
-
Funding: none
-
Conflicts of interest: none declared.