Article Text

Abstract
Objective To derive and validate a set of clinical risk prediction algorithm to estimate the 10-year risk of 11 common cancers.
Design Prospective open cohort study using routinely collected data from 753 QResearch general practices in England. We used 565 practices to develop the scores and 188 for validation.
Subjects 4.96 million patients aged 25–84 years in the derivation cohort; 1.64 million in the validation cohort. Patients were free of the relevant cancer at baseline.
Methods Cox proportional hazards models in the derivation cohort to derive 10-year risk algorithms. Risk factors considered included age, ethnicity, deprivation, body mass index, smoking, alcohol, previous cancer diagnoses, family history of cancer, relevant comorbidities and medication. Measures of calibration and discrimination in the validation cohort.
Outcomes Incident cases of blood, breast, bowel, gastro-oesophageal, lung, oral, ovarian, pancreas, prostate, renal tract and uterine cancers. Cancers were recorded on any one of four linked data sources (general practitioner (GP), mortality, hospital or cancer records).
Results We identified 228 241 incident cases during follow-up of the 11 types of cancer. Of these 25 444 were blood; 41 315 breast; 32 626 bowel, 12 808 gastro-oesophageal; 32 187 lung; 4811 oral; 6635 ovarian; 7119 pancreatic; 35 256 prostate; 23 091 renal tract; 6949 uterine cancers. The lung cancer algorithm had the best performance with an R2 of 64.2%; D statistic of 2.74; receiver operating characteristic curve statistic of 0.91 in women. The sensitivity for the top 10% of women at highest risk of lung cancer was 67%. Performance of the algorithms in men was very similar to that for women.
Conclusions We have developed and validated a prediction models to quantify absolute risk of 11 common cancers. They can be used to identify patients at high risk of cancers for prevention or further assessment. The algorithms could be integrated into clinical computer systems and used to identify high-risk patients.
Web calculator: There is a simple web calculator to implement the Qcancer 10 year risk algorithm together with the open source software for download (available at http://qcancer.org/10yr/).
- PRIMARY CARE
- QResearch
- cancer
This is an Open Access article distributed in accordance with the Creative Commons Attribution Non Commercial (CC BY-NC 4.0) license, which permits others to distribute, remix, adapt, build upon this work non-commercially, and license their derivative works on different terms, provided the original work is properly cited and the use is non-commercial. See: http://creativecommons.org/licenses/by-nc/4.0/
Statistics from Altmetric.com
Strengths and limitations of this study
-
The QCancer-10 year risk algorithms provide valid measures of absolute risk in the general population of patients as shown by the performance in a separate validation cohort.
-
Key strengths include size, duration of follow up, representativeness, and lack of selection, recall and respondent bias.
-
The study has good face validity since it has been conducted in the setting where the majority of patients in the UK are assessed, treated and followed up.
-
The study used linked hospital, mortality and cancer records and is therefore likely to have picked up the majority of cancer diagnoses.
-
The algorithms do not include some potential risk factors for cancer such as diet or physical activity since these are not routinely recorded in electronic health records.
Introduction
The UK has one of the worst records for cancer in Europe with late diagnoses and poor survival.1 Each year around 230 000 people in England are diagnosed with cancer and around 125 000 die from it.2 The early diagnosis and prevention of cancer is likely to remain a high priority especially with the global decline in other major causes of mortality such as cardiovascular disease and the ageing population.
Over the past few years, we developed and validated a series of risk prediction algorithms collectively known as the QCancer algorithms.3–10 These were designed to quantify the absolute risk that a patient has an existing cancer based on combinations of symptoms and readily available risk factors and are intended to help inform decisions regarding further investigation and referral.3–10 We decided to build on this work and derive a set of risk prediction algorithms to quantify absolute risk of future cancer over a 10-year period using predictor variables recorded in the patient's primary care electronic record. In particular, we were interested to quantify the absolute risk of cancer in (1) patients with a positive family history of specific cancers, previous cancers or a chronic disease which might increase cancer risk and might require additional surveillance and (2) those with potentially modifiable risk factors (such as smoking and alcohol) for whom quantification of absolute risk might be useful to support efforts to lower risk. We decided to focus on the 11 most commonly occurring cancers in men and women in England. This paper reports the results of the derivation and validation of the new algorithms based on the QResearch database linked to cancer registrations, mortality and hospital episode statistics.
Methods
Study design and data source
We undertook a prospective cohort study in a large population of primary care patients from an open cohort study using the QResearch database (V.38).
The QResearch database is a large pseudonymised database of electronic health records from over 750 general practices in the UK which has been described in detail elsewhere (http://www.qresearch.org). Over 99% of people in the UK are registered with general practices and have information routinely recorded on an ongoing basis when they consult their general practitioner (GP) or other primary care professional, receive prescriptions and from referrals to secondary care. The database includes event level detailed information on patient demographics (year of birth, sex, ethnicity, deprivation), medication, clinical diagnoses, referrals, clinical values (such as body mass index (BMI), systolic blood pressure), laboratory investigations. The QResearch database has data from primary care dating back to 1989 which has been linked at individual patient level to cancer registrations data (from 1990 onwards), mortality records (from 1997 onwards) and to hospital admissions data (from 1998 onwards). It has a population which is representative of that in UK and the database has been used extensively for epidemiological research including disease-based epidemiology, health services research, the development of risk prediction models and evaluation of drug safety.
We included all practices in England who had been using their Egton Medical Information Systems (EMIS) computer system for at least a year. We randomly allocated three-quarters of practices to the derivation data set and the remaining quarter to a validation data set.
We identified an open cohort of patients aged 25–84 years drawn from patients registered with practices between 1 January 1998 and 30 September 2013. We excluded patients who did not have a postcode-related Townsend score. For each type of cancer, we excluded patients with a history of the relevant cancer any time prior to the study start date. We determined an initial entry date to the cohort for each patient, which was the latest of the following dates: 25th birthday, date of registration with the practice plus 1 year, date on which the practice computer system was installed plus 1 year, and the beginning of the study period (1 January 1998). Patients were censored at the earliest date of the diagnosis of cancer, death, deregistration with the practice, last upload of computerised data, or the study end date (1 October 2013).
Cancer outcomes
Our outcomes were incident diagnosis of each type of cancer focusing on the 11 most common cancers in England in 2012 (excluding skin cancers) as identified by the Office of National Statistics (ONS).11 The cancers were as follows (listed alphabetically):
-
Blood cancers (including leukaemias, Hodgkins lymphomas, non-Hodgkins lymphoma, myeloma)
-
Bowel cancer (including colon and rectal cancer)
-
Breast cancer (women only)
-
Gastro-oesophageal cancer
-
Lung cancer
-
Oral cancer
-
Ovarian cancer (women only)
-
Pancreatic cancer
-
Prostate cancer (men only)
-
Renal tract cancer (bladder or kidney)
-
Uterine cancer (women only).
We included cancer cases diagnosed on any of the four linked data sources (1) patients GP record (2) on their linked mortality record (3) hospital record or (4) cancer registry record. We used the earliest recorded date of cancer diagnosis on any of the four data sources as the index date.
The QResearch database is linked at individual patient level to the hospital admissions data, the Office for National Statistics mortality records and the Office for National Statistics Cancer Registry using a project specific pseudonymised National Health Service (NHS) number. The recording of NHS numbers is valid and complete for 99.8% of QResearch patients, 99.9% for ONS mortality and cancer records and 98% for hospital admissions records.12 ,13 We defined patients as having the cancer of interest if there was a record of the relevant clinical code either in their GP record, their linked hospital record, their linked mortality record or their linked cancer registry record.
We used Read codes to identify cancer cases from the GP record. We used International Classification of Diseases 10th Edition (ICD 10) clinical codes to identify cancer cases from hospital, cancer registry and mortality records except for the period of 3 years between 1 January 1998 and 31 December 2000 where ICD 9 was in use for mortality records. Web extra table 1 lists all the clinical codes used to identify each cancer outcome.
Risk factors
We examined the following predictor variables based on established risk factors for each cancer as determined in other studies14–17 or listed on the Cancer Research UK website.18 We focused on variables which are likely to be recorded in the patient's electronic record and which the patient is likely to know.
Variables tested for all outcomes
The following variables were considered for all cancer outcomes:
-
Age at baseline (continuous, ranging from 25 to 84 years)
-
BMI (continuous)
-
Smoking status (non-smoker; ex; light (1–9 cigarettes/day); moderate (10–19 cigarettes/day); heavy smoker (20+ cigarettes/day)
-
Alcohol use (none, trivial (<1 unit/day); light (1–2 units/day); moderate (3–6 units/day); heavy (7–9 units/day); very heavy (>9 units/day))
-
Townsend deprivation score (continuous)
-
Ethnic group (White/not recorded, Indian, Pakistani, Bangladeshi, Other Asian, Caribbean, Black African, Chinese, Other)
-
Type 1 diabetes
-
Type 2 diabetes
-
Manic depression or schizophrenia
-
Use of antipsychotics at baseline
-
Use of hormone replacement therapy (HRT, women) at baseline (progesterone only, oestrogen only; combined preparation; no HRT)
-
Use of oral contraceptive (women) at baseline
-
Previous diagnoses of cancer at baseline apart from the incident one under consideration recorded in the GP record. We included diagnoses of the following cancers as separate predictors for each cancer outcome—blood, bowel, brain, breast (in women), cervical (in women), gastro-oesophageal, lung, oral, ovarian (in women), pancreatic, prostate (in men), renal tract, uterine (in women).
Each type of previous cancer was considered as a separate predictor for each outcome.
Variables tested for specific cancers
Additional risk factors for individual cancer outcomes included:
-
Blood cancers: family history of blood cancers
-
Bowel cancer: family history of bowel cancer; ulcerative colitis; past colonic polyps
-
Breast cancer: family history of breast cancer; family history of gynaecological cancer; benign breast disease (fibrocystic disease, intraductal papilloma, fibroadenoma)
-
Gastro-oesophageal cancer: family history of bowel cancer; Barratt's oesophagus; peptic ulcer
-
Lung cancer: family history of lung cancer; asbestos exposure; asthma; chronic obstructive pulmonary disease
-
Ovarian cancer: family history of ovarian cancer; polycystic ovarian disease; endometriosis
-
Pancreatic cancer: chronic pancreatitis; peptic ulcer
-
Prostate cancer: family history of prostate cancer
-
Renal tract cancer: family history of renal cancer; renal stones
-
Uterine cancer: family history of gynaecological cancer; polycystic ovarian disease; endometriosis; fibroids; endometrial polyps or endometrial hyperplasia.
BMI, smoking status and alcohol use were obtained from values recorded closest to the baseline date and prior to cancer diagnosis. All other risk factors were based on the latest information recorded before entry to the cohort. Use of antipsychotic medication at baseline was defined as at least two prescriptions with the most recent one within 28 days of the date of entry to the cohort. For HRT and oral contraceptive use, the definition was at least two prescriptions with the most recent one within 6 months of the date of entry to the cohort since prescriptions are often issued for 6 months at a time.
Derivation and validation of the models
We developed and validated the risk prediction algorithms using established methods.10 ,19 ,20–22 We used multiple imputation to replace missing values for BMI, alcohol and smoking status and used these values in our main analyses.23–26 We carried out five imputations. We used Cox's proportional hazards models to estimate the coefficients for each risk factor for men and women separately, using robust variance estimates to allow for the clustering of patients within general practices. We used Rubin's rules to combine the results across the imputed data sets.27 We used fractional polynomials28 to model non-linear risk relationships with continuous variables (age, BMI, Townsend deprivation score). We fitted full models initially and retained variables if they had a hazard ratio (HR) of <0.90 or >1.10 (for binary variables) and were statistically significant at the 0.01 level. For previous diagnoses of cancer, we retained variables which were significant at the 0.05 level since some of the cancers are rare. In order to simplify the models we focused on variables for the most common conditions and medications and combined similar variables with comparable HRs where possible.
We examined interactions between predictor variables and age (focusing on family history of cancer and smoking status). We used the regression coefficients for each variable from the final model as weights which we combined with the baseline survivor function evaluated for each month up to 15 years to derive risk equations over a period of 15 years of follow-up.29 This enabled us to derive risk estimates for each year of follow-up, with a specific focus on 10-year risk estimates. We estimated the baseline survivor function based on zero values of centred continuous variables, with all binary predictor values set to zero.
Validation of the models
We used multiple imputation in the validation cohort to replace missing values for BMI, alcohol and smoking status. We carried out five imputations. We applied the risk equations for men and women obtained from the derivation cohort to the validation cohort and calculated measures of discrimination. As in previous studies,30 we calculated R2 (explained variation in time to cancer diagnosis31), D statistic32 (a measure of discrimination where higher values indicate better discrimination) and the area under the receiver operating characteristic curve (ROC statistic) at 10 years and combined these across data sets using Rubin's rules. We assessed calibration (comparing the mean predicted risks at 10 years with the observed risk by tenth of predicted risk). The observed risks were obtained using the Kaplan-Meier estimate evaluated at 10 years. We applied the algorithms to the validation cohort to define the thresholds for the 10% of patients at highest estimated risk of each cancer at 10 years.
As an additional analysis we also calculated the validation statistics on the subset of the validation cohort with no missing data for BMI, alcohol and smoking status (a complete case analysis).
We used all the available data on the database to maximise the power and also generalisability of the results. We used STATA (V.13) for all analyses.
Results
Overall study population
Overall, 753 QResearch practices in England met our inclusion criteria, of which 565 were randomly assigned to the derivation data set with the remainder assigned to a validation cohort. We identified 4 964 904 patients aged 25–84 years in the derivation cohort. We excluded 21 139 patients (0.43%) without a recorded Townsend score, leaving 4 943 765 for analysis. Table 1 shows numbers with diagnoses of each previous cancer excluded from the model for each type of cancer.
Baseline characteristics of patients in the derivation and validation cohorts aged 25–84 years
We identified 1 635 592 patients aged 25–84 years in the QResearch validation cohort. We excluded 10 796 patients (0.66%) without a recorded Townsend score, leaving 1 624 796 patients for the analysis. The numbers of patients with previous cancer diagnoses in the validation cohort are shown in table 1.
Table 1 also shows the baseline characteristics of men and women in the derivation and validation cohorts. For example, in the derivation cohort, smoking status was recorded in 94.1% of women, alcohol intake in 83.5%, ethnicity in 61.1% and BMI in 84.4%. These values were around 5% higher than recording levels in men and were similar to corresponding values for men and women in the validation cohort. As in previous studies11 ,13 the patterns of missing data supported the use of multiple imputation to replace missing values for smoking status, alcohol intake and BMI.
Incidence rates of cancer
In the derivation cohort, we identified 228 241 incident cases of the 11 types of cancer on one or more of the four linked data sources during follow-up. Of these 25 444 were blood; 32 626 were bowel; 41 315 were breast; 12 808 were gastro-oesophageal; 32 187 were lung; 4811 were oral; 6635 were ovarian; 7119 were pancreatic; 35 256 were prostate cancer; 23 091 were renal tract; 6949 were uterine.
Table 2 shows the numbers of cases and age standardised incidence rates for each cancer in women in the derivation cohort. There were a total of 110 555 cases of the 10 types of cancer in women identified on one or more of the four linked data sources (GP, hospital, mortality or cancer registry). Of these, 79 863 (72.2%) were ascertained from the GP record, 89 927 (81.3%) from the GP or linked mortality record; 105 465 (95.4%) from the GP, mortality or hospital record. The highest ascertainment rate based on the GP record alone was for breast cancer (86.8%) and the lowest was for uterine cancer (47.4%).
Numbers of incident cases, age standardised incidence rates per 10 000 person years in the derivation cohort in women aged 25–84 years
Table 3 shows the corresponding figures for men. Of the 117 686 cases of the eight cancer types in men recorded on any of the four data sources, 84 787 (72.0%) were ascertained on the GP record, 95 933 (81.5%) from the GP or linked mortality record, 111 990 (95.2%) from the GP, mortality or hospital record. Ascertainment based on the GP record alone was highest for prostate cancer (85.1%) and lowest for renal tract cancer (55.3%).
Numbers of incident cases, age standardised incidence rates per 10 000 person years in the derivation cohort in men aged 25–84 years
Predictor variables
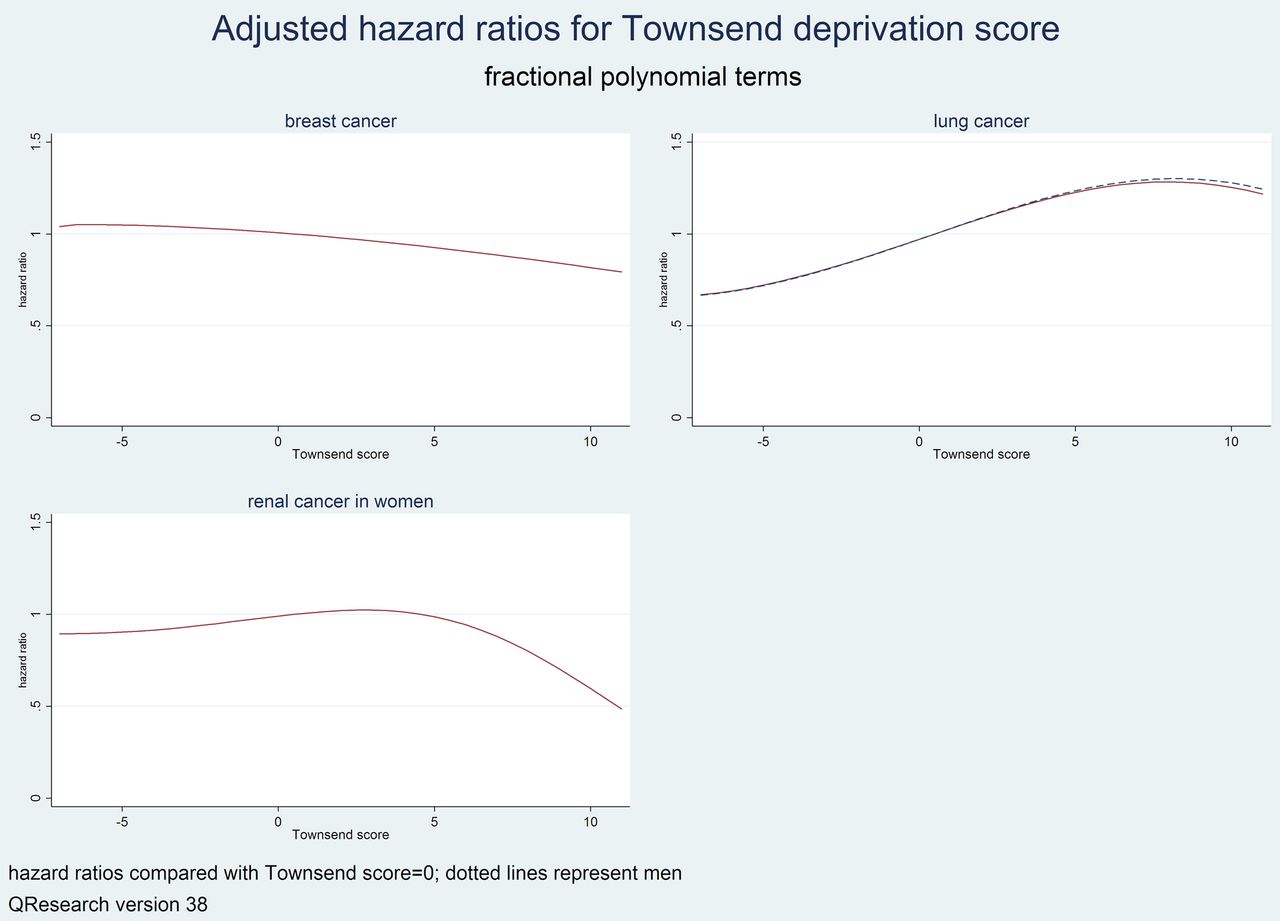
Table 4 shows the adjusted HRs for the final models for seven cancers occurring in men and women (blood, bowel, gastro-oesophageal, lung, oral, pancreas, renal tract). Table 5 shows the adjusted HRs for three cancers occurring in women (breast, ovary and uterus). Table 6 shows the adjusted HRs for prostate cancer. Figure 1 shows graphs of adjusted HRs from the fractional polynomial terms for age for each cancer. Figure 2 shows graphs of adjusted HRs from the fractional polynomial terms for BMI for each cancer. Figure 3 shows graphs of adjusted HRs for the fractional polynomial terms for Townsend deprivation score for each cancer. Figure 4 shows graphs of the adjusted HRs for the interactions between age and family history for each relevant cancer. Figure 5 show graphs of the adjusted HRs for the interactions between age and smoking status for each relevant cancer.
Adjusted HRs with 95% CIs for seven cancers which occur in men and women in the derivation cohort (blood, bowel, gastro-oesophageal, lung, oral, pancreatic and renal)
Adjusted HRs with 95% CIs for cancers occurring in women in the derivation cohort (breast, ovary, uterus)
Adjusted HRs with 95% CIs for prostate cancer in men in the derivation cohort

Showing graphs of the adjusted HRs for the fractional polynomial terms for age for each cancer.

Showing graphs of the adjusted HRs for the fractional polynomial terms for body mass index for each cancer.

Showing graphs of the adjusted HRs for fractional polynomial terms for Townsend deprivation score for each cancer.
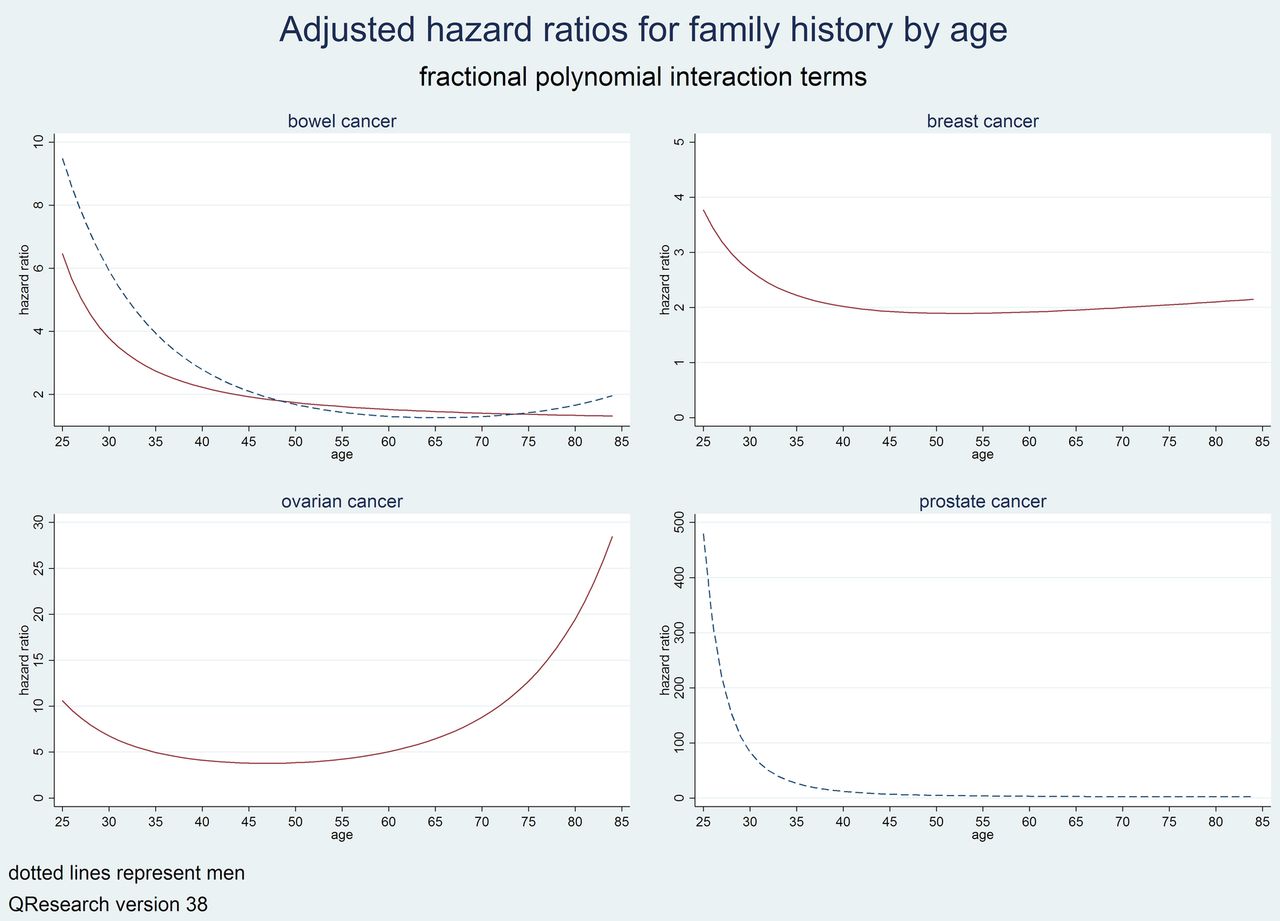
Showing graphs of the adjusted HRs for the interactions between age and family history for each relevant cancer.

Showing graphs of the adjusted HRs for the interactions between age and smoking status for each relevant cancer.
The text below describes the models for women in detail below though similar results were obtained for men as shown in the relevant tables.
Blood cancer
There were seven variables in the final model for women for blood cancer. These were age, BMI (linear), smoking status (33% higher risk in heavy smokers compared with non-smokers), type 1 diabetes (51% increased risk), family history of blood cancer (fourfold higher risk), prior brain cancer (fourfold higher risk), and prior ovarian cancer (59% increased risk). The final model for men was similar except that prior renal cancer (46% increased risk) was a predictor instead of prior brain cancer.
Bowel cancer
There were 12 variables in the final model for bowel cancer for women. These were age, ethnicity (lower risk among non-white groups), smoking status (17% higher risk in heavy smokers), alcohol (36% higher risk in heavy drinkers), family history of bowel cancer (94% higher risk at the mean age of 45), ulcerative colitis (75% higher risk), colonic polyp (twofold higher risk), type2 diabetes (16% higher risk), previous breast cancer (16% higher risk), previous ovarian cancer (98% higher risk), previous uterine cancer (61% higher risk), previous cervical cancer (74% higher risk). There was an interaction between family history of bowel cancer and age which indicated higher HRs associated with a family history in younger women compared with older women (figure 4).
The direction and magnitude of the HRs was similar for men except for there were three types of prior cancer which were significant in men but not women (lung, blood, oral). BMI and Townsend deprivation score were also included as linear terms in the model for men.
Breast cancer
There were 13 variables in the final model for breast cancer. These were age, BMI, Townsend deprivation score, ethnicity (lower risks in non-white ethnic groups), alcohol (25% higher risk in heavy drinkers compared with non-drinkers), family history of breast cancer (93% higher risk at the mean age of 45 years), benign breast disease (51% higher risk), oral contraceptive pill (13% higher risk), oestrogen containing HRT (18% higher risk), manic depression or schizophrenia (16% higher risk), previous blood cancer (57% higher risk), previous lung cancer (86% higher risk), and previous ovarian cancer (42% higher risk). Increasing deprivation was associated with a lower risk of breast cancer (figure 3). There was an interaction between family history of breast cancer and age which indicated higher HRs associated with a family history of breast cancer in younger women compared with older women (figure 4).
Gastro-oesophageal cancer
There were 12 variables in the final model for gastro-oesophageal cancer in women. The 12 variables were age, BMI, Townsend deprivation score, smoking status (2.4-fold higher risk in heavy smokers), alcohol (trivial alcohol use was associated with an 11% lower risk and very heavy drinking with a twofold increased risk compared with non-drinkers), Barratt's oesophagus (3.8-fold higher risk), peptic ulcer disease (29% higher risk), type 2 diabetes (33% higher risk), and, previous lung cancer (2.3-fold higher risk), previous blood cancer (twofold higher risk), previous breast cancer (31% higher risk), and previous oral cancer (3.8-fold higher risk).
The direction and magnitude of the HRs was similar for men except for prior cancers where prior pancreatic cancer was a significant predictor for men not women (fourfold higher risk) and prior lung and blood cancers were significant predictors in women but not in men.
Lung cancer
There were 15 variables in the final model for lung cancer in women. The 15 variables were age, BMI, Townsend deprivation score (figure 3), ethnicity (lower risk among non-white groups), smoking status, family history of lung cancer (32% higher risk), asthma (33% higher risk), chronic obstructive pulmonary disease (97% higher risk), previous blood cancer (93% higher risk), previous breast cancer (53% higher risk), previous cervical cancer (58% higher risk), previous oral cancer (2.8-fold higher risk), previous ovarian cancer (64% higher risk), previous renal cancer (74% higher risk), and previous uterine cancer (53% higher risk). There was a ‘dose response’ association for risk of lung cancer with smoking status—compared with a non-smoker: at the mean age of 45 years, there was a 5.7-fold higher risk for a light smoker; 6.6-fold higher risk for a moderate smoker and an 11-fold higher risk for a heavy smoker. There was also an interaction between smoking status and age (figure 5) such that the ‘dose response’ effect was most marked in women aged 60–70.
The direction and magnitude of the HRs was similar for men except that three additional variables reached significance and were included in the final model (alcohol, prior bowel and gastro-oesophageal cancers).
Oral cancer
There were six variables in the final model for oral cancer in women. These were age, Townsend deprivation score, smoking status (3.5-fold higher risk for heavy smokers) alcohol (4.4-fold higher risk for very heavy drinkers), previous blood cancer (4.5-fold higher risk) and previous ovarian cancer (4.1-fold higher risk).
The direction and magnitude of the HRs was similar for men except BMI, prior bowel and prior lung cancer were significant and so were included in the final model for men but not women.
Ovarian cancer
There were six variables in the final model for ovarian cancer which were age, BMI, family history of ovarian cancer (3.8-fold higher risk at the mean age of 45 years), oral contraceptive use (35% reduced risk), previous breast cancer (62% higher risk) and previous cervical cancer (60% higher risk). There was an interaction between age and family history as shown in (figure 4) with higher HRs at both extremes of age.
Pancreatic cancer
There were eight variables in the final model for pancreatic cancer in women. These were age, BMI, Townsend score, smoking status (twofold higher risk in heavy smokers), chronic pancreatitis (3.6-fold higher risk), type 2 diabetes (51% higher risk), previous breast cancer (38% higher risk) and previous renal cancer (97% higher risk).
The direction and magnitude of the HRs was similar for men except prior blood cancer reached significance and prior renal cancer did not.
Renal tract cancer
There were 11 variables in the final model for renal tract cancer in women. These were age, Townsend deprivation score, BMI, smoking status (2.4-fold higher risk in heavy smokers), type 2 diabetes (34% higher risk), previous blood cancer (63% higher risk), previous brain cancer (10-fold higher risk), previous cervical cancer (2.6-fold higher risk), previous bowel cancer (44% higher risk), previous ovarian cancer (2.6-fold higher risk), previous uterine cancer (2.1-fold higher risk). Increasing deprivation was associated with a lower risk as shown in figure 3.
The direction and magnitude of the HRs was similar for men except Townsend score was not significant. Also prior lung cancer and prostate cancer were significantly associated with increased risk of renal cancer but prior blood cancer and brain cancer were not.
Uterine cancer
There were nine variables in the final model for uterine cancer. These were age, BMI, smoking status (heavy smokers had a 34% lower risk), manic depression or schizophrenia (55% higher risk), type 2 diabetes (35% higher risk), endometrial hyperplasia or polyp (2.4-fold higher risk), polycystic ovarian syndrome (98% higher risk), previous breast cancer (2.5-fold higher risk) and previous bowel cancer (56% higher risk).
Prostate cancer
There were nine variables in the final model for prostate cancer. These were age, BMI, Townsend deprivation score, ethnicity, smoking status (reduced risks in current smokers at the mean age of 44 years), family history of prostate cancer (7.7-fold higher risk at the mean age of 44 years), manic depression/schizophrenia (36% lower risk), type 1 diabetes (43% lower risk) and type 2 diabetes (10% lower risk). There were marked differences in risk between different ethnic groups with the South Asian and Chinese men having the lowest risks and Black African and Caribbean men having the highest risks. Caribbean men had a 2.8-fold higher risk of prostate cancer than White men.
Figures 1 and 2 show the adjusted HRs for the fractional polynomial terms for age and BMI. Figure 4 shows the HRs for the interaction between age and family history of prostate cancer where HRs for family history are highest among men under the age of 30. Figure 5 shows the interaction between age and smoking status—at younger ages heavy smoking is associated with around a fourfold to fivefold increased risk of prostate cancer then the HRs decrease with advancing age.
Risk of incident cancers in patients with prior cancers
Table 7 summarises the adjusted HRs for each type of cancer associated with different types of prior cancer at baseline. For example, women with an existing diagnosis of breast cancer have a significantly increased risk of bowel cancer (16% higher), lung cancer (53% higher), pancreatic cancer (38% higher), gastro-oesophageal cancer (31% higher), ovarian cancer (62% higher) and uterine cancer (2.5-fold higher). Men with an existing diagnosis of blood cancer have a significantly increased risk of bowel cancer (53% higher), lung cancer (91% higher), oral cancer (2.3-fold higher) and pancreatic cancer (71% higher). The other associations are shown in table 7.
Summary of adjusted HRs in the derivation cohort for risk of future cancers significantly associated with prior cancers at baseline
Validation
Discrimination
Table 8 shows the performance of each algorithm in the validation cohort for women and men. The lung cancer algorithm had the highest values for all three performance measures evaluated over 10 years in men and women—the algorithm explained 64.2% of the variation in time to cancer diagnosis in women (R2), the D statistic was 2.74 and the ROC value was 0.91. Apart from breast cancer and ovarian cancer, the ROC values for all the other algorithms exceeded 0.8 in men and women.
Performance of each algorithm in the validation cohort in men and women (including patients with imputed data)
The algorithm for breast cancer had the lowest values with an R2 value of 22.0%, D statistic of 1.09 and ROC value of 0.76. The performance of the algorithm for ovarian cancer was marginally better than that for breast cancer with an R2 value of 29.1%, D statistic of 1.31 and ROC value of 0.77.
Performance of the algorithms in men was very similar to that for women. For prostate cancer, the performance was good with an R2 of 54.8%, D statistic of 2.25 and ROC value of 0.89. The algorithm for oral cancer had the lowest performance among men although the R2 was 45.8%, D statistic was 1.88 and ROC value was 0.81.
Web extra table 2 shows the performance statistics based on the 1 197 426 (73.7%) of patients in the validation cohort with complete data for BMI, smoking status and alcohol use rather than using imputed values for missing data. The results are similar though the absolute values tend to be marginally lower than the analyses based on imputed data.
Thresholds
Table 9 shows the classification statistics of each algorithm in the full validation cohort for the 10% of women at highest predicted risk of each cancer. For example, for the 10% of women at highest predicted risk of lung cancer (ie, those with a 10-year predicted risk score of 1.43% or higher), the sensitivity was 67.3% and the observed risk at 10 years was 3.9%. For breast cancer, the corresponding sensitivity was 27.5% with an observed risk of 4.4% at 10 years for the top 10% of women at highest predicted risk. Table 10 shows the corresponding results for men. For prostate cancer, for the top 10% of men at highest predicted risk (a 10-year predicted risk score of 5.89% or higher) the sensitivity was 56% and the observed risk at 10 years was 8.4%.
Classification statistics for each algorithm in the validation cohort based on the top 10% of patients at highest predicted risk of each cancer in women
Classification statistics for each algorithm in the validation cohort based on the top 10% of patients at highest predicted risk of each cancer in men
Calibration
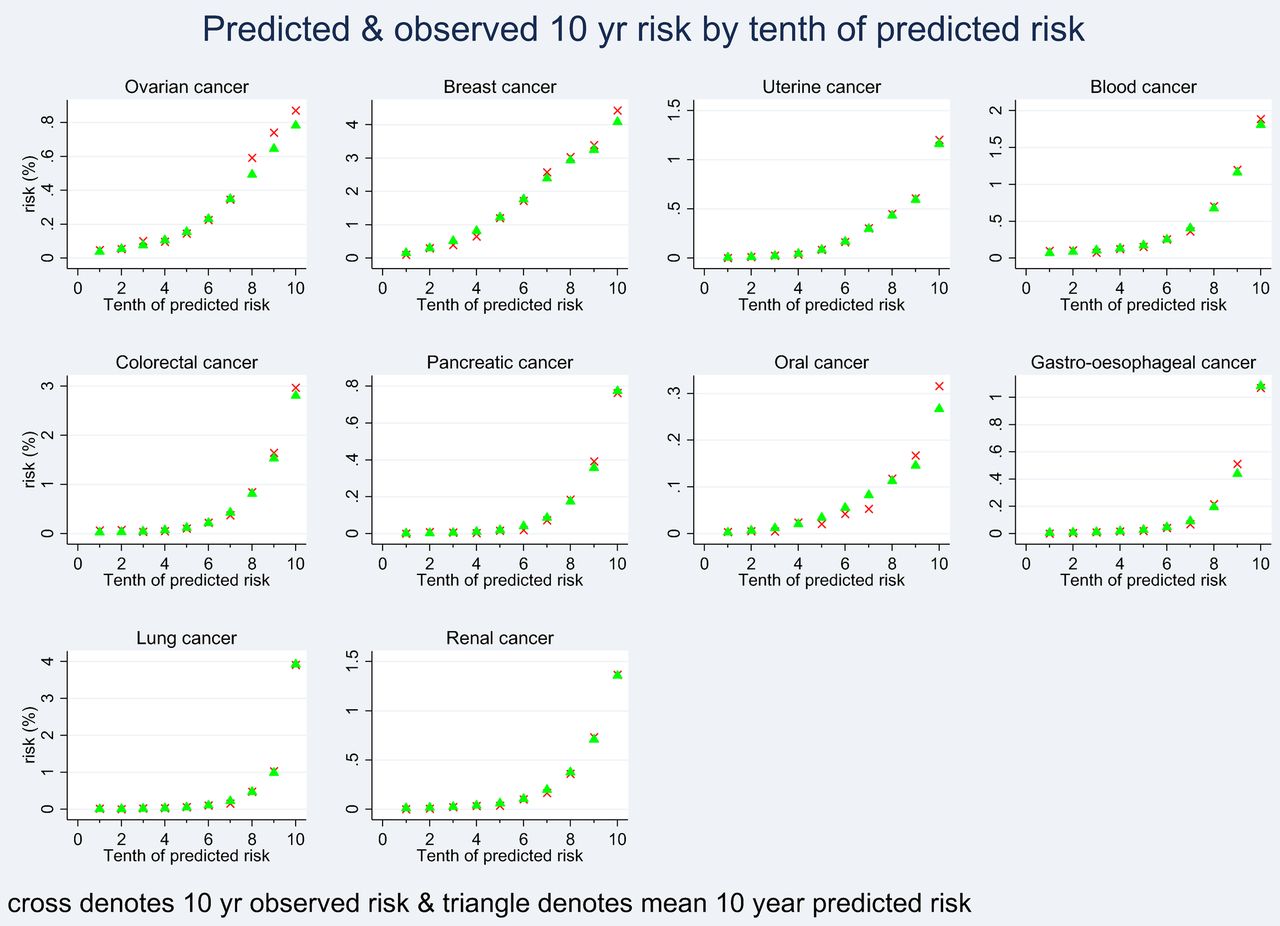
Figure 6 shows the mean predicted risks and the observed risks at 10 years within each tenth of predicted risk in order to assess the calibration of the model in women in the validation cohort. Figure 7 shows the corresponding calibration graph for men. There was close correspondence between the mean predicted risks and the observed risks within each model tenth in women and men indicating that the algorithms were well calibrated.

Showing the mean predicted risks and observed risks at 10 years by tenth of predicted risk applying each algorithm to all women in the validation cohort.

Showing the mean predicted risks and observed risks at 10 years by tenth of predicted risk applying each algorithm to all men in the validation cohort.
Figure 8 shows the web calculator for an example patient which is a 64-year-old man who is a heavy smoker, has type 2 diabetes and a family history of bowel cancer. His 10-year predicted risks of the following cancers are: blood cancer (2%) bowel cancer (5.8%), gastro-oesophageal cancer (3.3%) lung cancer (9.4%), oral cancer (2%), renal cancer (4.6%), pancreatic cancer (1.3%), prostate cancer (3.9%).

Showing the web calculator for an example patient.
Discussion
Summary of key findings
We have developed and validated a series of risk prediction algorithms—collectively known as the QCancer 10 year risk algorithms—to quantify future absolute risk of 10 common cancers in women and eight common cancers in men. The algorithms incorporate predictor variables which are associated with risk of cancer including sociodemographic variables, lifestyle, morbidity, medications, family history and previous diagnoses of other cancers. The algorithms can be applied to any adult aged 25–84 years in a primary care setting regardless of whether they have had a prior cancer. For nine of the 11 cancers, the ROC values exceeded 0.8 which is generally considered to be very good. For two of the cancers in women (breast and ovarian) the ROC values were lower at 0.76 and 0.77 though this is still considered acceptable.
The QCancer 10 year risk algorithms are designed to quantify future risk of cancer and differ from the existing QCancer algorithms3–10 which combine symptoms such as appetite loss and abdominal pain with risk factors to quantity the absolute risk that a patient has an existing cancer as yet undiagnosed to help inform the decision for further diagnostic tests. These algorithms to predict existing cancer are designed to be used when patients present with symptoms that might be indicative of cancer.
Comparisons with the literature
We included established predictor variables in our analysis and found that our HRs were similar in magnitude and direction to those reported in other studies. This increases the clinical face validity of the variables included as predictors in the final algorithms. We have summarised the key relationships below from the perspective of the relevant set of risk factors (rather than by each cancer as described in our results section above).
Smoking and cancer risk
We found that smoking was associated with a significantly increased risk of seven cancers (blood, bowel,33 gastro-oesophageal,34 ,35 lung,36 oral,37 pancreatic38 ,39 and renal tract18) with some evidence of a ‘dose response’ relationship with higher levels of smoking associated with higher levels of risk. Smoking was associated with a decreased risk of uterine cancer which is consistent with other studies.40 We found no significant association between smoking and ovarian or breast cancer. We found an interaction between age and smoking for risk of prostate cancer. At younger ages heavy smoking is associated with around a fourfold to fivefold increased risk of prostate cancer then the HRs decrease with advancing age.
Alcohol and cancer risk
Alcohol intake was associated with an increased risk of four cancers (oral,41 breast41 ,42 bowel,41 gastro-oesophageal34 ,41 ,43) with a tendency for higher volumes of alcohol consumption to be associated with higher levels of cancer risk. We found no significant association between alcohol and lung cancer in women but there was an association for men.
Family history and cancer risk
Family history was associated with a higher risk of six cancers (prostate,44 breast45 ,46 bowel47 ,48 blood, lung49 and ovarian cancer50 ,51). The magnitude of the risk of ovarian cancer associated with a family history of ovarian cancer in this study was 3.8 fold higher at the mean age which is similar to the threefold to fourfold higher risk reported elsewhere.50 ,51
Hormonal treatments and cancer risk
There was a small increased risk of breast cancer with oral contraceptive use52 and oestrogen containing HRT.53 ,54 There was a decreased risk of ovarian cancer associated with use of oral contraceptives in line with other studies.55 ,56 There was no clear association between use of the oral contraceptive pill or HRT for the remaining cancers.
Comorbidities and cancer risk
Ulcerative colitis and previous colonic polyps were associated with a higher risk of bowel cancer.57 ,58 Barratt's oesophagus was associated with a fourfold higher risk of gastro-oesophageal cancer. This is consistent with, but lower than the 11-fold increase in risk of adenocarcinoma of the oesophagus.59 Chronic pancreatitis was associated with a higher risk of pancreatic cancer.60 We found a higher risk of breast cancer among patients with benign breast disease.61 Manic depression or schizophrenia was associated with a higher risk of uterine cancer and a marginal higher risk of breast cancer and a reduced risk of prostate cancer.62 There was a twofold higher risk of uterine cancer with polycystic ovarian disease in line with other studies.63
Diabetes and cancer risk
Type 1 diabetes was associated with a higher risk of blood cancer. Type 2 diabetes was associated with a higher risk of five cancers (bowel,64–67 gastro-oesophageal,68 pancreatic,69 ,70 renal tract69 and uterine cancer69 ,71). Both type 1 and type 2 diabetes were associated with a reduced risk of prostate cancer in line with previous studies.72 ,73
Ethnicity and cancer risk
Ethnic groups other than the white/not recorded group tended to be associated with decreased risk of three cancers (breast cancer, bowel cancer, lung cancer) which is consistent with other studies.74 We found no significant association between ethnicity and risk of the other cancers included in our study except for prostate cancer where black African and Caribbean men had significantly higher risks compared with white men, and South Asian and Chinese men had significantly lower risks. This is consistent with other studies examining risk of prostate cancer among different ethnic groups.75
Prior cancers
We have identified and quantified a number of associations between previous cancers and risk of future cancer by cancer type. We think our findings have reasonable face validity as they are consistent with those reported elsewhere76 ,77 and we have been able to adjust for potential confounding variables. For example, we found that a previous diagnosis of lung cancer in men was associated with an increased risk of three cancers (oral, bowel and renal tract).77 Also, we found that a previous diagnosis of blood cancer in women was associated with an increased risk of five cancers (lung, oral, renal tract, gastro-oesophageal and breast cancer).77 ,78 Similarly we found that prior breast cancer was associated with an increased risk of six cancers (uterine, bowel, lung, pancreatic, gastro-oesophageal and ovarian cancer76 ,77). We found that prior ovarian cancer was associated with an increased risk of five cancers (bowel, lung, oral, renal tract and breast). Some of the associations between prior cancer and risk of future cancer may reflect common aetiologies between different cancers not fully adjusted for in our multivariate model (eg, lifestyle factors or genetic predisposition). Alternatively some may represent secondary cancers directly related to the first but which have not been correctly coded as metastases. It is important to note that apparent lack of associations between some types of prior cancer and future cancer may reflect small numbers especially where specific cancers are rare and/or have a poor 5-year survival (such as pancreatic cancer). Additional research would be needed to determine the potential utility of enhanced screening among patients with an existing malignancy who are at increased risk of a second primary cancer.
Thresholds
Generally we envisage that cancer risk prediction values would be kept continuous for assessment of an individual although at some point there needs to be a cut-off if a clinician is going to take action for an individual patient. At national level, policymakers and commissioners tend to make recommendations around absolute thresholds to ensure equitable access and consistent management across a health community. This is already common place for cardiovascular disease risk where the latest National Institute for Health and Care Excellence (NICE) guidelines from 2014 recommend treatment with statins for patients with a 10-year cardiovascular disease risk above 10%.79 However, in this paper, we have not provided definite comment on what threshold of absolute risk should be used to define ‘high risk’ since that would require (1) consideration of the balance of risk/benefit for an individual and their choice and (2) cost-effectiveness analyses which are outside the scope of this study. We have, however, provided analyses using the top 10% of absolute risk as a threshold of risk which can be used to help inform future analyses. Sensitivity is important as it is a measure of how well the algorithm performs in finding cases that might be suitable for intervention. If the risk threshold is set too high, then the sensitivity will be low and a large number of patients at increased risk of cancer will be ‘missed’ by the algorithm. Although a high-risk threshold is likely to result in a higher positive predictive value which means a higher proportion of those identified are likely to go on to develop cancer over the next 10 years. A lower risk threshold would have higher sensitivity but could lead to unnecessary interventions and anxiety in people who will not develop cancer over 10 years. So, at the population level, there is a balance to be struck between the sensitivity and positive predictive value of the score which depends on the risk threshold selected, resources available; likely risks and benefits of the interventions and the chance that patients might become anxious about being classified as ‘high risk’.
Methodological considerations
The methods to derive and validate these models are the same as for a range of other clinical risk prediction tools derived from the QResearch database.19 ,80–83 The strengths and limitations of the approach have already been discussed in detail21 ,80 ,83–86 including information on multiple imputation of missing data. In summary, key strengths include size, duration of follow-up, representativeness, and lack of selection, recall and respondent bias. UK general practices have good levels of accuracy and completeness in recording clinical diagnoses and prescribed medications.87 We think our study has good face validity since it has been conducted in the setting where the majority of patients in the UK are assessed, treated and followed up. Our database has linked hospital, mortality and cancer records for nearly all patients and is therefore likely to have picked up the majority of cancer diagnoses thereby minimising ascertainment bias. We excluded patients without a valid deprivation score since this group may represent a more transient population where follow-up could be unreliable or unrepresentative. Their deprivation scores are unlikely to be missing at random so we did not think it would be appropriate to impute them.
The present validation has been carried out on a completely separate set of practices and individuals to those which were used to develop the score although the practices all use the same GP clinical computer system (EMIS—the computer system used by 55% of UK GPs). An independent validation study would be a more stringent test and should be carried out, but when such independent studies have examined other risk algorithms,85 ,86 ,88 ,89 they have demonstrated comparable performance compared with the validation in the QResearch database.19 ,80 ,84 We (or another academic team) intend to conduct a separate validation on an independent database using a different clinical system (CPRD) as part of a separate project.
Other limitations of our study include the lack of formal adjudication of cancer diagnoses, information bias, and potential for bias due to missing data. However, we think our ascertainment of cancer is likely to be high given the combination of the four data sources and the similarity between our rates and those published by the Office for National Statistics.11 While we acknowledge that there may be discrepancies between self-reported features (such as number of cigarettes smoked), the information recorded on the GP record has a face validity as it is still predictive of relevant outcomes, exhibits a ‘dose-response’ relationships (with higher doses being associated with increased cancer risks) and similar to HRs from the published literature as we describe above. We have also only based behavioural variables (for smoking and alcohol) on a simple assessment of current exposure rather than more complex measures reliant on recall of past exposure which would be less reliable.
We measured family history of cancer based on information which may have been recorded opportunistically rather than systematically. Patients with a positive family history of cancer may be more likely to report this to their GP and for this to be recorded and we have assumed that where no positive family history is recorded then the patients has a negative family history which will lead to some misclassification. Also, there is no Read code to record family history of some types of cancer (eg, pancreatic cancer) so we were unable to include this in our list of predictor variables as this information is not captured in coded form and available on the QResearch database. Overall, the recording of family history is therefore likely to be subject to both ascertainment and recording bias. However, it is likely that the recording of family history will improve over time particularly if (1) clinicians can be prompted to ask for this information by the use of structured clinical templates which can be offered to the clinician for use during the consultation or if (2) patients can record this information directly once they are able to access their medical record electronically.
Genetic information is likely to be important in a full assessment of cancer risk although the information is not currently routinely recorded in electronic health records. Genetic information cannot therefore be used either to derive or validate a new score using large representative UK clinical databases. The lack of routinely available genetic results would also cause practical problems in implementing a tool dependent on such variables into clinical practice. Previous studies examining the benefits of adding genetic variations to risk assessment tools have shown only modest improvements in the predictive power. For example adding genetic variant information to the Gail Breast Cancer Risk assessment tool only increased the ROC value from 0.58 to 0.62.90 The ROC value for the breast cancer algorithm based on clinical data in our study was 0.76 which is significantly higher than the ROC value of 0.62 reported for the generic variant of the Gail model.90
A recent study by Tomasetti et al 91 concluded that “only a third of the variation in cancer risk among tissues is attributable to environmental factors or inherited predispositions. The majority is due to ‘bad luck’, that is, random mutations arising during DNA replication in normal, noncancerous stem cells”. Our study focuses on methods to predict absolute risk of cancer taking account of the individual's age, sex, ethnicity, lifestyle, family history and comorbidities. We found that our models explained well over 33% of the variation in cancer risk for 9 of the 11 cancers studied as shown by the R2 values presented in table 8. This would tend to refute the hypothesis by Tomasetti et al 91 that only a third of the variation in cancer risk among tissues is attributable to environmental factors or inherited predispositions with the remainder being due to random mutations for the majority of cancers. However, our models only explained 22% of the variation for breast cancer and 29% for ovarian cancer which would support it.
The prediction models in our study have been derived from routinely recorded electronic health data using variables which are accessible in everyday practice in order that they can be applied in real world clinical settings to identify high-risk patients for further screening or prevention. Overall the validation statistics indicate that performance of all the algorithms is either good (breast, oral and ovarian cancers have ROC values 0.76–0.79); very good (blood, bowel, gastro-oesophageal, pancreas prostate, renal, uterine cancers have ROC values of 0.80 to 0.89) or excellent (lung cancer has an ROC value >0.9). Our prediction models have included clinical and lifestyle variables (such as age/sex/ethnicity/coexisting illnesses/smoking/alcohol and medication). They also include family history which was a significant predictor for six cancers (prostate, breast, bowel, blood, lung, ovarian). While there is clearly a difference between family history information and a genetic sample, family history does reflect genetic factors and is routinely recorded in general practice settings. It would be impractical, both from a cost and governance perspective to undertake genetic tests on all patients so that this information could be included in derivation of the models. It would also be impractical to require genetic information to be available routinely for when the scores are applied. It would be possible, however, to use the QCancer 10 year risk tool to identify a subset of high-risk patients for whom further genetic testing might be warranted and to quantify the level of absolute risk to help inform patient choice.
The QCancer 10 year risk algorithms have been developed using linked data from general practices in England and some of them (breast, gastro-oesophageal, lung, oral, pancreatic, prostate and renal tract) include a postcode related deprivation score (Townsend score). We included the Townsend score in the algorithms since there were clear relationships between deprivation and risk of some cancers which is captured by this variable. If we omitted it, it would tend to under-estimate cancer risk in patients from deprived areas for most cancers except breast cancer and renal cancer in women and prostate cancer in men, where the risk may be slightly over-estimated. In terms of international use of these algorithms where the Townsend score is not available a locally relevant deprivation score could be constructed or adapted for the relevant country to have a range between −7 (most affluent) and +11 (most deprived) to correspond to the range of Townsend scores which could be used instead (subject to local validation). For other predictor variables such as age, smoking, alcohol, family history, prior cancer, then we have compared the magnitude of the HRs to other international studies and found them to be similar in direction and magnitude (see Comparison with literature). This would tend to support the utility and face validity of the algorithms outside the UK although best practice would be that they are externally and independently validated in the settings where they would be used to ensure they are appropriately calibrated and have good discrimination.
Lastly changes in environmental factors may occur over time and this underlines the need to update the prediction algorithms on an ongoing basis as has been carried out with QRISK292 cardiovascular score and other related prediction scores.93 Regular updates, with a moving time window, will also help ensure that the algorithms will benefit from improvements in the scope and quality of the underlying database which is likely to occur over time. This is an important strength of using routine databases for the development of risk prediction algorithms that is not feasible with prospective study cohorts that are assembled at one point in time.
Clinical implications
The algorithms have been designed to work in a primary care setting, making use of information which is already recorded on the GP clinical computer system. The algorithms can be integrated into the clinical computer system alongside similar algorithms which already quantify risk of other clinical conditions in everyday clinical practice such as QRISK2,19 QDiabetes,80 QStroke,94 QFracture,81 QThrombosis,83 QBleed95 and QAdmissions.12 They can be used in ‘batch process’ mode to generate a list of patients at high risk of each cancer for further assessment or they could be used within the consultation. For example, policy makers and commissioners are likely to want to use the tumour site specific algorithms in ‘batch mode’ to risk stratify populations to better target screening programmes.
To indicate the potential value of using the QCancer tool for identifying a high-risk population for screening compared to an approach based on risk factors alone, we calculated the sensitivity and predictive values for lung cancer in heavy and moderate smokers. In the validation data set for women there were 3007 lung cancer cases over 10 years, and 812 occurred in moderate/heavy smokers (9.3% of cohort) giving a sensitivity of 27%, this contrasts with a sensitivity of 67% for the top 10% of women at highest predicted risk of lung cancer using the QCancer score (table 9). In men the corresponding sensitivity values are 22% in moderate/heavy smokers compared with 67% using QCancer (table 10). So QCancer is better at identifying future lung cancer cases than an approach targeting moderate/heavy smokers would be. Further work would be needed to determine any risk thresholds for screening, which as we state in the paper would require cost-effectiveness analyses which are outside the scope of this study and consideration of available resources and impacts on patients.
The algorithms could help inform the discussions between doctor and patient within the consultation regarding the future risk of cancer associated with existing diagnoses (such as the risk of bowel cancer among patients with ulcerative colitis); prior cancers (which might indicate an increased risk of a second primary cancer); family history of cancer (where additional screening may be justified) or lifestyle related variables (such as BMI, smoking and alcohol intake which can be moderated). For example, the doctor could use the algorithms to assess the patient's 10 year risk of cancer to highlight the higher risk associated with heavy or moderate smoking compared with that for lighter smokers or ex-smokers. Currently there is no easy to use widely available calculator, such as that described in this paper, which will allow a patient to quantify their absolute risk of getting different types of cancer taking account of their age, sex, family history and other risk factors such as alcohol consumption and smoking status. While identifying effective interventions to reduce alcohol intake or increase smoking cessation remains a challenge, there is evidence96 that physician advice has some effect on smoking cessation rates albeit small and that brief alcohol interventions in primary care populations can reduce alcohol consumption.97 It is possible that providing patients with information on how these factors influence their personal cancer risk might have an additional impact on smoking and alcohol consumption. There is also some evidence to support the use of biomedical risk assessment feedback such as ‘lung age’ to increase rates of smoking cessation98 which suggests that patients may respond to information presented in an accessible format.
As another example, the doctor and patient could also review treatments such as the use of HRT in a woman at higher risk of breast cancer due to other factors such as family history. However, if a patient presents with potential symptoms of cancer such as appetite loss or haematuria the existing QCancer scores we developed previously3–10 would be more suitable for assessing current cancer risk and informing decisions regarding further investigation and referral.
Conclusion
We have developed and validated a new set of risk prediction models which quantify the absolute risk of 11 common cancers in men and women. They can be used to identify patients at high risk of cancers for prevention or further assessment. Following external validation and cost-effectiveness assessments, the algorithms could be integrated into GP clinical computer systems and used to identify high-risk patients for prevention and screening.
Acknowledgments
The authors acknowledge the contribution of EMIS practices who contribute to the QResearch and EMIS for expertise in establishing, developing and supporting the database.
References
Supplementary materials
Supplementary Data
This web only file has been produced by the BMJ Publishing Group from an electronic file supplied by the author(s) and has not been edited for content.
Files in this Data Supplement:
- Data supplement 1 - Online table 1
- Data supplement 2 - Online table 2
Footnotes
-
Twitter Follow Julia Hippisley-Cox at @juliahcox
-
Contributors JH-C initiated the study, undertook the literature review, data extraction, data manipulation and primary data analysis and wrote the first draft of the paper. CC contributed to the design, analysis, interpretation and drafting of the paper. JH-C is the guarantor. Both authors agreed the final version of the paper.
-
Competing interests JHC is professor of clinical epidemiology at the University of Nottingham and codirector of QResearch—a not-for-profit organisation which is a joint partnership between the University of Nottingham and Egton Medical Information Systems (leading commercial supplier of IT for 60% of general practices in the UK). JHC is also a paid director of ClinRisk Ltd which produces open and closed source software to ensure the reliable and updatable implementation of clinical risk algorithms within clinical computer systems to help improve patient care. CC is associate professor of Medical Statistics at the University of Nottingham and a paid consultant statistician for ClinRisk Ltd. This work and any views expressed within it are solely those of the coauthors and not of any affiliated bodies or organisations.
-
Ethics approval The project was reviewed in accordance with the QResearch agreement with Trent Multi-Centre Ethics Committee [reference 03/4/021].
-
Provenance and peer review Not commissioned; externally peer reviewed.
-
Data sharing statement The algorithms presented in this paper will be released as Open Source Software under the GNU lesser GPL v3. The open source software allows use without charge under the terms of the GNU lesser public license V.3. Closed source software can be licensed at a fee. No additional data is available.