Article Text

Abstract
Objectives To distinguish between variation in referral threshold and variation in accurate selection of patients for referral in fast-track referrals for possible cancer. To examine factors associated with threshold and accuracy and model the effects of changing thresholds.
Design Analysis of national data on cancer referrals from general practices in England over a 5-year period. We developed a new method to estimate specificity of referral to complement existing sensitivity. We used bivariate meta-analysis to produce summary measures and described practices in relation to these.
Setting 5479 general practitioner (GP) practices with data relating to more than 50 cancer cases diagnosed over the 5 years.
Outcomes Number of practices whose 95% confidence regions for sensitivity and specificity indicated that they were outliers in terms of either referral threshold or decision accuracy.
Results 2019 practices (36.8%) were outliers in relation to referral threshold compared with 1205 practices (22%) in relation to decision accuracy. Practice age profile, cancer incidence and deprivation showed a modest association with decision accuracy but not with thresholds. If all practices shared the referral behaviour of those in the highest quintile of age-standardised referral rate, there would be a 3.3% increase in cancers detected through fast-track pathways at the cost of a 36.9% increase in urgent referrals.
Conclusion This new method permits variation in referral to be described more precisely and quality improvement activities to be targeted. Changing referral thresholds without increasing accuracy will result in modest effects on detection rates and a large increase in demand on diagnostic services.
- cancer
- general practice
- primary care
- referral
- variation
- bivariate meta-analysis
This is an Open Access article distributed in accordance with the Creative Commons Attribution Non Commercial (CC BY-NC 4.0) license, which permits others to distribute, remix, adapt, build upon this work non-commercially, and license their derivative works on different terms, provided the original work is properly cited and the use is non-commercial. See: http://creativecommons.org/licenses/by-nc/4.0/
Statistics from Altmetric.com
Strengths and limitations of this study
This is the first study to distinguish variation in primary care referral threshold from variation in referral decision accuracy.
We used published data on the prevalence of cancer in patients consulting with symptoms to estimate specificity for fast-track referral for suspected cancer for each general practitioner practice in England and carried out sensitivity analysis to test for robustness of the model.
Limited data and the problems of random variation in cancer presentation made our method unsuitable for smaller practices with less than 50 cancer diagnoses over a 5-year period.
We compared practices using bivariate meta-analysis in order to identify overall patterns and to set confidence regions for individual practices and identify outliers.
We show that this method can be used to model the influence of changing referral thresholds on demand for specialist services (which is currently not known).
Introduction
Variation in the referral of patients with possible cancer from primary care is a key concern for healthcare systems1 2 and has led to national and international initiatives to reduce it. These have included the development of guidelines3 and fast-track pathways4 for referral—the Two Week Wait referral scheme in England and the Urgent Suspected Cancer pathway in Scotland. A number of studies have reported on the use of audit and feedback of practice performance in the use of these pathways5–8; although fast-track pathways have increased the number of patients referred urgently4 and may have increased the number of patients diagnosed earlier,9 the resource implications are hard to estimate.10
Despite the presence of guidelines and pathways, the early detection of cancer in primary care can be a difficult task. Variation in cancer referrals may arise from three sources: random variation in the cases presenting to the practice,7 variation in referral threshold11 and variation in the accurate selection of patients for referral.9 Random variation in cases reflects the fact that some cancer presentations are more likely to match the guidelines for fast-track referrals than others and so are more likely to be referred. We have previously demonstrated that this accounts for some of the observed practice variation but does not explain it all.7 The impact of this variation is reduced as the number of referrals and cancers available for analysis increases. Referral threshold refers to the probability of disease (such as cancer) at which a clinician is indifferent between referring versus not referring a patient.12 Variation in referral threshold occurs when practices differ in the way they interpret and apply referral guidelines.13 Typically, it relates to tolerance of risk and uncertainty: risk-averse clinicians and services have lower referral thresholds (and so higher referral rates) than risk-tolerant ones. Variation in the accurate selection of patients for referral, for a given referral threshold, may arise because of differences in clinical acumen or in available time and resources with which to make accurate judgements.
The decision to refer is analogous to a diagnostic test, in which the test’s ability to discriminate between patients with and without a condition is measured in terms of sensitivity and specificity. In our analysis, the discrimination is between patients who were, or were not, referred to a fast-track pathway for suspected cancer. Hence for a conventional 2×2 table of diagnostic test accuracy, true positives represent patients referred via the fast-track who were subsequently diagnosed with cancer; false positives are patients referred who did not have cancer; false negatives are patients with cancer but who were not referred via fast-track (they may have had emergency admission or non-urgent referral); and true negatives are patients without cancer who were not referred.
In this context, sensitivity represents the proportion of all patients with cancer who had been selected for referral via the fast-track pathway. Sensitivity has been previously reported in relation to cancer referrals5 6 9 where it has been called detection rate. Specificity represents the proportion of patients without cancer who were not referred. Specificity has not been reported before in relation to referral. Sensitivity and specificity can be used together to describe variation between practices in threshold and accuracy. Variation in thresholds leads to differences in specificity for a given sensitivity. A high threshold leads to a low referral rate and is indicated by high specificity; in contrast, a low threshold leads to a high referral rate and is indicated by low specificity. If accuracy is the same in all practices and only threshold varies, then high threshold practices will identify fewer cases, but refer relatively few patients, while low threshold practices will identify more cases, simply as a result of making more referrals. Variation in accuracy leads to differences in the proportion of cases diagnosed via the fast-track pathway for a given referral rate (or more accurately, variation in sensitivity for a given specificity). A practice with high accuracy will have a high sensitivity relative to its specificity, while a practice with low accuracy will have a low sensitivity relative to its specificity.
In order to distinguish between variation in threshold and variation in selection accuracy, we developed a method for calculating the specificity of fast-track referrals for possible cancer by each practice. We then compared practices’ sensitivity and specificity using bivariate meta-analysis14 and examined the practice factors associated with referral thresholds and selection accuracy. Finally, we modelled the implications of changing referral thresholds on demand for specialist services.
Methods
We conducted an analysis of publicly available data. The data contained no individual patient information and no ethical permissions were needed.
Data sources
We obtained data from the English National Cancer Intelligence Network (NCIN) (now hosted by Public Health England) for each year from 2010 (the first year for which data are available) to 2014. We extracted the data for each practice-year. Data were available for general practices (groups of between 2 and 30 general practitioners (GPs)) rather than individual physicians. For cancer referral and diagnosis, we extracted the total number of cancer diagnoses; total number of fast-track referrals for possible cancer and the number of cancers diagnosed through the fast-track referral pathway. For each practice, we also extracted data on new cancer incidence rate, proportion of patients aged over 65 years, proportion of patients whose postcode was in a socioeconomically deprived area, list size (number of registered patients) and age-standardised fast-track referral rate.
Data aggregation
We aggregated data from each practice to provide one measure for the 5-year period in order to reduce the effects of random variation in cancer type and presentation.7 As the data did not include values for number of cancer diagnoses or urgent referrals for suspected cancer where there were less than six in a year, we excluded all such practice-years from the aggregation. For counts (numbers of cancer cases and referrals), we calculated the sum overall years and for practice variables, we calculated an unweighted mean. For the primary analysis, we restricted eligibility to practices with at least 50 included cancers during the 5-year period to reduce the effects of chance variation.7
Calculation of sensitivity and specificity
In order to calculate individual practice sensitivity and specificity, we used the aggregated 5-year data to construct contingency tables describing the total ‘population at risk’ of fast-track referral in terms of two dimensions: cancer/no cancer and fast-track referral/no fast-track referral. We used the NCIN data to complete the cells of the contingency table for each practice as follows: true positive: patients with cancer who had been referred via the fast-track pathway; false negative: patients with cancer who were not referred via the fast-track pathway and false positive; patients without cancer who had been referred via the fast-track pathway. These were directly taken from the published data. For the true negatives, we estimated values based on studies showing that for many symptoms potentially indicative of cancer and presented to a GP only 1%–5% of people with the symptom will turn out to have cancer.3 15 We thus calculated the practice population with symptoms potentially indicative of cancer as the reciprocal of a given prevalence rate multiplied by the total number of cancers in the practice. We carried out the primary analysis with an assumed cancer prevalence rate of 3% and conducted a sensitivity analysis to test for the effect of varying both this assumption and the lower limit of number of cancers over the 5 years for inclusion (further details in online supplementary material 1).
Assessment of practice variation
We conducted bivariate meta-analysis following the approach described by Reitsma.16 We used this to generate summary measures of sensitivity and specificity (with confidence region) for the whole population of practices and a hierarchical summary receiver operating characteristic (ROC) curve (HSROC).17 We also generated 95% confidence regions for the sensitivity and specificity18 of each individual practice. We conducted the analysis using a random effects model with maximum likelihood fitting using the mada package in R.19 We then used the relative positions of practices in relation to the HSROC curve to describe the different sources of variation as follows:
Variation in referral threshold
We examined referral threshold variation by comparing the position of practices relative to the summary point (for sensitivity and specificity) and the HSROC curve. We took this approach because the heterogeneity of symptoms presentations of possible cancer precluded calculation of a single referral threshold for each practice. Instead, as threshold is mathematically related to the slope of the ROC curve, we considered variation in threshold in terms of the relative position along the HSROC curve for a prespecified probability of cancer. A practice lying further to the left would indicate a higher threshold, and one lying further to the right indicating a lower threshold. As not all practices sat on the HSROC curve, we classified practices as outliers for referral decision threshold if the 95% confidence regions for that practice did not cross a line perpendicular to the HSROC curve at the summary point.
Variation in referral selection accuracy
We defined accuracy in relation to the HSROC curve. Specifically, we classified practices as outliers for referral selection accuracy if the 95% confidence regions for sensitivity and specificity for that practice lay wholly above or below the HSROC curve.
From these two sources of variation, we classified practices as high, low or unremarkable in relation to both referral selection accuracy and referral threshold.
Factors associated with variation in referral threshold and selection accuracy
We divided practices into quintiles of variables taken from the data: proportion of patients aged 65 or over, incidence rate of all cancers within the practice population, proportion of patients living in areas of socioeconomic deprivation, practice list size (number of registered patients) and age-standardised urgent referral rate. For each quintile, we estimated the summary sensitivity and specificity with 95% confidence intervals. We also compared the proportion of practices which were outliers for referral thresholds or selection accuracy across the same quintiles by calculating ORs compared with the middle (third) quintile.
Modelling the effect of changing referral patterns
Finally, reflecting recent recommendations that practices with low rates of fast-track referral for suspected cancer should increase them,9 we modelled the effect of changing the behaviour practices within one quintile of age-standardised fast-track referral rate to that of a different quintile. We described these effects in terms of changes to the number of patients who would be referred through fast-track suspected cancer pathways, and the number of cancers diagnosed via this route. We used the summary values of sensitivity and specificity for each quintile to estimate the number of patients in each cell of a contingency table using a hypothetical population including 1000 cancers using the same prevalence rate as the main analysis. The detailed method for modelling the data is described in online supplementary material 2.
Results
The available data included 7630 practices from 211 PCOs (in 2014) representing almost the entire population of England over 5 years. Of these, 2151 had data on less than 50 cancers over the 5-year period and so were excluded. This left 5479 practices (73.9%) representing 46 271 734 patients (85.4%) and 1 080 187 new cancers. Practice characteristics are shown in table 1. The proportion of patients aged over 65 years and cancer incidence rate within practices were strongly correlated (Spearman rho=0.82), all other practice variables had correlations of less than 0.20.
Characteristics of included practices (n=5479)
Assessment of practice variation
Summary sensitivity and specificity in the primary analysis were 47.4% (95% CI 47.2 to 47.5) and 87.8% (87.7 to 88.0) respectively. Online supplementary table ST1 shows the summary sensitivity and specificity under the different assumptions for lower limit of practice size for inclusion and assumed prevalence of cancer in symptomatic patients. Figure 1 shows the distribution of individual practice sensitivity and specificity in relation to the overall HSROC highlighting outliers in relation to referral threshold (figure 1A) and selection accuracy (figure 1B).

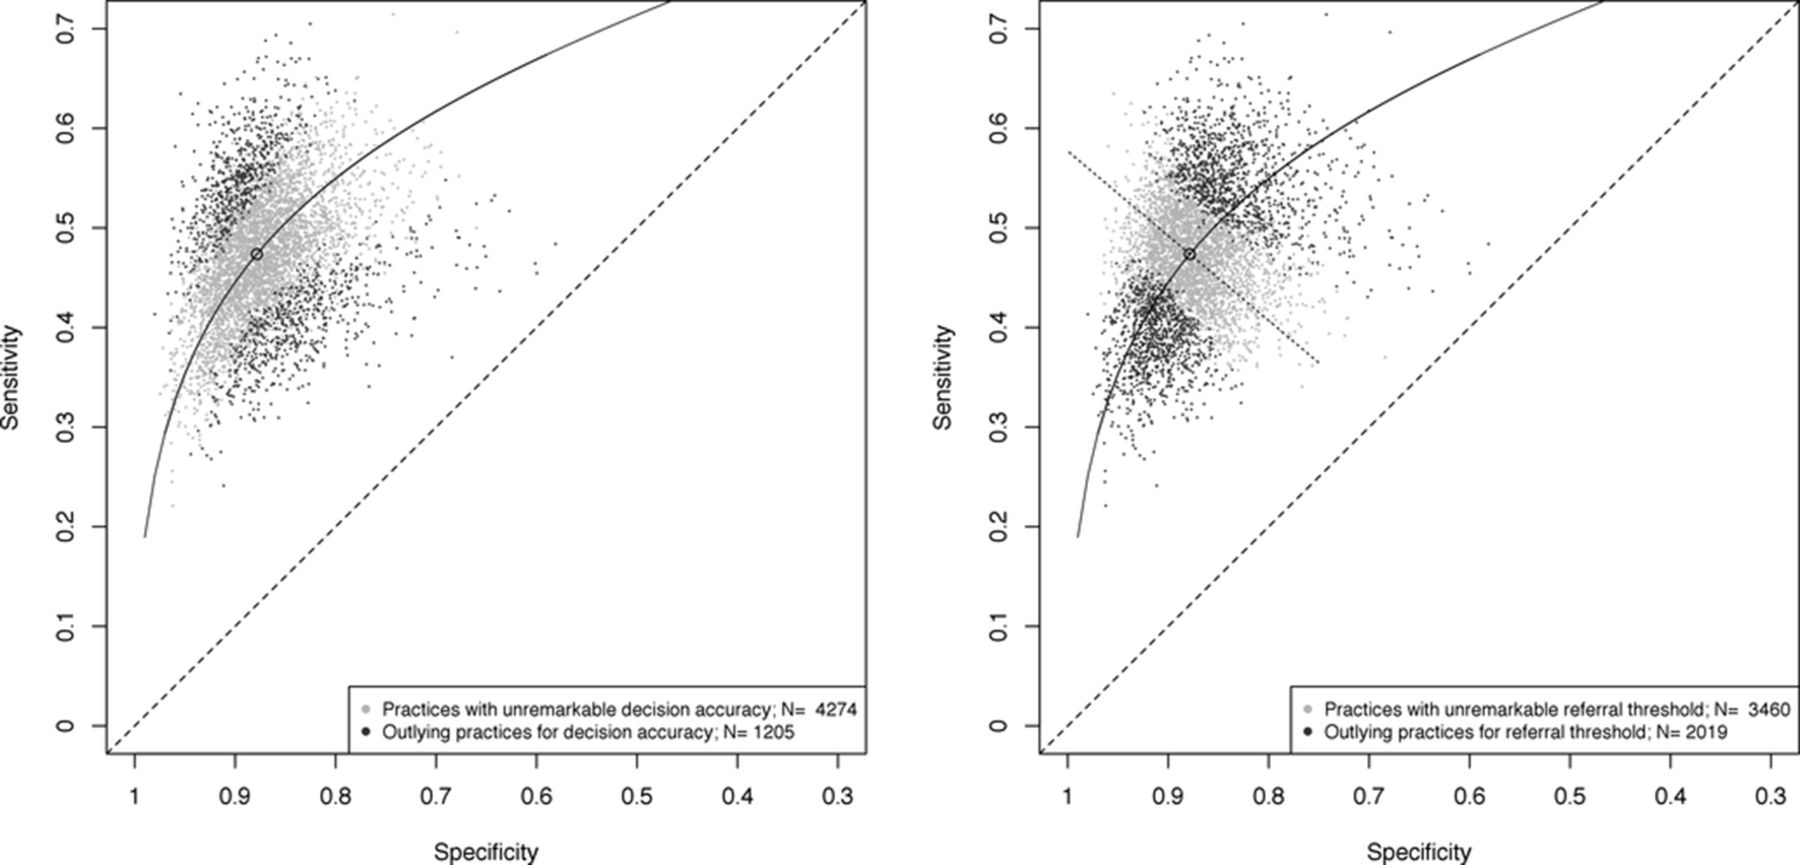
Distribution of sensitivity and estimated specificity of practices with hierarchical summary receiver operating characteristic curve (HSROC). (A) Plot highlighting outlying practices by diagnostic accuracy. (B) Plot highlighting outlying practices by referral threshold.
Variation in referral threshold
Three thousand four hundred and sixty practices (63.2%) had 95% confidence regions, which crossed the line perpendicular to the HSROC curve at the summary sensitivity and specificity point indicating that these practices were not statistical outliers in relation to referral threshold. Of the remainder, 1091 (19.9%) practices had 95% confidence regions wholly to the right of the line, suggesting low referral thresholds (ie, high referral rate) and 928 (16.9%) wholly to the left of it suggesting high referral thresholds.
Variation in referral selection accuracy
In the primary analysis, 4274 practices (78%) practices had 95% confidence regions which crossed the HSROC curve, indicating that these practices were not statistical outliers in relation to selection accuracy. A further 610 (11.1%) practices had 95% confidence regions wholly above the HSROC curve suggesting high selection accuracy and 595 (10.9%) wholly below it suggesting low selection accuracy.
Combined variation in threshold and accuracy
Two thousand eight hundred and sixteen practices (51.4%) were neither outliers in relation to threshold nor accuracy. Two hundred and seventy-four practices (5.0%) showed high accuracy and low threshold, 316 (5.8%) high accuracy with unremarkable threshold and only 20 (0.4%) showed high accuracy with high threshold. Two hundred and six practices (3.8%) showed low accuracy and high threshold), 328 (6.0%) showed low accuracy and unremarkable threshold and only 61 (1.1%) showed low accuracy and low threshold.
Factors associated with variation in referral threshold and selection accuracy
Table 2 shows the summary sensitivity and specificity for each quintile of practice characteristics. The data for age-standardised fast-track referral rate shows a simple trade-off between sensitivity and specificity, such that as one increases, the other decreases. For practice cancer incidence rate and proportion of older adults, both sensitivity and specificity increased slightly across the quintiles (eg, for cancer incidence quintiles, sensitivity rose from 46.6% to 48.5% while specificity rose from 85.1% to 89.1%). For socioeconomic status, sensitivity and specificity were both slightly lower in the most deprived quintile of practices, but the differences were relatively small. Practices in the smallest quintile of list size also showed slightly higher sensitivity and specificity, but there was no apparent trend among larger practices.
Summary sensitivity and specificity by quintiles of practice characteristics (5479 practices)
Table 3 shows the proportion of practices, which met outlier criteria for referral accuracy and threshold in each of the quintiles. Smaller practices and those with lower cancer incidence were more likely to be outliers—in part this may represent smaller numbers of cancer cases and thus greater random variation due to cancer presentation.7 However, there were clear trends in the number of high and low accuracy outlying practices with increasing quintiles of cancer incidence rate and proportion of patients aged 65 or over. There were fewer high accuracy outliers in practices with high levels of socioeconomic deprivation. There was no consistent or strong relationship between the number of outlying practices in terms of referral threshold (either high or low) and any of the practice variables.
Number of practices which met outlier criteria in relation to accuracy curve or threshold line by quintiles of practice characteristics, with OR relative to middle quintile (5479 practices)
Models of changing referral patterns
Table 4 shows the result of the modelling of the difference in cancers diagnosed via the fast-track pathway between practices in different quintiles of age-standardised fast-track referral rates. The lower part of the table shows the increase in number of cancers diagnosed via fast-track referral and the number of extra fast-track referrals needed to move between any pair of quintiles. From this, it is apparent that if practices in each quintile were to behave like practices in the highest referral quintile, then out of 5000 patients with cancer (1000 per quintile), an extra 164 (3.3%) would be diagnosed via fast-track pathways at the expense of 8294 (36.9%) more referrals. (The figure of 164 additional cancers/8294 additional fast-track referrals represent the effect of all practices behaving like those in the top quintile of age-standardised fast-track referral rate.) Online supplementary table ST2 shows the results of a sensitivity analysis (limited to the lowest and highest quintiles only) in which the prevalence rate of cancer in consulting patients was altered.
Results of modelling the effects of changing from lower to higher quintiles of referral rates
Discussion
Summary of main findings
The variation between practices in fast-track referrals for suspected cancer comprises both variation in referral threshold and in the accuracy of selecting patients for referral. Variation (as judged by the number of statistically outlying practices) is greater in relation to threshold than accuracy and this variation is unrelated to practice characteristics. Simply lowering referral thresholds without also increasing referral decision accuracy risks large increases in referral numbers for small gains in cancers diagnosed through fast-track pathways.
Strengths and limitations
This study used a complete national dataset collected over 5 consecutive years. While we have previously demonstrated that random variation can account for much of the year to year variation in apparent diagnostic performance, this is reduced by aggregation of data over several years as in this study.7 We used established techniques for bivariate meta-analysis to compare practices.16 18 19 These allowed us to calculate confidence regions around individual practice values for sensitivity and specificity and identify statistical outliers. Our estimation of true negative values was guided by published data3 15 and we conducted sensitivity analyses based on different cancer prevalence in symptomatic patients for estimating true negatives, which showed that while the absolute values for specificity did vary, the relative position of practices and their confidence regions in relation to the summary values did not.
We were limited by the lack of data from small practices with less than six cancers diagnosed after urgent referral for suspected cancer in some years. However, the random variation in cancer presentations to general practice has large effects on estimates of sensitivity where there are less than 50 cancers,7 so these practices could have been excluded anyway. Even with more than 50 cases, it is important to recognise that the relative position of practices is dependent on assumptions of similar case mix. Our data reflect practice performance as data at the individual practitioner level data are not available. While this masks variation between individual clinicians, an approach such as ours would be difficult to apply to individual clinicians because some patients see several clinicians before referral. Thresholds are known to vary between individual clinicians11 and variation in other aspects of performance may be larger within practices than between them.20 21
Comparison with other research
Previous studies have attempted to assess practice variation in relation to cancer diagnosis using less rigorous approaches. Typically these include comparing sensitivity with positive predictive value (often referred to as detection rate and conversion rate)6; however, these do not allow for estimation of either selection accuracy or referral threshold and are often conducted on single years of data,5 which are highly sensitive to chance variation.7 Threshold is typically defined as an absolute value which refers to the probability of disease (such as cancer) at which a clinician is indifferent between administering versus not administering a health intervention (such as fast-track referral).12 13 Because the data in this study represented the aggregate of many heterogeneous decisions with potentially very different thresholds, we did not attempt to calculate a specific threshold value,22 rather we aimed to describe the variation between practices in relative terms.
Our finding that referral decision accuracy increases with cancer incidence rate is notable but not unexpected23 and has been observed in a range of diagnostic test analyses. However, it is unusual for sensitivity and specificity to increase in parallel as we observed for cancer incidence. Practices with higher cancer incidence and more older people appear to perform better for a given threshold: there are several possible explanations, including a beneficial effect of experience (‘the more you see, the better you get’) and a lower risk of discounting potentially alarming symptoms in younger adults.
While assessment of selection accuracy has been used to compare individual clinicians in tasks such as interpretation of radiographs, numbers have been small,24 and limited to reporting of ordered radiographs, not the decision to order or refer. We believe that this approach is applicable to analysing variation in other settings where clinicians act under uncertainty,11 such as the decision to order CT imaging for possible pulmonary thromboembolism25 or headache,26 27 operate in suspected appendicitis27 or to carry out caesarean section for suspected fetal distress.28
Implications for practice, policy and research
There are three key implications from this study. First, variation in practice with respect to cancer referrals is more complex than publicly reported metrics suggest and comprises variation in selection accuracy (for a given referral threshold) and in threshold (at a given level of accuracy). Of the two, variation in threshold is the more common. Our approach provides a way of profiling practices in relation to both accuracy and threshold and so provides the opportunity to apply tailored quality improvement activity. For instance, practices with high thresholds (low referral rate) should be encouraged to refer more. As referral thresholds appear relatively stable overtime,7 it should be possible to evaluate changes in referral numbers from data on shorter timescales. Where data suggest low selection accuracy, alternative approaches to evaluating changes in performance are needed and we would suggest a case-based approach, such as significant event analysis, possibly with the inclusion of peers.29 Second, practice characteristics, particularly socioeconomic deprivation, have relatively little impact on variation in accuracy and even less on threshold. This is encouraging and suggests an equitable service. Third, simply lowering referral thresholds may have very substantial effects on demand for specialist services with modest gains. Our approach permits these to be modelled and examined in ways, which have not been possible to date.10
Conclusion
Variation between practices in referral for possible cancer includes variation in both selection accuracy and referral threshold. Recognising these two sources of variation permits quality improvement initiatives, which have greater precision than present feedback methods. Simply lowering referral thresholds without increasing selection accuracy will have potentially unmanageable effects on the capacity of diagnostic services.
Acknowledgments
We wish to thank Alison Avenell, Mairead Black, Jon Dickson, Bruce Guthrie, Tom Love, Angus McLeod, Simon Sawhney and Liz Walton for their comments on the manuscript.
References
Footnotes
Contributors The study was conceived by CDB and PM. CDB, DJM, AJL and PM were involved in the design of the study and planning of the analysis, which was conducted by CDB and DJM. All authors contributed to the writing and revision of the manuscript. CDB is guarantor for the study.
Competing interests None declared.
Provenance and peer review Not commissioned; externally peer reviewed.
Data sharing statement The data used for this analysis are publicly available at http://fingertips.phe.org.uk/profile/general-practice/data#mod,1,pyr,2016,pat,19,par,-,are,-,sid1,1938133086,ind1,-,sid2,-,ind2,-.