Article Text

Abstract
Objective Various studies find that the share of emergencies in hospital admissions is higher in deprived areas, but both the explanation and policy implications are unclear. We estimate the extent to which this finding is due to a different disease mix in deprived areas, rather than other explanations such as patient behaviour and general practitioner effectiveness.
Design Secondary analysis using English Hospital Episode Statistics data, with disease for elective and emergency admissions in 2008/2009 coded at 186 blocks or 1230 categories and aggregated to lower layer super output area of residence. It is then linked to an appropriate measure of deprivation.
Outcome measures The difference in the share of emergencies in hospital admissions between communities in the highest and lowest deciles of deprivation; and the percentage of this difference that is explained if areas in the least deprived decile have the same disease mix as those in the most deprived decile.
Results Using the finest disease classification scheme (1230 categories), 71% of the higher share of admissions that were emergencies in decile 1 areas relative to decile 10, is explained by the “adverse” case mix (CM) in deprived areas. The remainder reflects the higher relative use of emergency care in deprived areas for the same conditions. Higher incidence of respiratory and circulatory diseases in deprived areas explains about 30% of the CM contribution. Diseases of the digestive system and abdomen have a high relative use of emergency care in deprived areas.
Conclusions The higher use of emergency care in deprived areas is primarily a symptom of the higher prevalence of diseases which have high national rates of emergency to elective care—especially respiratory diseases—rather than an indication of less effective primary care. Nevertheless, there is a higher share of emergency care in admissions in deprived areas for several diseases, most notably of the digestive system.
- health economics
- emergency and elective hospital admissions
- deprivation
This is an open access article distributed in accordance with the Creative Commons Attribution Non Commercial (CC BY-NC 4.0) license, which permits others to distribute, remix, adapt, build upon this work non-commercially, and license their derivative works on different terms, provided the original work is properly cited, appropriate credit is given, any changes made indicated, and the use is non-commercial. See: http://creativecommons.org/licenses/by-nc/4.0/.
Statistics from Altmetric.com
Strengths and limitations of this study
This research comprehensively assesses the significance of variation in case mix (CM) on the share of admissions that are emergencies in deprived areas.
A measure of deprivation is used that is independent of health outcomes, and hence avoids potential endogeneity problems that arise without this adjustment.
The overall influence of non-CM factors in explaining the relative use of emergency care is estimated, but the separate influence of these other factors is not studied.
Context
Policy to reduce the growth of emergency hospital treatment by increasing the provision of planned care offers the twin benefits of health gain for patients and cost savings for providers.1 However, in pursuing the benefits of rebalancing care away from emergency services, a major issue is raised by the various studies across many countries that find that the share of emergency care in hospital admissions is higher for patients resident in disadvantaged areas.2–5 This relationship shows that commissioners must expect a higher demand for emergency care in deprived areas, ceteris paribus. While this is important for planning hospital provision,6 7 it remains unresolved whether the high use of emergency care in deprived areas is primarily a symptom of the pattern of illness in deprived areas, or rather a consequence of system weaknesses that should be specifically addressed—for example, a patient culture that overuses emergency care, or shortcomings in primary care delivery. It is therefore unclear whether high use of emergency care in deprived areas should be an organisational policy target.
Our objective is to study the extent to which the medical conditions that occur more frequently in poor areas explain the greater dependency on emergency relative to elective care. To do this, differences in the rates of emergency relative to elective admission between deprived and other areas are separated into two components: (1) a component due to differences in the medical conditions of patients in the compared areas, and (2) a second component due to higher emergency admission rates in deprived areas for the specified diagnosed conditions. The latter component is the usual focus for policy analysis of the high use of emergency care in deprived areas. We first assess how far the higher use of emergency relative to elective care is due to deprived areas having a disproportionate share of diseases which elsewhere use relatively more emergency care; and how far the relative use of emergency care is higher within disease categories. We then aim to identify a group of diseases which are more prevalent in deprived areas and explain most of the contribution of case mix (CM) in explaining these areas’ higher use of emergency care. We also aim to identify a group of diseases which together account for much of the higher use of emergency care within specific disease categories in deprived areas. This latter work is intended to help target conditions that may benefit from further delivery research and support implementation in deprived areas. While we focus on understanding differences in the share of emergency admissions in deprived and prosperous areas, the methods employed could also be used to consider the influence of disease mix on the nature of admissions on patients who differ by other demographic characteristics such as ethnicity, age and gender.
Many studies discuss the use of hospital services among the deprived. As Huntley et al 8 show in a systematic review of literature on factors that influence levels of emergency admissions, reduced socioeconomic status generally leads to higher use of emergency facilities. A study of general practices in London,9 after controlling for the proportion of patients who are chronically ill, found that higher emergency admission rates are associated with a larger proportion of patients being unskilled, from a one-parent family or unemployed. Evidence from studies of some cancers, using local area data, finds emergency use is higher in deprived areas.10 11 Important evidence from Dundee12 and Glasgow13 shows that people from areas of greater deprivation experience higher rates of both emergency admissions, and also admissions for ambulatory care sensitive conditions14 after certain factors, but not usually patient morbidity, are considered as a possible cause of the difference.
However, fewer studies focus on emergency relative to elective admissions. Wiseman and Baker15 study the proportion of admissions that were emergencies for a sample of 229 practices in Leicester, Northamptonshire and Rutland. They find practices with more deprived patients experience higher proportions of hospital admissions that were emergencies. They include measures of prevalence for coronary heart disease, hypertension and stroke as controls in their multivariate model. The influence of the comparative frequency of disease between local areas on emergency relative to elective admission rates has not been studied in a way that reflects the various differences in disease between patients in communities of different deciles of deprivation. Van der Heyden et al 16 consider jointly the impact of patient morbidity and deprivation on the use of health services. Studying data from the Belgian National Health Interview Survey, they find that some health services are more heavily used by patients from deprived backgrounds, but that this effect is mostly explained by these people having poorer health. The relationship between deprivation and emergency admissions is found to vary across the age distribution;17 deprivation appears to have stronger effects on emergency admissions for younger people in Britain18 and Ireland,19 although evidence suggests that in Canada20 elderly patients with low socioeconomic status were more likely to use the emergency department.
A related research literature studies individual utilisation of National Health Service (NHS) facilities, and whether the policy objective of providing care on the basis of need, independently of patient income, is achieved.21–29 However, these studies do not distinguish emergency and elective treatments.
The higher share of emergency admissions in deprived areas has been argued to be partly due to the effectiveness of primary care and specifically, (1) the consequences of failures by patients to establish good relationships with their general practitioners (GPs),30 31 possibly due to more challenging lifestyles that lead to later presentation, thereby leaving these patients more vulnerable to the unexpected onset of illness, and a need for emergency care; (2) lower quality of care as evidenced by GP evaluation scores in the Quality and Outcomes Framework;32 33 (3) the prevalence of single-handed practices with associated concerns regarding access to primary care34 35 and (4) relative to patient need, GPs have been underprovided to deprived areas.36 These clinical considerations, and other factors may, in particular, contribute to reducing the effectiveness of primary care in deprived areas, and thereby help to explain why variation in disease will not explain the entire difference in proportions of emergency admissions between areas.
Methods
Deprived areas and hospital admissions
Our study of the influence of disease on hospital uses data from two sources. One source identifies the prevalence of medical conditions, hospital use and locations of the patients, and the other measures the relative deprivation of patients’ residential areas. The influence of disease on hospital use might be studied using the prevalence of each condition at local area level. Emergency and elective admissions could then be related to local prevalence. Unfortunately, detailed prevalence data are unavailable. Therefore we use Hospital Episodes Statistics (HES) data, extracted from the HES database using the HES Data Interrogation System (HDIS), to measure the disease variation experienced by admitted patients. Our database contains data on all patients treated in NHS hospitals—including private patients—for the financial year 2008/2009, using HES records aggregated by lower layer super output area (LSOA) of residence. LSOAs have an average population of approximately 1500 people, and possess considerable residential homogeneity. Our second source, which concerns the relative deprivation of LSOAs, is the data used to construct the Index of Multiple Deprivation (IMD) calculated for 2007, to which we apply a minor modification.
Each HES patient record contains information about treatment, clinical issues and patient characteristics, and is intended to facilitate a prospective payment system for hospital treatment. Our analysis of admissions includes all inpatient hospital episodes from HES in 2008/2009 where the admission method is classified as ‘elective’ or ‘emergency’. This excludes patients where the admission method is ‘babies’ or ‘other’, who form a very small proportion of care. We consider data for admissions aggregated by LSOA of patient residence for all conditions, with condition defined by International Classification of Diseases 10th revision (ICD10) recorded in HES as the primary diagnosis. WHO distinguishes aggregated groups of diagnosis codes, first into blocks and then chapters. Conditions indexed i can be defined by the ICD10 block level, which uses 186 blocks, or a more granular level of 1230 categories. In the results section we provide evidence using both coding levels.
In order to perform our analysis, the 32 482 LSOAs are allocated to 1 of 10 deciles ranked by increasing levels of deprivation, with decile 10 containing the 10% most deprived LSOAs. The elective admissions, and separately the emergency admissions, for all LSOAs in a given decile are summed by each condition i. This gives two matrices, one each for emergency and elective care admissions, by condition for each decile, that allow the straightforward calculation of the critical expression formulated in section 2.2. These can be used to create our estimates for the contributions of CM and other factors to the differing proportion of emergencies in total NHS hospital admissions across LSOA communities.
The deprivation of each LSOA is measured using a transparent modification of IMD, which gives an indication of relative deprivation across England. IMD is calculated using data on seven domains and has been widely used by UK Government departments37 and previous literature. In this study we modify this index by excluding the health domain to avoid circularity in the relationships we wish to explore (ie, hospital use influencing the measure of deprivation, rather than the other way around). We label this the Non-Health Index of Multiple Deprivation (NHIMD). The relative weights attached to the non-health components of the NHIMD are unchanged from those used in IMD. Using NHIMD instead of IMD changes the deprivation decile of 17% of LSOAs. However, it has a minimal impact on the most deprived LSOAs on which we focus; 94% of the LSOAs in decile 10 (the most deprived 10% of LSOAs) of NHIMD are also in decile 10 of IMD.
Defining the contribution of differences in CM and the effectiveness of primary care
Our study concerns how the proportion of emergencies in total NHS hospital admissions differs between LSOA communities situated in different deprivation deciles. In particular, we focus on comparisons between LSOAs in decile 10 (the most deprived) and LSOAs in each of the other deciles (j=1–9). This section describes the statistical method used to derive two components of these differences between deprivation deciles. We explain how this comparison can be decomposed into a ‘case-mix’ component, reflecting variation between deciles in patient morbidity, and a ‘non case-mix’ (NCM) component. The CM difference consists of the influence on emergency admissions of interdecile differences in the prevalence of each condition, indexed i, within all admissions in each decile j. This is identified using ci j , the number of admissions for condition i as a percentage of total admissions in decile j. The NCM difference is the residual that is not explained by the CM treated by health providers in the local area. To determine a formula that will allow the calculation of CM and NCM components we first note that the proportion of emergencies in total admissions in decile j, Aj , is given by:
 (1)
(1)
where Ej is emergency admissions, and Lj is elective admissions, in decile j. If Ei j is emergency admissions for condition i in decile j, and Ej is the sum of admissions for all I conditions in decile j, then Ej =E1 j+E2 j +…EI j . Thus,
 (2)
(2)
To construct the partition between the CM and NCM parts, we write the expression in (2) as the product of (a) the proportion of all admissions in decile j that are for condition i:
 (3)
(3)
and, (b) the proportion of admissions for condition i in decile j that are emergencies:
 (4)
(4)
The product of (3) and (4) gives emergency admissions in decile j for condition i, as a proportion of total admissions in decile j:
 (5)
(5)
Using (5), the expression in (2) for the proportion of admissions that are emergencies in decile j can be expressed as:
 (6)
(6)
Using (6) we can describe the difference in emergency admission rates between decile 10 (the most deprived) and decile j.
 (7)
(7)
where ci
j
is the proportion of all admissions for condition i in decile j; and mi
j
is the proportion of admissions for condition i in decile j that are emergency admissions. By introducing  in equation (7) with opposite signs, (7) can be rewritten as a sum of two components, reflecting differences between deciles 10 and j in (a) CM and (b) emergency admission rates by condition (NCM):
 (8)
(8)
The first part of equation (8) shows the extent to which the difference between deciles 10 and j, in the share of admissions that are emergencies, is explained by the different CM of deciles 10 and j, evaluated at the emergency admission rates of the more prosperous area. This is the CM difference. The second part of equation (8) is the NCM difference and shows the extent to which the difference between the share of admissions that are emergencies in deciles 10 and j is explained by the higher emergency admission rates by condition in decile 10, evaluated at the shares of emergency admissions by condition found in decile 10. This latter element is the focus of work investigating policy reform in the use of emergency care in deprived areas. A comparison of the most deprived decile with any of the other deciles can be calculated simply using hospital admissions data from HES data, as summarised above, in the expressions for CMj and NCMj given by (8). Our primary focus is on the comparison of LSOAs in the most deprived decile with those in the least deprived decile.
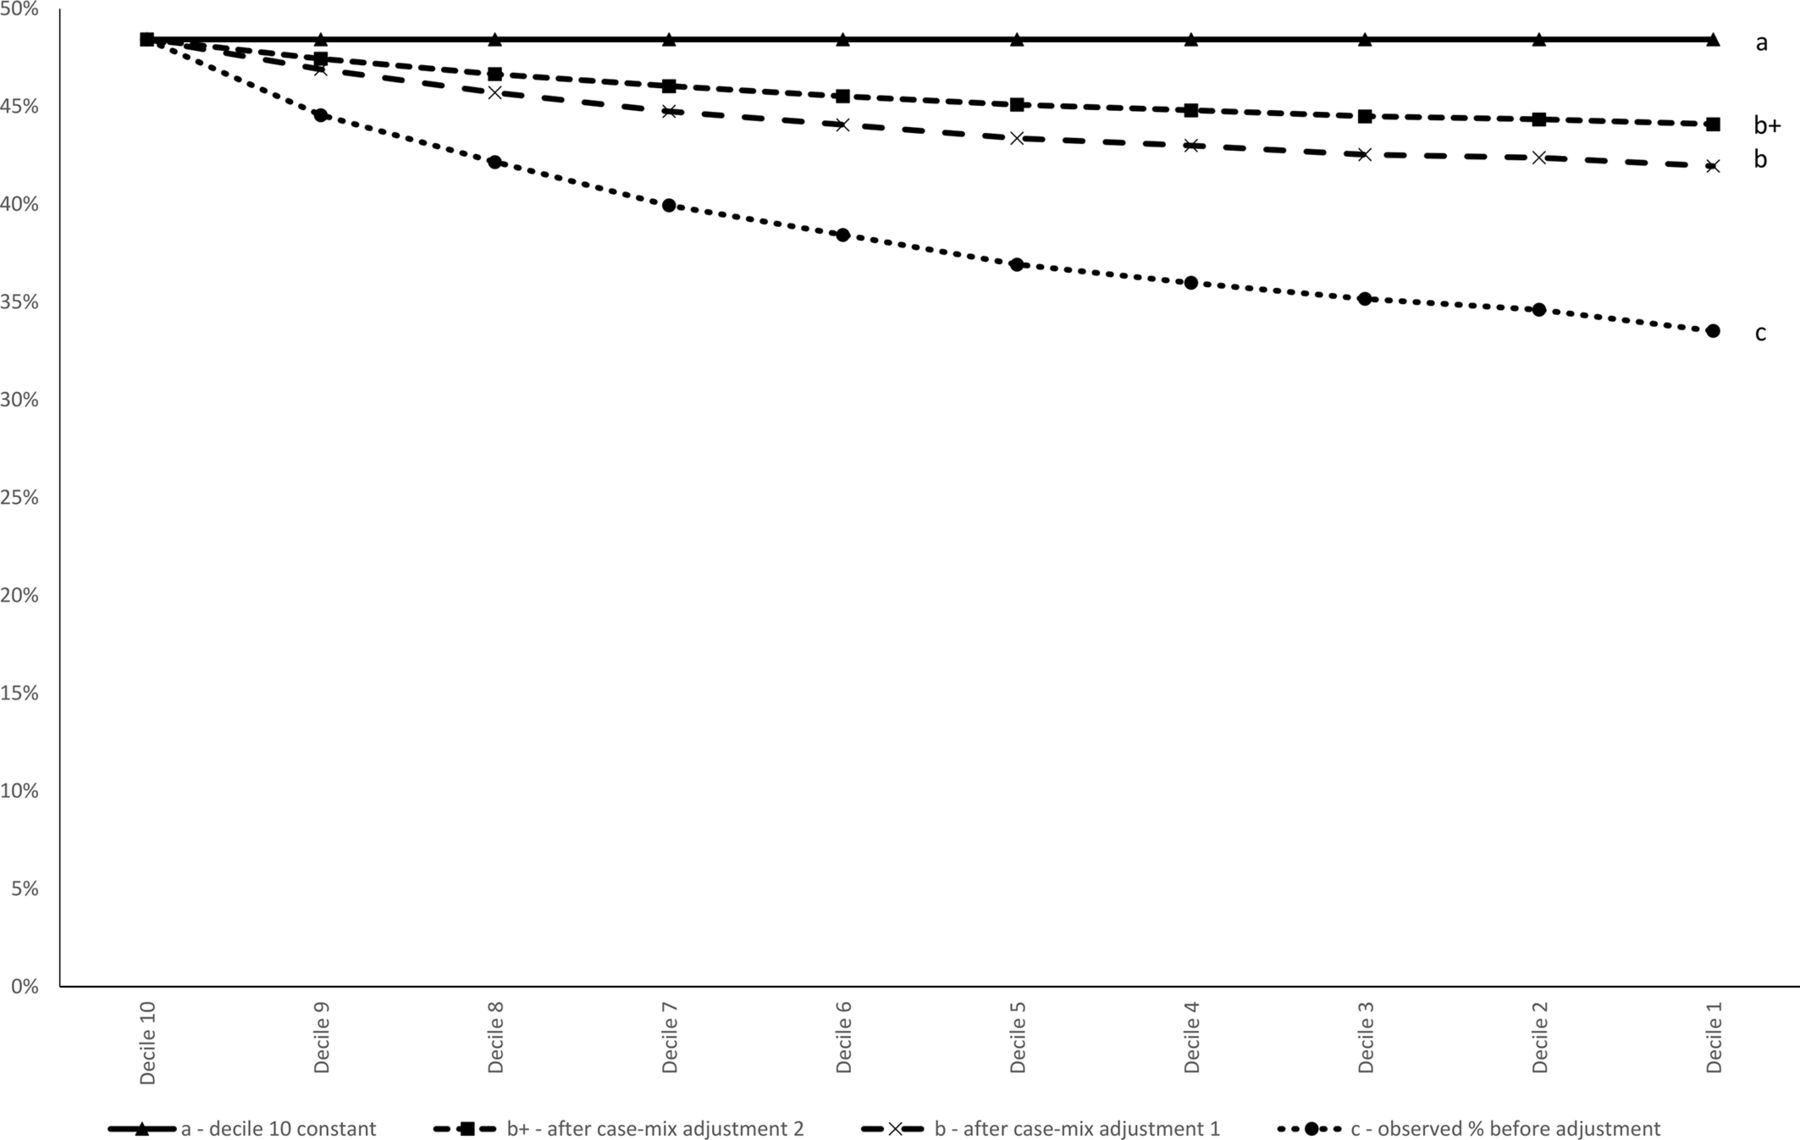
The medical conditions, indexed i, are defined using either the ICD10 block level of which 186 blocks are used, or at a more granular level of 1230 categories. Adopting these two levels of granularity in turn, we calculate each of the CM and NCM differences, using the expression in equation (8). The terms in (8) can be given a ready interpretation.  is the proportion of admissions that are emergencies in the most deprived decile 10 (labelled a in figure 1), and is invariant with respect to choice of decile j.
  is identical to
  and is the projected proportion of emergency admissions for each decile j, if the CM in j is adjusted to that observed in the most deprived, decile 10. Considering
  and using the 186-block ICD10 coding for CM for each decile j, we may calculate the share of emergencies in admissions for each decile, under the assumption that in each decile the disease mix is that of the least prosperous decile. This value for each decile is added to figure 1 and the 10 points are joined to create the line labelled b in figure 1. If we use the less coarse 1230 categories for coding, we obtain the line b+ in figure 1.
  is the proportion of admissions that are emergencies in each decile j (labelled c in figure 1). It can be readily observed that changing the classification does not alter the value of
  for any decile j, since from equation (5) the denominator is independent of disease classification and the numerator is total emergency admissions in the decile, so that lines a and c are unaffected by choice of disease coding.

Emergency admissions in decile j as a percentage of total admissions, with and without interdecile case mix adjustment, 2008/2009.
Patient involvement
Patients and the public were not involved in this research.
Findings
Use of secondary care in deprived areas: an aggregate view
Before presenting our main results we overview the utilisation of NHS secondary care in England for LSOA areas by their level of deprivation. This is depicted in figure 2. Utilisation of emergency hospital care is higher in the most deprived areas, whereas the rate of elective admissions is similar across the deciles. ‘Accident and Emergency’ attendance has the steepest gradient across deciles, particularly at the most deprived end of the distribution.

Emergency and elective inpatient admissions, Accident and Emergency Department attendances, and outpatient appointments per head of population by deprivation decile for patients of all ages, 2008/2009.
In total, there were 31 admissions per 100 population in decile 10, and 22 admissions in decile 1. Decile 10 provided 48% more emergency admissions, but only 2% more elective admissions, than decile 1. The percentage of admissions classified as emergency was 48% in decile 10 compared with 34% in decile 1.
Quantifying the contribution of differences in CM and the effectiveness of primary care
The expression in equation (8) gives the basis for determining how the difference in the proportion of admissions that are emergencies between LSOAs in different deciles of deprivation, can be separated into a CM and an NCM component.
Our findings are summarised in figure 1. The bottom line—labelled c—gives the share of emergencies in hospital admissions for each decile of LSOAs; the top line gives this value for the most deprived decile. The two other lines show the hypothetical share of emergency admissions in total admissions in decile j if the disease mix for decile j is assumed to be the disease mix of decile 10, for the two disease coding models we have used. From equation (8), the CM difference is given by the value of b−c and the NCM difference by a−b on the assumption that we use the 186-block ICD10 coding. Under the finer coding of 1230 categories, the expression for b+ is substituted for b.
It follows that the NCM part of the difference between the proportion of admissions that are emergencies in deciles 10 and j is represented in figure 1 by the vertical difference at decile j between lines a and b (or b+); the CM difference is represented by the vertical difference between b (or b+) and c. The difference in the proportion of admissions that are emergency between decile j and decile 10 is the vertical difference between a and c, at decile j.
The vertical difference between lines b and c at decile 1, the most prosperous decile, as a proportion of that between lines a and c, indicates that 57% of the 14.9% difference in the proportion of emergency admissions between deciles 1 and 10 can be explained by a difference in CM. Using the more granular classification of three-digit ICD10 codes produces values of b+ that are higher than b for all deciles. As a result, the CM difference increases to account for 71% of the total difference between deciles 1 and 10 in the proportion of admissions that were emergencies, as shown by line b+ in figure 1. Using the finer coding further reduces the difference in emergency use between areas that is unexplained by CM. Patients in decile 10 have a more adverse disease mix that, should it arise in the most prosperous areas, would increase those areas' share of emergency admissions sufficiently to eliminate about two-thirds of the gap between the shares of emergencies in the most and least deprived areas.
The results confirm that a smaller number of disease categories increases the variation between LSOAs of the share of emergencies in hospital admission (emergency or elective) within the coded conditions. This increases the estimated size of the NCM difference and decreases the size of the CM difference.
Calculating the relative importance of individual conditions
The role of CM in accounting for the higher use of emergency care reflects the sum of many coding classifications and this sum can be used to determine the relative importance of individual conditions in the CM component. This is done by dividing each condition’s contribution mi j(ci 10−ci j) by the total difference between the two deciles’ rates of emergency admission (A10−Aj ). If a condition is relatively more prevalent compared to other conditions in decile j compared to decile 10, then this contribution will be negative.
Tables 1 and 2 show the conditions that contribute most to the CM and NCM components. Not all of the disease categories used in the analysis are included in the tables and therefore the values do not add up to 100%.
Main diagnosis codes contributing to the CM difference
The main differences in CM between deciles 10 and 1, that contribute to the higher use of emergency care in deprived areas (decile 10), are respiratory and circulatory conditions, as well as conditions relating to pregnancy and the use of drugs and alcohol. These are conditions for which factors outside of primary care, such as community care, social work and families, and public health often play a key role in prevention and treatment. Undiagnosed symptoms (chapter R) and injuries (chapter S) were also important in explaining the CM difference.
The contribution of each condition to the NCM difference can be similarly calculated by dividing the contribution of the ith condition,  by the total difference, (A10
−A
j
). If a condition is more prone to emergency admission in decile j than in decile 10, then this value will be negative.
by the total difference, (A10
−A
j
). If a condition is more prone to emergency admission in decile j than in decile 10, then this value will be negative.
Main diagnosis codes contributing to the NCM difference
The main contributors to the higher use of emergency care for given diseases (NCM) in deprived areas (table 2) are conditions of the abdomen, urinary and digestive systems, malignant cancers, heart and joints. ICD10 codes for undiagnosed symptoms (chapters R and Z00–Z13) also contribute.
One way of identifying the extent to which the NCM difference is largely due to a few conditions, rather than having causes systemic to primary care in deprived areas, is by observing the degree to which the NCM difference is composed of large interdecile differences in the emergency/elective admission ratio for a few conditions, or small differences for many conditions. The 10 conditions that contributed most to the CM difference account for 95% of the total CM difference, whereas the 10 largest contributors to the NCM difference account for only 48% of the NCM difference. The NCM difference therefore appears to be composed of small contributions from many conditions. This suggests that the NCM difference may have systemic causes, some of which are discussed above, rather than condition-specific causes.
Figure 3 shows that the proportion of admissions that are emergencies is larger in decile 1 than in decile 10 for only 18% of conditions. The proportion of admissions that are emergencies was at least five percentage points larger in decile 10 than in decile 1 for 46% of conditions.

Histogram of the percentage of admissions that were emergencies in decile 10 minus the percentage of admissions that were emergencies in decile 1 by ICD10 block. ICD 10, International Classification of Diseases 10th revision.
Discussion
The main findings
In the findings section we discuss the extent to which the percentage of admissions that are emergencies differs between areas of high and lower levels of deprivation as a consequence of disease mix differing by levels of deprivation. Using two different disease coding systems, we find that 57% or 71% of the difference between deciles 1 and 10 in the percentage of admissions that are emergencies can be explained by the more ‘adverse’ deprived area CM. The remaining part arises from higher use of emergency care in deprived areas for the same disease.
Using HES data to separate CM (as measured by diagnosed condition) and NCM components raises several issues. To appropriately interpret the CM and NCM components, and in particular that the NCM captures the relative effectiveness of primary care in deprived areas, it is helpful to consider the identity in equation (8). This identity does not capture a refutable theory, but conjectures about the effectiveness of primary care in deprived areas will enter by influencing the c or m terms. The context section of this paper includes a summary of some of the clinical factors that have been found to negatively impact on the effectiveness of primary care in deprived areas, and help to explain the NCM component. Would these considerations influence the c and/or m terms in (8) in a way that also alters the CM component? A comparative failure to form patient-doctor relationships, and GPs with limited opening hours in deprived areas, would each appear to primarily increase the likelihood that a patient with a given condition would use emergency care, thereby increasing the mi
10
terms. An increase of  directly increases the NCM component of (8), and does not change the CM component.
However, weaknesses in primary care may also alter the mix of diseases for which patients are admitted to hospital if, for example, the weakness arises because preventative care is less likely to be provided in deprived areas. In this way the proportion of admissions for condition i may increase, but only with compensating falls in ci 10 for some other diseases. The changing weights on each condition may raise the CM component if the diseases with higher weights use emergency care intensively; but equally may reduce the CM component if the diseases with increased weights have low emergency rates of admission. In the absence of theories or evidence of such effects on the CM component, we will assume that ineffective primary care has no systematic effect on the expected value of the CM component. Thus while it is inappropriate to regard the CM proportion as entirely independent of primary care effectiveness, it is not unreasonable to consider that any such effects will be second order, relative to the direct effects on the NCM component.
In this paper we focus on how far the variation in the share of emergencies in total admissions can be explained by disease variation, as opposed to greater emergency admissions within disease categories, since for providers the treatment of disease is central to their services and variation in disease would be expected to influence the use of emergency treatment. Moreover, by inviting further study of the higher use of emergency care within disease categories, and the role of socioeconomic considerations, such as age and occupation, this approach integrates a macro framework to assess the overall contribution of disease mix on the relative use of emergency care with single disease multivariate studies aiming to understand the higher use of emergency care for certain diseases in certain geographical areas, or at specific practices. Ours is not the only way to structure these variables, and the influence of socioeconomic variables such as age on emergency use may matter in a multivariate regression study of admissions, both by shaping local disease patterns, and the likelihood that a patient with a given disease uses emergency care.
HES data make no allowance for the severity of the condition for which the patient was admitted. Insofar as patients from deprived areas may have on average greater severity, which is more likely to require emergency care, we may understate the importance of the CM contribution.
A high incidence of respiratory and circulatory conditions in deprived areas explains 30.1% of the CM component. The higher use of emergency care for given conditions is spread over many diseases which suggests systemic rather than disease-specific challenges in deprived area emergency admission rates. For some purposes it may not be possible or of interest to include disease in a study of hospital admissions, however the comparative importance of disease mix relative to admissions within a disease category, is a descriptive property of the HES data and alternative modelling should be consistent with this.
Strengths and weaknesses of the study
Strengths
We use an administrative data set of all conditions, admissions and geographies in England, and therefore this analysis is free from sampling biases. A decomposition method is applied to these data for the first time to measure the importance of adverse CM in deprived areas in explaining high emergency admissions. This clarifies whether to target deprived areas for reductions in emergency care.
Weaknesses
The way in which conditions are defined in the calculation affects the estimated importance of CM differences. In order to minimise any association between the effectiveness of primary care and the estimated CM difference, conditions should be defined so that their classification is independent of primary care treatment. For example, the condition assigned to a patient should not change if a preventable complication is allowed to develop. Complications are likely to increase the probability of emergency admission relative to elective, but this is related to primary care and should therefore form part of the NCM difference. Conversely, to maximise the association between the effectiveness of primary care and the NCM difference, conditions that start and develop differently, independently of the care received and in a manner that influences the probability of emergency admission relative to elective, should in principal, be classified separately.
Analysis of the most deprived geographical areas does not equate to analysis of the most deprived people: deprived and socially excluded people often may live close to more affluent people. We reduce this problem as far as possible by analysing hospital admissions and deprivation using very small geographical areas. For each LSOA we are able to observe both information about patient hospital admissions, and also measures of local deprivation. We have studied only recorded admissions and have not considered the appropriateness of admissions.
We focus on the contribution of CM and although the causes of the NCM differences are discussed, we do not attempt to measure their relative importance.
Strengths and weaknesses in relation to other studies
We add to a small literature on the relative use of emergency to elective care in deprived areas. Others have studied the influence of residence in a deprived area on the relative use of emergency care, but control for disease with just a small number of ad hoc indicators. Here, we use administrative, rather than sample, data and an exhaustive description of local disease. Our study is further differentiated by addressing the extent to which higher deprived area use of emergency care should be regarded as an organisational policy target.
The meaning of the study: possible explanations and implications for clinicians and policy makers
We aim to understand whether reducing the higher relative use of emergency care in deprived areas should be a policy target. We show that about two-thirds of the higher use is due to the different disease mix in deprived and prosperous areas, and expected if admission procedures are constant by condition nationally. Digestive diseases fit this interpretation less well, having relatively high emergency admissions in deprived areas. These conditions may benefit from specific initiatives in deprived areas.
Unanswered questions and future research
Study of (1) how to reduce high system-wide relative emergency admissions for circulatory and respiratory conditions and (2) how to reduce high relative emergency admissions for digestive diseases in deprived areas, would be helpful.
Conclusions
It is widely recognised that the relative use of emergency to elective hospital care is higher in deprived areas of the UK and other countries, and reducing this difference has been an important policy concern to improve patient benefit and reduce costs. We apply a simple methodology to a detailed picture of disease by small areas, and find that about two-thirds of the greater use of emergency care in deprived areas can be explained by patients in those areas possessing a disease mix different to that in prosperous areas, rather than higher emergency admissions within disease categories. This suggests that the observed gap between the share of emergency care in deprived and prosperous areas is reasonably regarded as primarily, but not wholly, a symptom of comparative disease rather than less effective primary care.
If commissioners in deprived areas are to satisfy patient need as in prosperous areas they should continue to provide considerably higher shares of emergency to elective care, while looking to understand further why the use of emergency care is slightly higher for most, but not all, diseases in deprived parts. We have suggested that this may, in part, arise from patients in deprived areas with a given diagnosis being more severely ill, but other clinical and socioeconomic factors including the share of the elderly in the local population, may also contribute.
We have summarised the diseases that are more prevalent in deprived areas and also explain much of the higher use of emergency care, most notably respiratory and circulatory diseases. Higher demand for certain specialties in deprived areas may enable local commissioners and providers to develop further methods of delivery that become cost-effective with the high levels of local demand—reflecting economies of scale—and for distinctive services to emerge.
Most, but far from all, diseases are shown to have higher shares of emergency admission in deprived areas, but apart from diseases of the digestive system, no single disease group is especially important in explaining the higher use of emergency care that is not accounted for by disease mix. This suggests that systemic, rather than a few disease-specific, aspects of care delivery in deprived areas may account for the higher use of emergency care not explained by comparative disease mix. This is consistent with the nature of the arguments usually offered to explain higher emergency use in deprived areas and the role of primary care.
Acknowledgments
The authors thank Professors Trish Greenhalgh, and Michael Pearson, as well as colleagues in CHSEO for helpful comments.
References
Footnotes
Contributors P-SH and BM produced the concept and the first draft. SR revised the paper, and all authors helped to complete the final draft.
Funding The authors have not declared a specific grant for this research from any funding agency in the public, commercial or not-for-profit sectors.
Competing interests None declared.
Patient consent Not required.
Ethics approval The NHS Health Research Authority on-line tool (www.hra- decisiontools.org.uk/ethics/about.html) confirms that this research does not require ethical approval.
Provenance and peer review Not commissioned; externally peer reviewed.
Data sharing statement Our agreement with HSCIC does not allow the sharing of data to third parties.