Article Text

Abstract
Objectives The purpose of this study was to estimate the annual incidence of Lyme disease (LD) in the UK.
Design This was a retrospective descriptive cohort study.
Setting Study data were extracted from the Clinical Practice Research Datalink (CPRD), a primary care database covering about 8% of the population in the UK in 658 primary care practices.
Participants Cohort of 8.4 million individuals registered with general practitioners with 52.4 million person-years of observation between 1 January 2001 and 31 December 2012.
Primary and secondary outcome measures LD was identified from recorded medical codes, notes indicating LD, laboratory tests and use of specific antibiotics. Annual incidence rates and the estimated total number of LD cases were calculated separately for each UK region.
Results The number of cases of LD increased rapidly over the years 2001 to 2012, leading to an estimated incidence rate of 12.1 (95% CI 11.1 to 13.2) per 100 000 individuals per year and a UK total of 7738 LD cases in 2012. LD was detected in every UK region with highest incidence rates and largest number of cases in Scotland followed by South West and South England. If the number of cases has continued to rise since the end of the study period, then the number in the UK in 2019 could be over 8000.
Conclusions The incidence of LD is about threefold higher than previously estimated, and people are at risk throughout the UK. These results should lead to increased awareness of the need for preventive measures.
Trial registration number This study was approved by the Independent Scientific Advisory Committee for CPRD research (Protocol number 13_210R).
- lyme disease
- lyme borreliosis
- epidemiology
- incidence
This is an open access article distributed in accordance with the Creative Commons Attribution Non Commercial (CC BY-NC 4.0) license, which permits others to distribute, remix, adapt, build upon this work non-commercially, and license their derivative works on different terms, provided the original work is properly cited, appropriate credit is given, any changes made indicated, and the use is non-commercial. See: http://creativecommons.org/licenses/by-nc/4.0/.
Statistics from Altmetric.com
Strengths and limitations of this study
Most Lyme disease (LD) cases are diagnosed by their general practitioner (GP).
We used the Clinical Practice Research Datalink, a GP-based database of comprehensive electronic patient records from over 11 million people in the UK.
Diagnosis of LD is often difficult, and so a detailed algorithm was needed to identify cases.
The number of LD cases is likely to be underestimated due to incomplete recording of antibiotic use by specialists and in-hospital.
Introduction
Lyme disease (LD), also known as Lyme borreliosis, has become the most common tickborne infection in many parts of Europe and the USA. The US Centers for Disease Control and Prevention (CDC) estimate around 300 000 new cases of LD per year in the US based on the results of two studies.1 2 A WHO report stated that about 85 000 cases are reported annually in Europe with wide variability between and within countries, but they noted that many LD infections go unrecognised due to inconsistent and incomplete methods of ascertainment of LD.3 A more recent estimate was around 232 000 LD cases per year in Western Europe, although some countries included centralised reporting only.4 Numbers based on centralised reporting are likely to be considerable underestimates. The number of cases from centralised reporting to the US CDC is around one-tenth of what the CDC calculated based on estimates from other sources.5
The official estimate for the UK is around 2000–3000 new cases of LD per year based on laboratory data in England and Wales and centralised reporting in Scotland.6 The higher incidence rates seen in some neighbouring countries suggest a potential underestimation of the incidence rate and number of cases in the UK.4 The British National Institute for Health and Care Excellence (NICE) stresses the need for an epidemiological study on LD in the UK.7
To address the concern that LD may be currently underestimated in the UK, we used general practitioner (GP) records and conducted an epidemiological study to estimate the annual incidence rate and total number of cases of LD by geographic region.
Methods
Data source
The study data were extracted from the Clinical Practice Research Datalink (CPRD), a primary care database containing data on 8.4 million individuals with 52.4 million person-years of observation in 658 UK primary care practices. Over 98% of the UK population are registered with a primary care GP, and a subset of the GP practices participate in the CPRD linkage scheme and provide patient-level information.
Approximately 8% of the UK population is currently included in the CPRD. When compared with the UK census in 2011, CPRD patients were found to be broadly representative of the UK population in terms of age and sex and also comparable in terms of ethnicity.8 The CPRD contains symptoms and diagnoses recorded with Read medical codes, demographic data, laboratory tests including test results, medical history and prescriptions issued by GPs. As GPs’ anonymised medical notes could be extracted only until May 2013 in the CPRD, the study period therefore ran from 1 January 2001 to 31 December 2012.
Study cohort and definition of LD
The study cohort was formed from individuals registered with GPs contributing to the CPRD.
The patients with LD were identified from an algorithm based on medical codes for LD, erythema chronicum migrans (ECM), laboratory tests and anonymised medical notes. The day of a recording was considered the date of the occurrence of the respective event. The algorithm identified patients with:
a medical code for LD (including arthritis in LD) or ECM (online supplementary table),
patients with clinically diagnosed LD or ECM in the medical notes together with a medical code indicating a secondary care visit or referral to secondary care,
patients with mentioning of LD or ECM in the medical notes (separated into clinically diagnosed LD or LD suspected by the GP) together with a prescription for a recommended LD antibiotic (amoxicillin, azithromycin, cefotaxime, ceftriaxone, cefuroxime, doxycycline or penicillin G) recorded by the GP on the same day,
patients with a medical code for a laboratory LD test (online supplementary table), comprising the type of LD laboratory test and/or a qualitative test result, separated into those recorded with a positive result, an equivocal result, or an unspecified result, together with a prescription for a recommended LD antibiotic recorded by the GP on the same day.
Supplemental material
To obtain free text on LD and ECM from the medical notes, an electronic search for the following key words was made in the CPRD: lyme, eryth mig, eryth chron migr, borreli, borrelli, boreli and borelli. The 20 words before and after the key word were extracted and anonymised by CPRD. Since treatment in secondary care is usually missing in CPRD, intravenous antibiotic use was assessed by searching anonymised medical notes. The free text of all potential cases from criteria (ii) and (iii) above was reviewed manually by two reviewers (both MDs) independently using a reiterative approach consisting of three steps. First, the reviewers allocated the medical notes into (i) clinically diagnosed LD or ECM, (ii) suspected LD/ECM or an LD-specific laboratory test and (iii) no evidence of LD/ECM or insufficient information. In a second step, all medical notes with a non-concordant assessment were reviewed again by the same reviewers independently and without knowledge of the previous assessment. This procedure was repeated a third time. This resulted in a total concordance of 99.4%. The discrepancies in the categories to which events were allocated had been evaluated until a final assessment was agreed. Potential cases were allocated to ‘clinically diagnosed LD’, ‘suspected LD’ or ‘no LD diagnosis or insufficient information’.
The first LD recording was identified to define an episode of LD as a set of one or more recordings meeting any of the above criteria whereby consecutive recordings were less than 365 days apart. To ensure that a single infection was not counted more than once multiple episodes of LD for any one patient were only counted if there was a gap of more than 365 days between consecutive recordings.
The LD cases were classified into three categories as follows (figure 1):
’clinically diagnosed LD’ consisting of (i) a medical code for LD or ECM, (ii) clinically diagnosed LD or ECM in free text together with a secondary care encounter and (iii) clinically diagnosed LD or ECM in free text together with antibiotics on same day,
‘treated suspected LD’ consisting of (i) a positive LD laboratory test together with antibiotics on same day and (ii) suspected LD or ECM in free text together with antibiotics on same day and
‘treated possible LD’ consisting of an LD laboratory test with (i) equivocal or (ii) unspecified result together with antibiotics on same day.
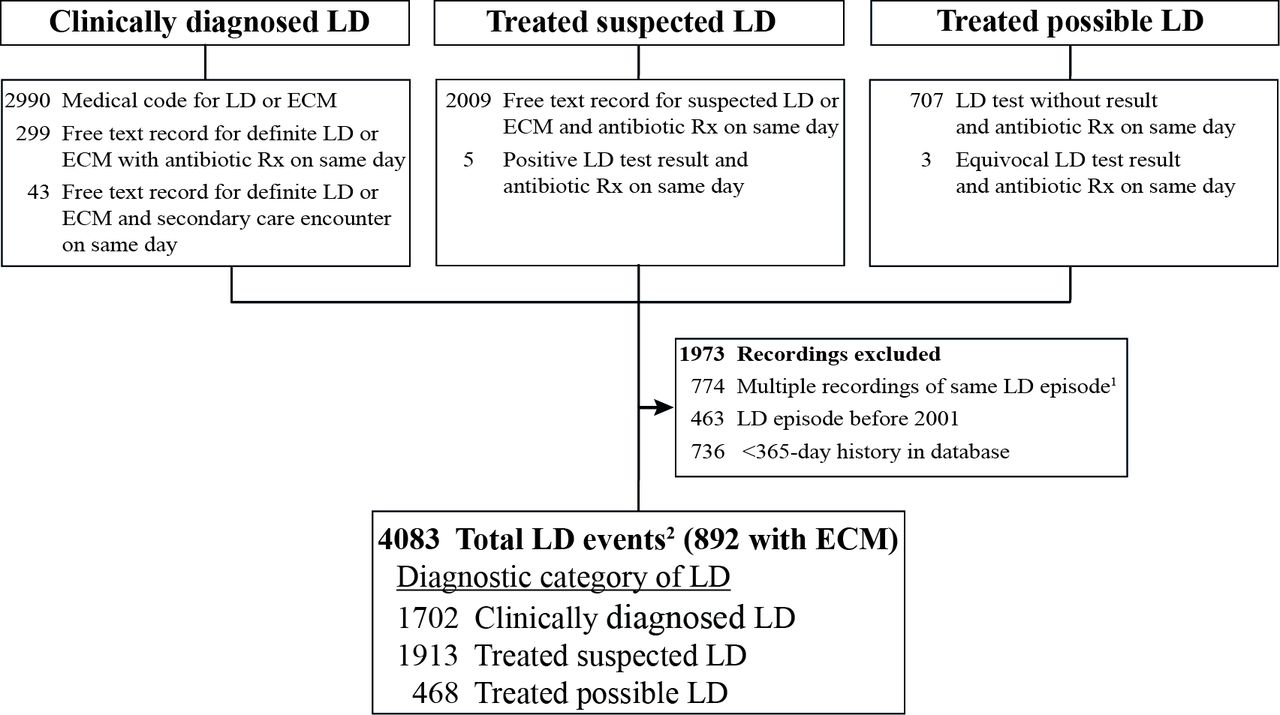
Diagnostic category of cases of Lyme disease between January 2001 and December 2012. 1: Subsequent recordings within 365 days after a previous LD recording have been considered as a continuous episode of LD. 2: A unique diagnosis group was determined for each episode of LD, using the highest rated diagnosis within the LD episode (applying the given hierarchy). ECM, erythema chronicum migrans; LD, Lyme disease; Rx, prescription.
The observational period for each patient started 1 year after the patient’s current registration with the CPRD database or at the beginning of the study period on 1 January 2001, whichever occurred last. The observational period for each patient ended on the first of the following events: end of the study period on 31 December 2012, patient died, patient transferred out of GP practice or data collection of practice ended.
Data analysis
All analyses were descriptive. Annual regional incidence rates with 95% CI were estimated based on the Poisson distribution from the observed number of LD cases in a region divided by the total person-years of individuals registered in the participating GP practices in that region. The number of LD cases in a region was then estimated as the observed incidence rate times the total number of inhabitants in that region. The population statistics for each geographic region were obtained from the UK Office for National Statistics.9 Some of the healthcare regions were combined to ensure a sufficiently large population for yearly estimates by region.
Two sensitivity analyses were run: (1) for patients with use of recommended antibiotics within 30 days after a positive, equivocal or unspecified LD laboratory test and (2) for patients with recommended antibiotics in the 30 days before a laboratory test.
All analyses were performed using Stata MP V.14.1 (Stata). The study protocol was approved by the Independent Scientific Advisory Committee for CPRD research, protocol number 13_210R (online supplementary file).
Supplemental material
Patient and public involvement
Patients and the public were not involved in this research.
Results
Altogether 4083 cases of LD were detected among 4025 patients in the CPRD between 2001 and 2012. Only 56 of the 4025 patients (1.4%) appeared to have had more than one LD infection. Of those, 54 patients had exactly one LD reinfection and two had exactly two reinfections, that is, a total of 58 reinfections, based on our 365 day reinfection blocking-time-window.
Of the 4083 cases, 892 (21.8%) had a record of ECM, 1702 (41.7%) had ‘clinically diagnosed LD’, 1913 (46.9%) were in the category ‘treated suspected LD’ and 468 (11.5%) had ‘treated possible LD’ (figure 1 and table 1). Nearly one quarter of all cases were aged under 30, 53.2% were female and half of the diagnoses were made in the summer months. Of the 4083 cases, 3470 (85.0%) had a recording of a GP prescription for antibiotics at their first visit meeting the LD criteria. Of those treated 87.3% received doxycycline or amoxicillin (table 1). LD was detected in every region of the UK with the largest number of cases in Scotland followed by South Central and South West England (table 1 and figure 2). Among the 4083 LD cases detected in this study, 1677 (41.1%) had at least one recording of an LD laboratory test, with an average of 1.4 tests among those tested. Altogether 9045 LD laboratory tests were recorded in the CPRD during this time, which corresponds to an estimated 1 07 390 tests in those 12 years, ranging from 1356 tests in 2001 to 15 342 in 2012.

Incidence rates of Lyme disease per 100 000 per year by region, 2010–2012. Incidence rates may vary across different parts of a region.
Cases of Lyme disease by gender, age group, season of diagnosis and region
The number of cases increased 10-fold from 60 in 2001 to 595 in 2012, with a steady increase over the 10 years up to 2012 (table 2). The estimated annual incidence rate and number of cases per year in the UK, as well as results by region over 2010–2012 are given in table 2. In 2012, the estimated number of cases in the UK was 7738, and the overall incidence rate was 12.1 per 100 000 persons per year, but this varied considerably across regions. The incidence rate in 2010–2012 combined ranged from 37.3 per 100 000 persons per year in Scotland to 6.0 per 100 000 persons per year in Wales. In some regions, the incidence fluctuated or levelled off over the 4 years 2009–2012, while in other regions (South, North and Wales) it continued to rise (figure 3). The incidence increased from 2003 to 2009 in all three categories of diagnosis, but from 2009 to 2012, the number of treated suspected cases increased by 32.3% while the number of treated possible cases increased by only 13.5% and the number of clinically diagnosed LD cases decreased by 4.7% (figure 4).

Estimated number of cases of Lyme disease in each region per calendar year South=South Central+South East Coast; East England=East+ East Midlands; North=North West+North East+Yorkshire and The Humber+Northern Ireland.

Estimated number of cases of Lyme disease in the UK per calendar year.
Estimated incidence rate of Lyme disease and total number of cases in the UK
Sensitivity analyses indicated that allowing a time window of ±30 days for the antibiotic prescription around the date of coding of a laboratory test would have increased the number of cases by 13.9% in our study cohort and by 14.0% in our overall UK estimate. The age, sex, season and region distribution of LD cases in the sensitivity analyses was consistent with their distribution in the main analysis.
There were 437 patients (10.9%) who had at least one additional recording of LD between 29 and 365 days after the initial LD diagnosis. The median time between the initial LD recording and the first subsequent LD recording was 50 days. Twenty-five per cent of the patients had a subsequent recording between 29 and up to 38 days after the initial LD recording. Another 25% of the patients had a subsequent recording at least 84 days after the initial LD recording. Of the 437 patients who had a subsequent recording of LD within 365 days, only 2 (0.5%) received intravenous ceftriaxone treatment at the time of their subsequent recording. Overall, 14 (0.3%) of the patients in this study had a record of intravenous antibiotic treatment, which is consistent with treatment for late stage LD.
Discussion
Summary
This is the first epidemiological study in the UK on the temporal trends of LD estimated from primary care data. The number of LD cases recorded by GPs increased rapidly over the years 2001– 2012, leading to an incidence rate of 12.1 per 100 000 persons per year and an estimated total for the UK of 7738 in 2012. The incidence rate was highest in Scotland, possibly due to the more moist environment suitable for ticks, the popularity of Scotland for walking and an increased awareness there of LD. This is followed by high rates in South West and South England, but LD was diagnosed in every region of the UK. From 2009 to 2012, the number of treated suspected cases continued to increase, unlike the number of clinically diagnosed LD cases, suggesting greater caution among the GPs and willingness to treat the illness early before confirming the diagnosis. Greater caution by GPs is reasonable as rapid treatment is important to avoid long-term problems. The NICE guideline states that symptoms of LD may take months or years to resolve even after treatment, and that some symptoms may be a consequence of permanent damage from infection. NICE writes that prompt antibiotic treatment reduces the risk of further symptoms developing and increases the chance of complete recovery.7 The increase in laboratory testing may be in part due to the increased awareness of LD as a result of the increased media coverage in recent years. However, a meta-analysis of studies looking at laboratory testing of LD showed relatively high rates of false negative laboratory results and false positive results, and the authors concluded that a negative result cannot be taken as evidence of lack of LD infection.10 The NICE guideline also mentions the limitations of testing and states that doctors should explain to their patients that both false positive and false-negative results can occur.7
Strengths and limitations
A major strength of this study was the availability of a very large GP database with anonymised medical notes covering all UK regions and broadly representative of the UK population. Currently, the CPRD no longer collects medical notes, and without the medical notes, we would have detected 53% (2174 of 4083) fewer cases of LD. As shown in table 2, the number of diagnosed cases increased over the years, leading to a nearly tenfold difference between 2001 and 2012. If the number of cases has continued to rise since the end of the study period, as suggested in the study by Tulloch et al in 2019,11 then the number in the UK in 2019 could be over 8000.
The prevalence of ECM among LD cases was 21.8%. This is similar to the 25% of cases with an ECM in the original study in which LD was first identified.12
LD was identified from a detailed algorithm to reflect the difficulties in diagnosing LD. The algorithm was based on medical codes, anonymised medical notes, lab tests and time-related antibiotic use. A relatively large proportion of diagnoses were only found in the medical notes. Furthermore, LD may be diagnosed and treated by a specialist, in which case the diagnosis would be missing if not recorded by the GP. Distinguishing the clinically diagnosed LD diagnoses in the medical notes from suspected LD or dismissal of LD can be difficult, so a conservative approach was taken requiring in addition a secondary care encounter or an antibiotic prescription on the same day. This means that cases of LD entered in the free text but with an antibiotic prescription on a different day would not have been detected, leading to an underestimate of the number of cases. On the other hand, some of the suspected cases in this study may not have had LD even though they were given antibiotics on the same day, leading to an overestimate of the number of cases.
A conservative approach was also taken with the laboratory test data by counting only patients with a positive, equivocal or unspecified laboratory test and an antibiotic prescription on the same day. Therefore, any cases prescribed antibiotics on a different day would not have been detected, again leading to an underestimate of the number of cases. Sensitivity analyses indicated that allowing a time window of ±30 days for the antibiotic prescription around the date of coding of a laboratory test would have increased the number of cases by 13.9%.
There are also limitations with regard to the assessment of antibiotic treatment: missing information on in-hospital medication could have led to underestimation of antibiotic treatment, but, on the other hand, antibiotic treatment was part of the case definition which may have led to overestimation of the proportion of cases that were treated.
Distinguishing repeated mentioning of an LD infection from a subsequent LD infection was difficult and a conservative approach was taken requiring a new infection of LD to be at least 365 days after the latest report from the previous diagnosis.
If it is caught early, most cases of LD can be treated successfully within 4 weeks. It is therefore possible that some of the 437 patients with a second LD recording between 29 and 365 days later may have had successful treatment and then a second LD infection. Sensitivity analyses showed that using a time window of 28 instead of 365 days for concatenation of LD episodes would have resulted in an additional 230 calculated cases in the UK in the year 2012, on top of the calculated 7738, which reflects a potential underestimation of the incidence of LD of up to 3%.
The CPRD may not be representative of all practices in the UK based on geography and size,8 but this should not have affected our estimates, which are based on rates calculated by region from the participating GP practices.
Comparison with existing literature
The estimate of 7738 new cases in 2012 exceeds the previous estimate of 2000–3000 per year6 which, due to the lack of other sources, was restricted to data from centralised reporting and laboratory testing. Centralised reporting of LD seems to elicit only a fraction of the true number of cases. The US CDC obtain reports of only about 30 000 cases per year5 which is one-tenth of their estimate based on claims and survey data.13 Similarly, the estimated annual number of cases in Germany based on reported cases14 is one eighth the estimate based on claims to a German health insurance company.15 In Scotland, centralised reporting resulted in around 200 cases per year16 while this study estimated 1976 per year in 2010–2012, again a difference by a factor of 10. Counting only the number of LD cases recorded by specialised laboratories will also lead to an underestimate. The annual number of positive laboratory diagnoses of LD in England and Wales is under 1000,11 but this excludes clinically diagnosed cases with erythema migrans rash, other clinically diagnosed and treated cases, suspected and treated cases, and cases with a negative test result within 4 weeks of infection who are not sent for further laboratory investigation. Public Health England assumes there are another 1000–2000 cases per year diagnosed and treated on the basis of clinical features only.17 Furthermore, there are problems with false negative LD laboratory tests in the early stages. Among patients with LD, about 70% of tests are negative at 2 weeks after the tick bite, and about 20% are negative at 6 weeks after the tick bite18 and with early neuroborreliosis.6 Also, antibiotic or immunosuppressant treatment may abrogate the immune response and can explain a negative test result.19 The incidence rates and total number of LD cases derived from laboratory-confirmed LD will depend on the subset who undergo testing and may be underestimated, and the subset may not be fully representative of the population infected with LD. The approach taken in this study by including suspected treated cases is consistent with that of studies of claims data in the USA and Germany where claims for treatment must be accompanied by a diagnosis.
The age distribution of the cases in this study is very similar to that seen in the LD surveillance study in England and Wales.20 In contrast to the USA, where nearly 57% of LD cases are male,13 there is a slight preponderance of females in Europe, ranging from 54% to 60%,21 which is consistent with the 53.2% seen in our study. Any differences between countries in the observed incidence rate and in the age and sex distribution of LD cases could be due to differences in the distribution of ticks, in the proportion of ticks infected with LD and also to differences in people’s occupations and leisure activities and the public awareness of LD.2
Implications for research and or practice
LD is seen in every region of the UK. Infected ticks can be transported by migrating birds,22 so patients can be infected with LD wherever the habitat is suitable for ticks that carry Borrelia.23 Furthermore, an estimated 15%–20% of laboratory-confirmed LD infections seen in the UK were caught abroad.6 The best defense against LD is through preventive measures such as avoiding dense vegetation particularly wooded or grassy areas with moist and humid environments, use of tick repellents and pesticides on skin and clothing, tucking trousers into socks and searching the body for ticks after potential exposure.24 Other sources of data will need to be explored for the incidence of LD in the UK since 2012 and in the future. LD mimics many other disorders and so inevitably some LD cases remain undiagnosed.
Conclusion
The incidence of LD in the UK is about threefold higher than previously estimated, and people are at risk throughout the UK. These results should lead to increased awareness of the need for preventive measures. Greater awareness of the risks may also lead to more rapid diagnosis and treatment which is important to prevent long-term morbidity.
References
Supplementary materials
Press Release
Press Release
- Press_release.docx -
Press Release
- Press_release.docx -
Footnotes
Contributors Conception or design: VC, CM, CW and SR. Data acquisition and analysis: VC, CM, CW and SR. Data interpretation: VC, CM, CW and SR. Drafting of the manuscript: VC and CM. Critical revision of the manuscript for important intellectual content: VC, CM, CW and SR. Final approval of the version to be submitted: VC, CM, CW and SR. Responsibility: CM takes full responsibility for integrity of data and analyses.
Funding The authors have not declared a specific grant for this research from any funding agency in the public, commercial or not-for-profit sectors.
Competing interests CM, SR and CW are employees of the Institute for Epidemiology, Statistics and Informatics GmbH. The Institute for Epidemiology, Statistics and Informatics GmbH has received grants from Bayer, Bristol-Myers Squibb, CSL Behring and Merz Pharma outside the submitted work.
Ethics approval The study was approved by the Independent Scientific Advisory Committee for CPRD for Clinical Practice Research Datalink research (research No 13_210R). No further ethics approval was required for the analysis of the data. The CPRD Group has obtained ethical approval from a multicentre research ethics committee for all purely observational research using CPRD data, namely, studies that do not include patient involvement (the vast majority of CPRD studies).
Provenance and peer review Not commissioned; externally peer reviewed.
Data sharing statement The study data were extracted from the Clinical Practice Research Datalink (CPRD). CPRD data cannot be shared because of licensing restrictions.
Patient consent for publication Not required.
Map disclaimer The depiction of boundaries on the map(s) in this article do not imply the expression of any opinion whatsoever on the part of BMJ (or any member of its group) concerning the legal status of any country, territory, jurisdiction or area or of its authorities. The map(s) are provided without any warranty of any kind, either express or implied.