Article Text

Abstract
Purpose The University of Surrey-Lilly Real World Evidence (RWE) diabetes cohort has been established to provide insights into the management of type 2 diabetes mellitus (T2DM). There are 3 areas of study due to be conducted to provide insights into T2DM management: exploration of medication adherence, thresholds for changing diabetes therapies, and ethnicity-related or socioeconomic-related disparities in management. This paper describes the identification of a cohort of people with T2DM which will be used for these analyses, through a case finding algorithm, and describes the characteristics of the identified cohort.
Participants A cohort of people with T2DM was identified from the Royal College of General Practitioners Research and Surveillance Centre (RCGP RSC) data set. This data set comprises electronic patient records collected from a nationally distributed sample of 130 primary care practices across England with scope to increase the number of practices to 200.
Findings to date A cohort (N=58 717) of adults with T2DM was identified from the RCGP RSC population (N=1 260 761), a crude prevalence of diabetes of 5.8% in the adult population. High data quality within the practice network and an ontological approach to classification resulted in a high level of data completeness in the T2DM cohort; ethnicity identification (82.1%), smoking status (99.3%), alcohol use (93.3%), glycated haemoglobin (HbA1c; 97.9%), body mass index (98.0%), blood pressure (99.4%), cholesterol (87.4%) and renal function (97.8%). Data completeness compares favourably to other, similarly large, observational cohorts. The cohort comprises a distribution of ages, socioeconomic and ethnic backgrounds, diabetes complications, and comorbidities, enabling the planned analyses.
Future plans Regular data uploads from the RCGP RSC practice network will enable this cohort to be followed prospectively. We will investigate medication adherence, explore thresholds and triggers for changing diabetes therapies, and investigate any ethnicity-related or socioeconomic-related disparities in diabetes management.
- DIABETES & ENDOCRINOLOGY
- PRIMARY CARE
This is an Open Access article distributed in accordance with the Creative Commons Attribution Non Commercial (CC BY-NC 4.0) license, which permits others to distribute, remix, adapt, build upon this work non-commercially, and license their derivative works on different terms, provided the original work is properly cited and the use is non-commercial. See: http://creativecommons.org/licenses/by-nc/4.0/
Statistics from Altmetric.com
Strengths and limitations of this study
A large cohort of people with type 2 diabetes was defined that has a higher level of data completeness than other similar observational cohorts.
The cohort comprises a distribution of ages, socioeconomic and ethnic backgrounds, diabetes complications, and comorbidities.
The network of primary care practices from which data were included comprise volunteer practices which may not be fully representative of the national management and outcomes in people with type 2 diabetes.
Data analysis using this cohort will be observational and therefore limited by the nature of observational studies.
Introduction
Type 2 diabetes mellitus (T2DM) is a growing problem worldwide and is associated with an increased risk of cardiovascular disease and mortality.1–4 Many glucose-lowering agents have become available in recent years including three new classes of medication: dipeptidase IV (DPP4) inhibitors, glucagon-like peptide 1 (GLP1) receptor agonists and sodium glucose co-transporter 2 inhibitors. With the addition of these newer therapies, the management of T2DM has become more complex.5–7 With this increasingly complex array of therapies, it is more important than ever to scrutinise the relative clinical effectiveness of different drug classes in the real-world setting.8 ,9 Selecting optimal second and third line glucose-lowering therapies has become difficult for clinicians as there is limited evidence to support the use of one therapy over another in clinical practice.10 ,11 While the newer agents have demonstrated blood glucose-lowering efficacy in clinical trials and good cardiovascular safety profiles (and even potential cardiovascular benefit with empagliflozin and liraglutide),12–17 their effectiveness in the real-world setting should be monitored, particularly as patient profiles often differ from those included in trials.11
We have identified a large, real-world cohort of people with T2DM which we will use to investigate three important components of diabetes management in clinical practice: (1) medication adherence and persistence, (2) thresholds for changing therapies (in particular treatment intensification), and (3) socioeconomic and ethnic disparities in management:
Adherence and persistence are thought to differ markedly between the clinical trial setting and routine clinical practice. Adherence also declines with increasing complexity of treatment.18 ,19 Reduced medication adherence is associated with poorer glycaemic control,20–23 increased hospital admissions24–27 and increased mortality.26 ,28 Using the cohort described here, we aim to quantify the level of medication adherence to newer and older therapies in the real-world setting.
Glucose control in clinical practice is frequently suboptimal.29 A key factor contributing to this is delay in treatment intensification of glucose-lowering therapy in real-world practice (termed clinical inertia). Despite clinical inertia being identified nearly 10 years ago,30 ,31 the most recent studies do not show any move towards earlier intensification of treatment.32 This may be partially due to patients' and providers' reluctance to initiate injectable therapies,33 and partially due to concerns that glycaemic targets are not always achieved even with addition of insulin.34 ,35 We also intend to use this cohort to further explore factors which predict treatment intensification and to attempt to identify modifiable clinical factors which may delay or prevent good glycaemic control through treatment intensification. In the UK, the Quality and Outcomes Framework (QOF), an annual reward and incentive programme for general practitioners, sets targets for the management of diabetes (and multiple other conditions and aspects of care).36 We will also identify the impact of the changing QOF glycaemic control targets on treatment intensification.
In our preliminary analyses, we have identified some disparities in medication prescriptions37 and medication adherence across socioeconomic and ethnic groups. We intend to use this cohort to explore these potential disparities further.
The cohort described here has been identified using routinely collected data from primary care centres in England. Electronic health records in the UK are coded using Read codes. This system enables coding of information including patient demographics, medical conditions, test results, processes of care and other important healthcare-related data. However, these data have some limitations, and in diabetes in particular, people are often misclassified or miscoded.38 ,39 QOF targets in primary care, based on clinical codes, have improved clinical coding but difficulties in correct identification of people with diabetes remain. We describe the methods used to minimise the impact of coding limitations and to identify a cohort of people with T2DM. We also describe the characteristics of this T2DM population.
Cohort description
The cohort comprises all adults with T2DM identified from practices participating in the Royal College of General Practitioners Research and Surveillance Centre (RCGP RSC) network. This data set consists of data collected from 130 primary care practices across England, with ongoing recruitment of practices. The RCGP RSC network comprises 1.7% of all primary care practices in England (N=7779).40 Only people who were alive and registered with their current practice on 31 July 2015 have been included for analysis. People who were under 18 years old on this date were excluded from the cohort.
We use a two-step informatics ontology-based process to identify people with T2DM. Initially all people with diabetes were identified using a combination of clinical codes (see below). People were then subcategorised into diabetes type 1, type 2 or other, using a seven-step algorithm. We have used all available electronic patient records prior to 31 July 2015 to identify the cohort. Ongoing data uploads from the participating practices will provide prospective follow-up data.
Method for identification and classification of the cohort
Step 1: identification of people with diabetes
People with diabetes were identified using a combination of diagnostic codes, investigation results and medication codes. We have used all commonly recorded, major diagnostic codes, as well as process of care codes for the diagnosis of diabetes (see online supplementary table S1) and excluded codes specific to gestational diabetes, steroid-induced diabetes or other forms of secondary diabetes.
supplementary table
Investigation results included both blood glucose and glycated haemoglobin (HbA1c) measurements. Glucose ‘Read codes’ were stratified by test provenance (fasting, random, glucose tolerance test, unknown or other) using a categorisation system that we have previously described.41 Individuals were included if they had two or more recorded glucose values which met the diagnostic criteria for diabetes (≥7.0 mmol/L for fasted samples and ≥11.1 mmol/L for random samples; samples taken at 2 hours, postglucose load, as part of a glucose tolerance test, or where the provenance of the test was unknown).42 Individuals were also included if they had two or more measurements of HbA1c above the diagnostic threshold; ≥48 mmol/mol (6.5%).43 Individuals with a single laboratory measurement consistent with diabetes were not included unless they met one of the other criteria for diabetes. Finally, people were also included in the diabetes cohort if they had been prescribed oral hypoglycaemic agents (except metformin) or if they had been prescribed insulin (on at least two occasions) or GLP1 analogues.
Step 2: classification of diabetes
Once identified as having diabetes, we categorised people as either type 1 diabetes mellitus (T1DM) or T2DM using the algorithm shown in figure 1. Given the occasional inaccuracy in clinical recording of diabetes type, the first three steps of this categorisation algorithm allows over-riding of diagnostic codes where clinical characteristics are highly likely to indicate a specific type of diabetes:

Seven-step algorithm for categorising type of diabetes. 1Excluding prescriptions for metformin. BMI, body mass index; OHA, oral hypoglycaemic agent.
Step 1: If the person had insulin initiated before age 35 and no oral agent use ever recorded (except metformin), they are categorised as having T1DM.
Step 2: If on multiple oral hypoglycaemic agents, the person is categorised as T2DM.
Step 3: If on one or more oral hypoglycaemic agent, excluding metformin, for more than 12 months and no history of insulin use, the person is categorised as T2DM.
If none of these criteria are met, then step 4 searches for diagnostic codes with no evidence of conflict; if all clinically entered codes are consistent with either T1DM or T2DM, then the person is categorised accordingly. Occasionally, people are coded as having both T1DM and T2DM and so would be considered to have a conflicting code type. If there are no recorded diagnostic codes or codes are conflicting, then the algorithm proceeds through steps 5–7:
Step 5: If there is no documented insulin use in the entire clinical record, then the person is categorised as T2DM.
Step 6: If prescribed oral hypoglycaemic agents for more than 12 months, then the person is categorised as T2DM.
Step 7: If the body mass index (BMI) measured nearest to the time of diagnosis is ≥25 kg/m2, then the person is categorised as T2DM.
If the type of diabetes is not identified by these steps, then the type is categorised as ‘undetermined’. People with an undetermined diabetes type will not be included in any subsequent analyses. We report the absolute rate of diabetes in the population and age–gender direct standardised rate, adjusted using the 2011 UK census.44
Method for describing the cohort
We describe the demographic, social and clinical characteristics of the identified cohort. The demographics of people included in the cohort are reported using descriptive statistics; age (as of 31 July 2015), gender and ethnicity. Ethnicity recording in primary care is limited with between 44.5% and 75.4% ethnicity recording in diabetes populations.45 Ethnicity identification was therefore extended using an informatics ontology which uses a combination of ethnicity codes and codes which infer ethnicity (such as area-specific languages).46 All inferential codes were checked for consistency with definitive ethnicity codes (>0.85 positive predictive value for ethnic group). We are due to report this ethnicity identification algorithm elsewhere (results under peer review). The distribution of deprivation scores is also reported. This was calculated at the point of data extraction, from patient postcode, using the index of multiple deprivation (IMD).47 Higher values for IMD score represent a greater level of socioeconomic deprivation.
The key baseline clinical characteristics of the cohort were also defined (using an ontological approach where appropriate) and are also reported; smoking status, alcohol use, BMI, HbA1c, blood pressure, cholesterol and renal function (estimated glomerular filtration rate). Smoking status and alcohol use are reported using the most recently recorded values. Similarly, BMI, HbA1c, blood pressure and cholesterol measurements are reported using the most recently recorded value. Where data on BMI were missing, we have calculated BMI from the most recent weight and height measurements. We report the number of people with missing data for all variables.
Duration of diabetes at the start of follow-up is also reported. This has been defined as the time since the first diabetes defining event. These events comprise: first diabetes diagnostic code, first investigation result consistent with diabetes or date of first prescription of glucose-lowering medication. We use the duration of diabetes to identify a recent onset population (those with a diagnosis of T2DM for <2 years) and report the characteristics of this subset separately. This subset of newly diagnosed people with T2DM will enable a prospective analysis of current trends in early management.
Clinical codes were also used to define the presence of comorbidities and diabetes complications; hypertension, atrial fibrillation, angina, myocardial infarction, congestive heart failure, stroke, transient ischaemic attack, chronic kidney disease (stages 3–5), current renal replacement therapy, dementia, depression, previous amputation, peripheral neuropathy, retinopathy (all stages), peripheral vascular disease, rheumatoid arthritis, chronic liver disease (all causes) and non-alcoholic fatty liver disease (NAFLD).
Cohort characteristics
A total of 1 260 761 people were included from 130 primary care practices. In total, 1 015 867 were aged 18 or older on 31 August 2015. From these, 63 465 (6.25%) people were identified as having any type of diabetes. The majority of these (58 717; 91.8%) were categorised as most likely to have T2DM, and a minority T1DM (4478; 7.62%) or not categorised (270; 0.43%) (figure 2). The crude prevalence of T2DM in the adult population was 5.78% and direct standardised prevalence (using the 2011 UK census44) similar at 5.78% (95% CI 5.72% to 5.82%).

Seven-step algorithm for categorising type of diabetes. The number of people classified at by each step is shown. 1Excluding prescriptions for metformin. BMI, body mass index; OHA, oral hypoglycaemic agent.
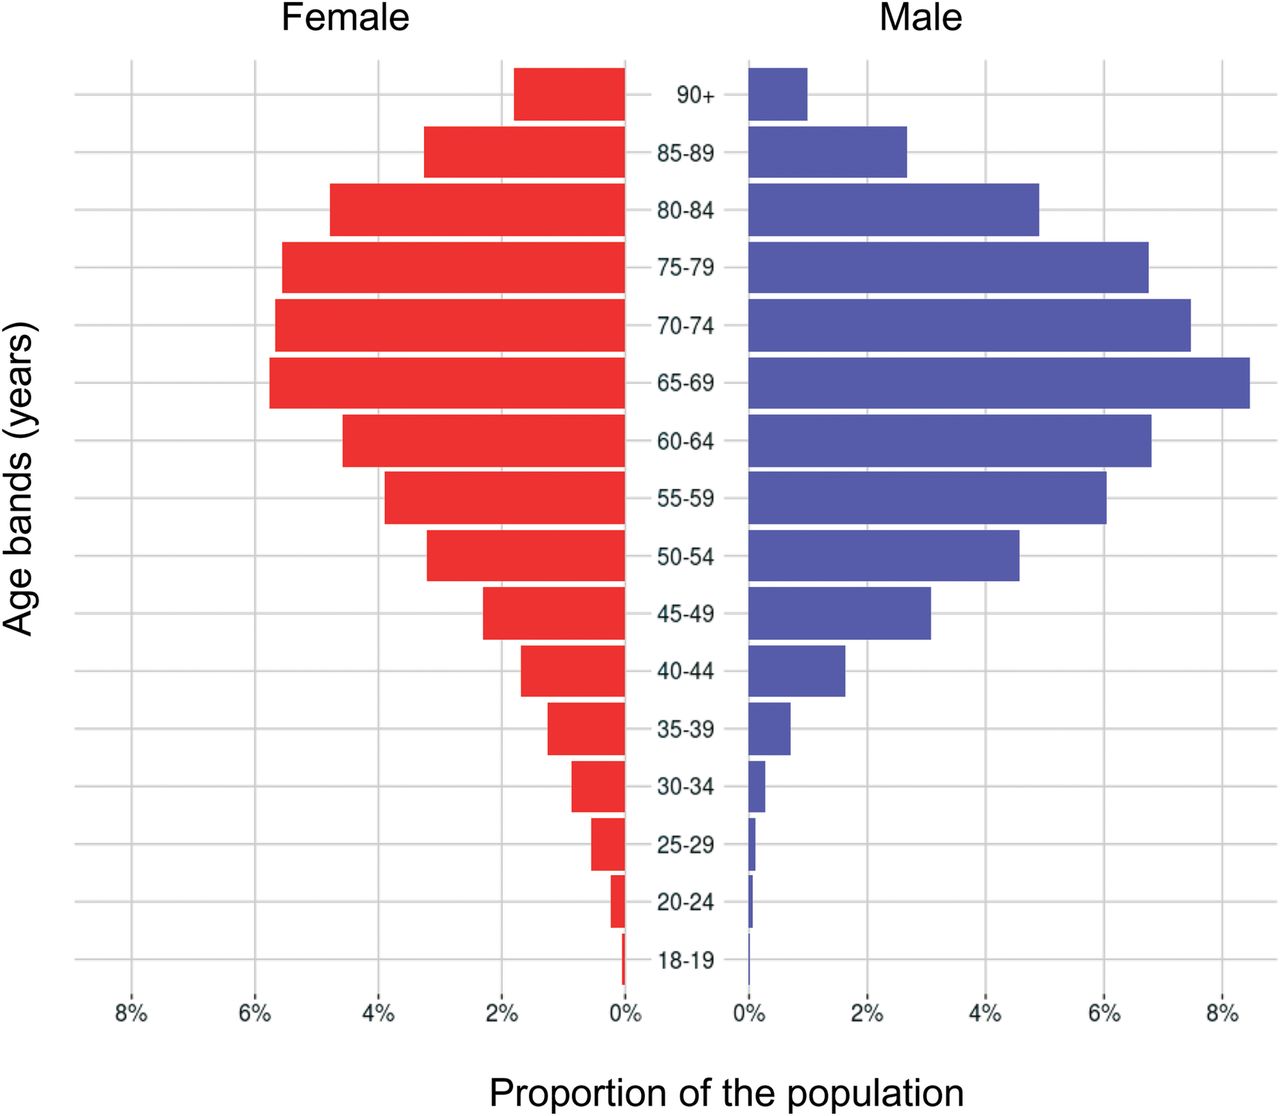
The mean age of the T2DM cohort was 66.2 (SD 14.1) years and 26 706 (45.4%) were female (table 1). The age and gender distribution is shown in figure 3. The crude prevalence of cardiovascular comorbidities was higher in adults with T2DM than T1DM; however, the age and gender standardised rates were similar (tables 2 and 3, respectively). A higher prevalence of diabetes complications (peripheral vascular disease, peripheral neuropathy, retinopathy and chronic kidney disease) were seen in people with T1DM after age and gender standardisation (table 3).
The characteristics of the complete adult population, adults with T1DM (for comparison) and adults with T2DM
The number of people with common comorbidities of the complete adult population, adults with T1DM (for comparison), and adults with T2DM
Crude and age-standardised and gender-standardised prevalence (compared with the 2011 population census) for common comorbidities of the complete adult population, adults with T1DM (for comparison), and adults with T2DM
The age and gender profile of the cohort of people with T2DM. T2DM, type 2 diabetes mellitus.
The crude prevalence of T2DM varied considerably by ethnicity: white 6.34%, Asian 9.38%, black 8.18%, mixed 5.21%, other 3.85% and no ethnicity identified 3.72%. After adjusting for age and gender, the prevalence of T2DM remained highly variable across ethnicity groups: white 5.91% (95% CI 5.85% to 5.96%), Asian 16.99% (16.48% to 17.52%), black 13.84% (13.11% to 14.65%), mixed 11.81% (10.62% to 13.46%), other 9.25% (8.10% to 10.65%) and no ethnicity identified 3.74% (3.67% to 3.81%). Clinical characteristics also vary considerably by ethnicity in people with T2DM (table 4).
Clinical characteristics of people with T2DM (N=58 717) by ethnicity group
Metformin was the most commonly prescribed diabetes medication in people with T2DM (table 5). In total, 12 284 (20.9%) people had no diabetes medication prescribed. The subset of people with recent onset (<2 years) had a lower prevalence of complications than the complete cohort of people with T2DM (table 6).
Proportion of people with T2DM (n=58 717) prescribed medications in the past 1, 3 and 10 years prior to 31 July 2015
The characteristics of people with recent onset (<2 years) T2DM
Discussion and findings to date
A large cohort (N=58 717) of adults with T2DM has been identified from the RCGP RSC population. The characteristics of this cohort are described here and compared with those of the complete adult population and a population of people with T1DM. We have identified a large burden of macrovascular and microvascular disease in our T2DM cohort and a broad range of therapies in use. This baseline analysis demonstrates high levels of data completeness in the diabetes population for a range of variables including ethnicity, smoking status, alcohol use, HbA1c, BMI, blood pressure, low-density lipoprotein cholesterol and renal function. This is higher than that reported for other T2DM populations identified from other large UK-based population databases; such as the QResearch database and the Clinical Practice Research Database (CPRD).45
Given that this T2DM cohort has a high level of data completeness, a long duration of follow-up, a range of socioeconomic and ethnic groups represented, and covers people with a range of diabetes medications and with a range of diabetes-related complications, it is ideally suited for a number of different population-based studies. The planned analyses include medication adherence and persistence, thresholds for changing therapies (in particular treatment intensification), and socioeconomic and ethnic disparities in management and outcomes.
The crude prevalence of most comorbidities was higher in people with T2DM than those with T1DM. Similar trends have been reported in a large UK-based population.48 However, most diabetes complications (peripheral neuropathy, retinopathy and amputations) were more prevalent in people with T1DM. In contrast, age-adjusted and gender-adjusted rates of comorbidities were similar between the groups. After adjustment, only hypertension remained more prevalent in T2DM, whereas the prevalence of peripheral neuropathy, retinopathy and peripheral vascular disease remained higher in people with T1DM.
Ethnic differences in diabetes prevalence are well established.49 Our data show that the T2DM prevalence has increased in all ethnicity groups when compared with UK data reported 10 years ago.50 In addition, our data demonstrate substantial variation in clinical characteristics across these groups.
Strengths and limitations
We have recently reported that the RCGP RSC population is broadly representative of the national population albeit with some oversampling of 25–44 years old, and less deprived people.51 In addition to the strengths already discussed, this subcohort of people with T2DM has the advantages of large size and of a high frequency of data uploads which enable prospective follow-up. Data are uploaded to the RCGP RSC database weekly.
An additional strength of the cohort is of high-quality recording of infectious diseases (primary care practices which comprise the RCGP RSC receive regular feedback on the quality of their recording of infectious diseases, which should ensure a high standard of recording). This has already enabled analysis of infection rates in elderly people with T2DM.52 Furthermore, many of the UK primary care pay-for-performance targets for people with T2DM include recording and monitoring of disease indicators relevant to diabetes such as HbA1c, peripheral neuropathy and renal function, which have led to the high level of data completeness reported here.
Limitations include the observational nature of the data and some residual incompleteness of recording of variables. Incomplete data recording in people with diabetes is disproportionately more common in people with poor outcomes.53 The network is also comprised of volunteer practices, which may be better at managing diabetes and related conditions or at recording these conditions than other primary care practices. Indeed we have previously reported that the included practices score more highly on pay-for-performance targets.51 Finally, while in our experience, the proportion of people with T2DM moving practices is generally small, anyone who moves to a practice which is not part of the RCGP RSC network will be lost to follow-up.
Collaboration
We encourage collaboration with researchers interested in pursuing research questions regarding the identification, management, natural history or trends in people with diabetes which can be addressed using this large observational data set either prospectively or retrospectively. The database can be made available to researchers on a case-by-case basis and is subject to ethical approval for each study by the National Health Service (NHS) Research Ethics Committee. The policy of the RCGP is that patient-level data must remain within the secure network at the University of Surrey. Direct access for interested researchers can be arranged subject to the information governance standards of the University of Surrey, alternatively aggregated data can be provided. We encourage interested researchers to attend the short courses on how to analyse primary care data offered by the university biannually.
Conclusion
We have devised methods to optimise the identification of diabetes and diabetes subtype from the routine data collected. The large population of people with T2DM identified from the RCGP RSC cohort provides an excellent opportunity to use real-world evidence to explore the clinical use and impact of newer diabetes therapies in clinical practice, and observation of the clinical management of T2DM in practice. We encourage collaborative use of this data set with interested researchers.
Acknowledgments
The authors would like to thank Dr Filipa Ferreira, project manager, for generous support throughout this project and for initiating the research collaboration; Rachel Byford and Barbara Arrowsmith, SQL developers, for their help with database management and data extraction; and all the participating practices and patients for providing the data for this cohort. The authors would also like to thank the funders Eli Lilly and Company.
References
Footnotes
Contributors AM led the analysis and drafting of the manuscript. AM and SdL conceived the paper. WH, AC, NM and MW supported the analysis. All the authors have contributed to the final manuscript.
Funding Eli Lilly and Company. Grant number (10.13039/100004312).
Competing interests The RCGP RSC is primarily funded by Public Health England and the development of the RCGP RSC data set is supported by surveillance work funded by Public Health England. The subcohort of people with T2DM identified from the RCGP RSC has been developed for a number of planned studies funded, as part of the University of Surrey-Lilly Real World Evidence (RWE) projects, by Eli Lilly and Company. AM, WH, MW and SdL are funded by Eli-Lilly and Company. SdL and AC have undertaken research funded by GlaxoSmithKline. NM has received fees for serving as a speaker, a consultant or an advisory board member for Allergan, Bristol-Myers Squibb-Astra-Zeneca, GlaxoSmithKline, Eli Lilly, Lifescan, MSD, Metronic, Novartis, Novo Nordisk, Pfizer, Sankio, Sanofi, Roche, Servier, Takeda. MW has received speaker fees from Astra-Zeneca.
Ethics approval Health Research Authority.
Provenance and peer review Not commissioned; externally peer reviewed.
Data sharing statement The RCGP RSC data set can be accessed by bona fide researchers on a case-by-case basis. Ethical approval by the NHS Research Ethics Committee is needed for data requests to be considered. Aggregated data tables may be created from the source data to allow specific analyses for approved research and surveillance projects. Researchers wishing to directly analyse the patient-level anonymised data will be required to complete information governance training and work on the data from the secure servers at the University of Surrey. Patient-level data cannot be taken out of the secure servers at the University of Surrey. The authors encourage interested researchers to attend the short courses on how to analyse primary care data offered by the university twice a year.