Article Text

Abstract
Aims: To compare differences in microbiology testing activity between general practices within and between five hospitals in two National Health Service (NHS) regions in England.
Methods: Retrospective capture of standardised microbiology testing activity from the laboratory computer databases. Six equivalent tests were identified and compared. Data were obtained for 174 general practices in eight primary care groups, served by two NHS hospital trusts and three public health laboratories. The total catchment population was 1 180 000 people. Comparative test activities were displayed graphically and differences in median test activity and the hospital activity distributions were examined by the Wilcoxon signed rank test.
Results: Median testing activity differed by 200% (urine) to 800% (wound swabs) between the trusts that performed the highest and the lowest number of tests, and from 300% to 1900% between the top and bottom 10% activity bands of general practices. Large and significant differences were found between the hospitals, irrespective of whether they belonged to the same trust, and irrespective of their geographical location.
Conclusions: Large differences in microbiology testing exist within individual trust catchment areas in primary care, and there are also considerable differences between trusts. These inequalities may also introduce a selection bias into epidemiological and antibiotic resistance surveillance. This indicates a widespread need to examine and deal with the reasons responsible for these differences.
- Appropriateness
- evidence based medicine
- microbiology
- primary care
Statistics from Altmetric.com
Recent articles in this journal1 and the British Medical Journal2 have again raised the issue of the appropriate use of pathology services and have stimulated a range of views.3–5 Although some may argue that pathology is well used in certain situations,4 we have found large differences in standardised pathology testing activity, in both primary6 and same speciality secondary (unpublished, 2000) care between users in a cohort of 22 general practices in the same trust catchment area. These differences could not be accounted for by characteristics of the general practices themselves, or by the demographics of the practice list,7 unlike indicators of morbidity and use of medical care on a wider scale.8,9 However, the extent of differences between different laboratory catchments in different geographical areas is not known.
In microbiology, diagnostic test results are also used for epidemiological and antibiotic resistance surveillance. Significant inter-user variation may introduce selection bias in establishing these data.
“The extent of differences between different laboratory catchments in different geographical areas is not known”
The National Health Service (NHS) Executive has highlighted the apparent lack of an association between population health needs and patterns of clinical referral.10–12 However, very limited data are available on this subject with regard to the use of pathology tests.
We set out to examine the extent of differences in microbiology use within primary care across a large cohort of two laboratories in the northern NHS administrative region and three laboratories in the south west region with a total catchment of approximately 1 180 000 patients. The laboratories were located in NHS general hospitals belonging to NHS acute trusts, three of which operated a single main hospital site, and one (South Durham) operated two main hospital sites.
The laboratories performed all of the laboratory work for administrative organisations of general practices (primary care groups) containing between 10 and 61 general practices.
METHODS
The northern region laboratories were situated at Bishop Auckland General Hospital (catchment population, ∼ 182 000 people; two primary care groups; 22 general practices) and Darlington Memorial Hospital (100 000 people, one primary care group, 14 general practices) (South Durham Health Care NHS Trust), and the south west laboratories at Hereford NHS Trust (159 000 people, one primary care group, 24 general practices), Truro NHS Trust (406 000 people, one primary care group, 61 general practices), and Gloucester NHS Trust (334 000 people, three primary care groups, 53 general practices). The hospitals are all located in rural or semi-rural areas, and none lies within large metropolitan catchment areas. All microbiology tests for the three trusts in the south west region were performed in public health laboratories. Six groups of microbiology tests were identified, representing approximately 90% of all microbiology tests requested in primary care for these trusts. The specific tests included in each of the categories were confirmed to ensure that the content of the different categories was consistent for each of the five hospitals. These categories were: urine (culture and/or microscopy), wound and ulcer swabs (excluding methicillin resistant Staphyloccus aureus screening specimens), genital swabs (high vaginal/endocervical swabs, excluding chlamydia), throat swabs, sputum specimens, and stool cultures. General practice specimens sent to the laboratories between 1 April 1999 and 31 March 2000 were included.
Practice capitation for the same year was used to determine practice requests for each 1000 patients for each test. Testing activity was displayed in bar charts as described previously,6 showing each individual general practice separately and identifying the different cohorts of general practices served by the five laboratories separately. The distributions of testing activity for the general practices making up each cohort were compared by means of the Wilcoxon signed rank test, and were considered to be significant at a probability value of p < 0.01. Age and sex distributions were obtained for the different laboratory catchment populations. These were expressed as percentages of the populations in the age groups 0–14, 14–44, 45–64, and⩾ 65 years old, for each sex, and were compared to establish qualitative differences between the populations. In practice, the proportions of men and women in each age band in the five laboratory catchment populations were almost superimposable. Therefore, we did not adjust the activity data for these variables. We approached the lead microbiology consultants in each of the laboratories retrospectively to attempt to identify any reasons that could account for observed differences.
RESULTS
The laboratories served a population of 1 180 000 people cared for by 174 general practices in eight primary care groups.
Activity data were available for all five laboratories for urine culture, wound swabs, genital swabs, stool cultures, and sputum cultures. Activity data for throat swabs were grouped together with other tests in two laboratories, and were therefore only available separately for three laboratories.
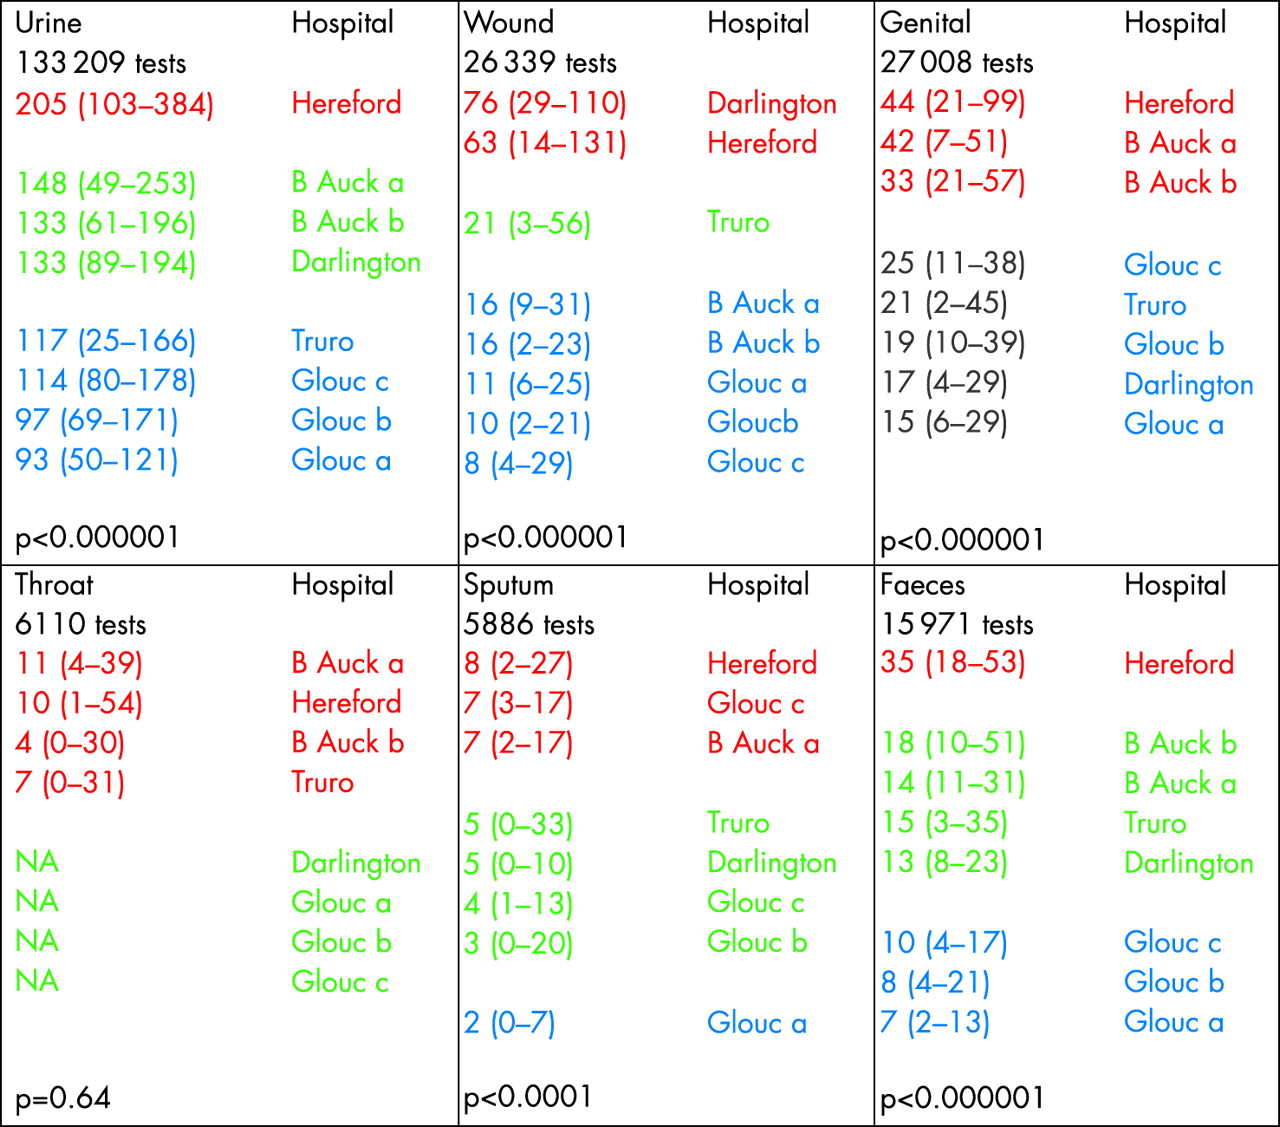
Figures 1 and 2 show the testing activities for urine microscopy and culture and for wound and ulcer swabs, respectively, displayed as bar charts. Charts for the three other tests for which activity data were available for all laboratories show a similar pattern of variation for individual practices within each of the five laboratory cohorts, as has been described previously.6 However, a clear separation is apparent between certain laboratory cohorts and was confirmed by the significance levels. Median testing activity differed by 200% (urine) to 800% (wound swabs) between the trusts that performed the highest number and the fewest number of tests, and from 300% to 1900% between the top and bottom 10% activity bands of general practices. Figure 3 shows the median test activity for the five laboratories and eight primary care groups. Some laboratories appear consistently towards one or other end of the distribution (Hereford and Bishop Auckland at the higher end and Gloucester at the lower end), although others (Darlington) appear towards the top of some distributions and towards the bottom of others, or consistently towards the middle (Truro). Activity distributions for most tests were grouped with one or two hospitals at the top, middle, and bottom of each distribution. The activity distributions between different primary care groups served by the same laboratory (Bishop Auckland, two primary care groups; Gloucester, three primary care groups) were not significantly different. Laboratory distributions in the top, middle, and lower activity groups were all significantly different from each other, apart from throat swabs, for which activity data could only be identified separately for three laboratories, and for sputum specimens, which was the lowest volume test.
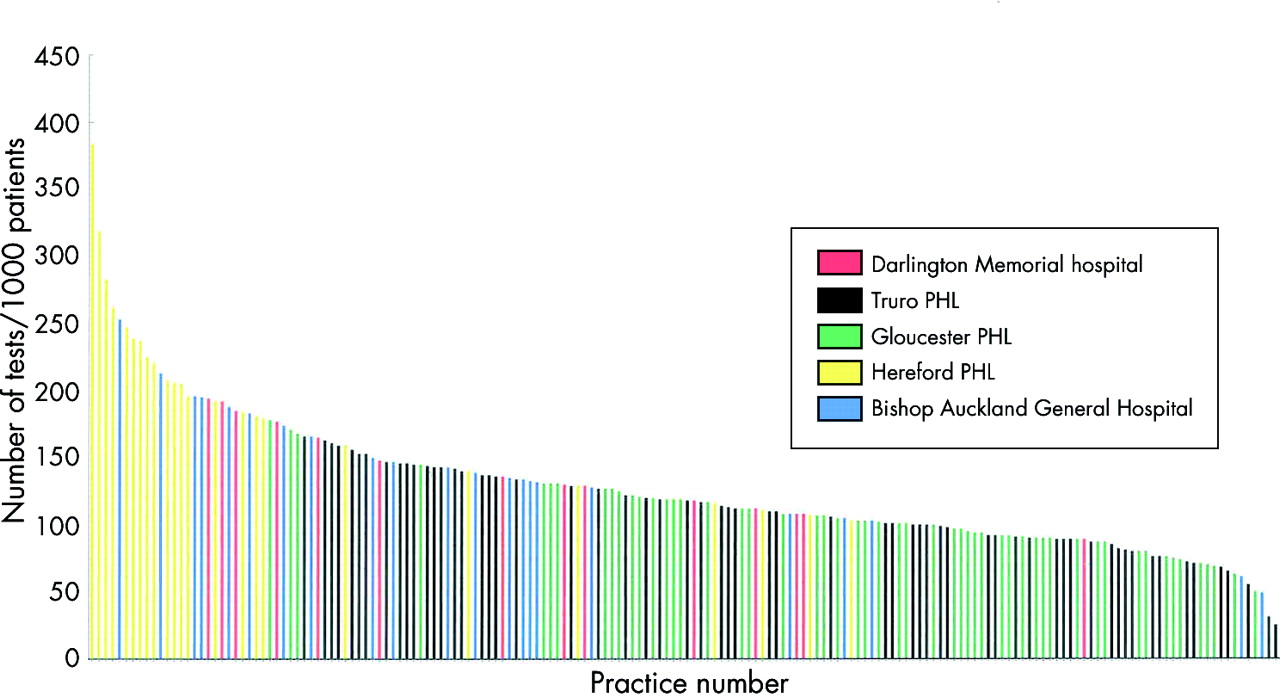
Standardised urine microscopy and culture requests from 174 general practices served by five hospitals across the south west and north east regions. Tests were performed by five laboratories shown in different colours. Each bar represents one practice and is expressed as tests/1000 list patients/year during the period 1 April 1999 to 31 March 2000.

Standardised wound/ulcer swab culture requests from 174 general practices served by five hospitals across the south west and north east regions. Tests were performed by five laboratories shown in different colours. Each bar represents one practice and is expressed as tests/1000 list patients/year during the period 1 April 1999 to 31 March 2000.
Median numbers of tests for each 1000 general practice list patients performed by five laboratories serving eight primary care groups. Primary care groups with activity distributions that are not significantly different from each other (p > 0.01, Wilcoxon signed rank test) are shown in the same colour. The suffixes a, b, or c refer to different primary care groups served by the same laboratory. NA, sputum numbers could not be identified separately for three hospitals; B Auck, Bishop Auckland General Hospital; Glouc, Gloucester NHS Trust.
There were several large differences between laboratories within the same geographical region, and between those in different geographical regions. There was no consistent pattern between the laboratories in the two regions.
We discussed the differences between laboratories with the consultant medical microbiologists in each laboratory and were unable to identify specific laboratory factors that might explain the magnitude of these differences.
DISCUSSION
Large differences exist between primary care testing activity in microbiology, both between general practices and between laboratories. The differences seen between laboratories are very similar to those that have been observed between general practices served by a single laboratory.6 The positions of individual laboratories within the group of five laboratories mirrored those of individual general practices within a single catchment area; some laboratories consistently appear at one end of the activity distribution for several tests, although the positions of others differed depending on the test.
We were surprised by the magnitude of these differences. It might be expected that the size of populations served by individual NHS trusts would dilute variations in clinical practice responsible for differences observed within an individual cohort of general practices. However, large differences were found both within and between the two NHS regions in which the laboratories were located, accentuating those seen within a single laboratory catchment area. In addition, these differences were present within the trust that operated more than one general hospital and in which, organisationally, microbiology operated as a combined directorate (Bishop Auckland and Darlington hospitals). Similar differences were also found between the laboratories in the three trusts of the south west region all served by the same public health laboratory group.
We were unable to identify factors that might explain these differences. Although differences caused by the manner in which tests are coded between laboratories could have led to slight variations in the numbers of tests included in each of our test categories, specifically wound swabs, we rechecked the content of categories after our study and identified no significant sources of mis-inclusion, and conclude that the contribution of any such source of error is small.
In addition, differences in patient demographics between general practices do not have a significant impact on standardised testing activities across a wide range of pathology tests in an individual laboratory catchment area.7 We therefore conclude that these differences probably reflect variations in clinical attitudes to testing between the cohorts.
Although our cohort contained rural and semi-rural catchment areas, local (unpublished, 2003) data collected in a metropolitan catchment area (Sunderland), in conjunction with Dr M Galloway (consultant haematologist), suggest that the variation seen in such catchment areas is similar to and lies within the range found in the neighbouring semi-rural areas, and that similar differences are seen across the disciplines of biochemistry, haematology, and microbiology, as has already been reported in a single hospital catchment area.6
Urine cultures form the largest single group of tests submitted (approximately two thirds of all primary care microbiology tests). One weakness of our study is that it cannot measure the use of near patient diagnostic tests used by primary care, although these are probably used only for urine testing, which exhibited proportionately lower variability in activity. A qualitative study within the south west13 has found that low practice users of the laboratory do make greater use of near patient tests. Primary care clinicians also empirically prescribe antibiotics, with no diagnostic tests.14 This leads to low laboratory use and is the least expensive consultation, but increases antibiotic selection pressure. Implementing guidance on the optimum use of urine near patient dipstick tests could rationalise laboratory use and contribute to more appropriate antibiotic prescribing. We await with interest the results of a large Department of Health funded study examining the value of dipsticks and microbiology laboratory tests for the management of urinary tract infection in primary care.15
Take home messages
-
There were large differences in the numbers of microbiology tests requested both within individual trust catchment areas in primary care and also between trusts
-
Large and significant differences were found between hospitals, irrespective of whether they belonged to the same trust, and irrespective of their geographical location
-
These inequalities may introduce a selection bias into epidemiological and antibiotic resistance surveillance
-
The reasons for these differences should be investigated and dealt with
“An enhanced surveillance programme with a standardised approach to testing would be a valuable way of informing empirical treatment in primary care”
The great intralaboratory and interlaboratory variation in specimen submission also indicates that we should be cautious when we use laboratory based data for primary care based disease or antibiotic resistance surveillance. One qualitative study has indicated that all clinicians usually sent specimens in more severe, recurrent, or complicated infections. Variation in laboratory use was most evident in uncomplicated cases.13 Routine laboratory generated antibiotic surveillance data will thus tend to include more complicated cases and overestimate antibiotic resistance. An enhanced surveillance programme with a standardised approach to testing would be a valuable way of informing empirical treatment in primary care.
Interpretation of test activities is limited by the fact that we do not know what the correct activity rates should be for the different tests. However, it is highly unlikely that either extremes are compatible with best practice. Therefore, an evaluation of the clinical role of diagnostic tests is urgently needed. There are also very few studies on how microbiology laboratory tests influence clinical outcome. These are also needed to inform the development of laboratory use guidance.
In view of the continuing increases in pathology activity, there is a need for a concerted approach to examine and account for differences at least in microbiology testing between laboratories on a wide scale, in addition to a need to monitor use within individual laboratories. There is evidence that targeted publications may influence change,16 although the distribution of local guidelines alone appears to be the least effective way of achieving this.17 In view of the estimated expenditure on pathology services (Bandolier estimated 4% of a £40 billion NHS budget in 199818), there is considerable potential scope to envisage large scale, in addition to local, initiatives to examine these large differences and attempt to promote change.
Acknowledgments
Thanks to our consultant microbiology colleagues in the five hospitals for their support in providing data, Mrs S Richardson (secretary Bishop Auckland) for typing the manuscript, and Mr P Gedling (Clinical Audit, Bishop Auckland) for statistical advice.
REFERENCES
Footnotes
-
Dr Smellie is a director of Morley Consulting Ltd, which provides advice to a company that, among others, has an interest in medical software development. Dr Smellie also holds shares in that company. The work in this paper was conducted before this association.