Article Text

Abstract
Background The authors consider whether differences in stage at diagnosis could explain the variation in lung cancer survival between six developed countries in 2004–2007.
Methods Routinely collected population-based data were obtained on all adults (15–99 years) diagnosed with lung cancer in 2004–2007 and registered in regional and national cancer registries in Australia, Canada, Denmark, Norway, Sweden and the UK. Stage data for 57 352 patients were consolidated from various classification systems. Flexible parametric hazard models on the log cumulative scale were used to estimate net survival at 1 year and the excess hazard up to 18 months after diagnosis.
Results Age-standardised 1-year net survival from non-small cell lung cancer ranged from 30% (UK) to 46% (Sweden). Patients in the UK and Denmark had lower survival than elsewhere, partly because of a more adverse stage distribution. However, there were also wide international differences in stage-specific survival. Net survival from TNM stage I non-small cell lung cancer was 16% lower in the UK than in Sweden, and for TNM stage IV disease survival was 10% lower. Similar patterns were found for small cell lung cancer.
Conclusions There are comparability issues when using population-based data but, even given these constraints, this study shows that, while differences in stage at diagnosis explain some of the international variation in overall lung cancer survival, wide disparities in stage-specific survival exist, suggesting that other factors are also important such as differences in treatment. Stage should be included in international cancer survival studies and the comparability of population-based data should be improved.
- Clinical Epidemiology
- Non-Small Cell Lung Cancer
- Small Cell Lung Cancer
Statistics from Altmetric.com
Key messages
What is the key question?
-
Do differences in stage at diagnosis explain wide international differences in lung cancer survival?
What is the bottom line?
-
Differences in stage at diagnosis explain some of the international variation in lung cancer survival, but wide disparities in stage-specific survival suggest that other factors such as treatment are also important.
Why read on?
-
This is the first international population-based study of lung cancer survival by stage at diagnosis and includes nearly 60 000 patients.
-
We describe how far stage explains international inequalities in lung cancer survival.
Introduction
Lung cancer remains the leading cause of cancer death worldwide.1 Survival has not improved greatly over the past three decades, and remains low for patients with all but the least invasive tumours.2 Wide international inequalities in lung cancer survival remain apparent,3 ,4 even between European countries.5
Governments monitor the implementation and efficacy of their cancer plans by comparing survival outcomes with those achieved in other countries with similar levels of economic development.6 The highest survival among such countries is a benchmark against which progress can be monitored, representing what could be attained with optimal treatment and public awareness.7 The International Cancer Benchmarking Partnership (ICBP), a consortium of clinicians, epidemiologists and policy makers, has described lung cancer survival differences between six developed countries in 1995–2007.8
Understanding why these survival differences occur will facilitate policy designed to bring survival up to the highest international standard. Stage at diagnosis is an important prognostic factor, and international population-based studies suggest that differences in stage explain some of the survival variation for several cancers, including the ICBP study for ovarian cancer.9–12 Few such studies exist for lung cancer, although stage explains some of the survival differences between Nordic countries13 and within countries over time.2 In this study, using population-based data, we investigate whether lung cancer survival differences may be attributable to differences in stage at diagnosis, reflecting delays in diagnosis or differences in staging procedures, or to differences in stage-specific survival which could indicate differences in treatment, staging or comorbidity.
Clinical trials are the gold standard for testing the efficacy of new therapies, but they usually exclude elderly, frail and socially marginalised patients. Trials cannot be used for international comparisons of the effectiveness of entire health systems to underpin public health policy: population-based data on the survival of all patients are required.
Methods
Data were originally collected for patients diagnosed during 1995–2007 and followed up to the end of 2007 in six countries: Norway, Denmark, the UK (Northern Ireland, Wales and England), Australia (New South Wales and Victoria), Canada (Alberta, British Columbia, Manitoba and Ontario) and Sweden (clinical database of the Uppsala-Örebro and Stockholm-Gotland health regions). Adults (15–99 years) diagnosed with an invasive primary malignant tumour of the lung or bronchus (ICD-10 C34.0-C34.9) were included. Patients whose tumour registration was made from a death certificate only were excluded. Details of inclusion criteria and quality control have been published elsewhere.8
Analyses were restricted to the period 2004–2007 (232 278 patients) when stage data were more complete, and further to registries where at least 50% of patients were staged, thereby excluding Ontario, Victoria, Wales and six of the eight regional registries in England. A total of 57 352 patients were finally included in the analyses.
We requested stage data in three separate fields on the extent of the tumour (T), the degree of nodal involvement (N) and the presence of metastases (M), coded to the TNM classification.14 We prioritised pathological T and N and clinical M where both clinical and pathological data were available. Norway and New South Wales provided a locally-defined stage classified as ‘local, regional, distant’.
In order to include Norway and New South Wales in the comparisons, we mapped the TNM system used in the four other countries to the US Surveillance, Epidemiology and End Results Summary Stage 2000 classification (SEER),15 which is similar to both the Norwegian and the New South Wales ‘localised, regional, distant’ classifications, but better documented and more widely known.16 This mapping was straightforward where we had information on each of T, N and M, but it was not possible for England which only provided a grouped TNM stage (I–IV). We therefore present two sets of analyses: one in which stage is categorised to the TNM classification system, which may be more relevant for clinicians but excludes Australia and Norway, and another in which stage is classified as ‘localised, regional, distant’ (SEER), which excludes England.
We examined non-small cell (NSCLC) and small cell lung cancer (SCLC) separately because of their different aetiology and clinical behaviour. NSCLC represents over 80% of lung cancers, and we included non-microscopically verified tumours in this group. NSCLCs grow more slowly and are generally more amenable to treatment, whereas SCLC is more aggressive although short-term survival can be extended with chemotherapy.
Statistical analyses
We estimated net survival and its mortality equivalent (the excess hazard) using a flexible parametric model implemented in the Stata command stpm217 (StataCorp LP, College Station, Texas, USA, web appendix para 1). Net survival (or excess hazard) is the survival (or the mortality) of cancer patients after background mortality in the general population has been taken into account. Background mortality was taken from life tables specific to sex, single year of age, region of residence and year of death.8
Analysis was first stratified by stage at diagnosis; age at diagnosis and country of residence were included as covariates and their effects allowed to vary with time since diagnosis. Non-linear effects of continuous covariates and time-dependent effects were modelled with cubic splines. Interactions between age and country were assessed with the likelihood ratio test. Final models were selected based on the Akaike Information Criterion and examination of Martingale residuals (web appendix para 2). Patients were censored 3 years after diagnosis, but we provide estimates up to 18 months after diagnosis because model stability requires follow-up beyond the last survival estimate.18
We first treated patients with missing stage as a separate category. Multiple imputation by chained equations was then conducted to include patients with missing stage in the analyses using the Stata command ice19 (web appendix para 3). We ran the imputation model 15 times and combined the results under Rubin's rules.19 We then re-estimated stage-specific survival using the 15 imputed datasets by repeating the survival analysis modelling strategy described above, and compared the range of survival estimates with the estimates for patients with known stage.
We present survival estimates by age, stage and country. All-ages estimates were standardised using stage-specific weights based on the age distribution observed across all countries (see online web appendix, tables 1 and 2).
Results
Descriptive statistics
Men represented between 52.3% (Sweden) and 62.2% (Australia) of all patients (table 1). In the UK, 26.0% of tumours were not microscopically verified compared with 5.2% in Sweden (table 1). Among microscopically-confirmed tumours, the percentage of SCLC varied from 12.9% in Australia to 18.0% in Norway. The proportion of adenocarcinomas ranged from 25.2% (UK) to 44.8% (Sweden). The age distribution at diagnosis was similar in all countries, with mean age about 70 years (table 2). Patients for whom information on stage at diagnosis was missing tended to be older (mean age about 73 years). Patients diagnosed at a more advanced stage tended to be younger than those diagnosed at an earlier stage, and older patients were more likely to be missing data on stage (see online web appendix figure 1).
Sex of patients, proportion not microscopically verified and histological subtypes
Number of patients with non-small cell lung cancer (NSCLC) and small cell lung cancer (SCLC) diagnosed during 2004–2007: country and stage at diagnosis (TNM and SEER Summary Stage 2000), before and after imputation
Stage at diagnosis
The UK had the highest proportion of patients for whom data on stage (TNM) at diagnosis were missing, both for NSCLC (30.3% vs 5.6–11.2% elsewhere) and for SCLC (38.4% vs 2.1–8.2%). The proportion was also relatively high in Australia (SEER), both for NSCLC (23.4%) and SCLC (18.6%) (table 2).
Lung cancer is generally diagnosed at an advanced stage. For NSCLC, the proportion with metastatic disease (TNM stage IV) ranged from 46.8% in Sweden to 55.0% in Denmark, or (SEER ‘distant’) from 47.5% in Australia to 61.2% in Denmark. The proportion of early stage NSCLC was lowest in Denmark and the UK.
For SCLC, 72.1% of patients in Denmark had metastatic disease (TNM stage IV) compared with less than 66% elsewhere. For SEER ‘distant’, the proportion ranged from 61.3% in Australia to around 82% in Denmark and the UK (table 2).
Imputing TNM or SEER stage where it was missing did not consistently shift stage distribution towards a more or less advanced stage. The increase in the proportion of TNM stage IV was 0.2–2.6% for patients with NSCLC (table 2) and −1.1% to +0.3% for those with SCLC.
Survival from non-small cell lung cancer
Overall age-standardised 1-year net survival from NSCLC ranged from 30% in the UK to 46% in Sweden (table 3). Survival was also high (42%) in Australia and Canada and intermediate (34–39%) in Denmark and Norway. Overall estimates differ slightly between the TNM and SEER analyses because patients in England were only included in the TNM analyses (40% of all TNM-staged patients) and Australian and Norwegian patients were only included in the SEER analyses (38% of all SEER patients). These exclusions affect the model results for the other countries.
One-year net survival (NS, %) overall, age-standardised and age-specific, by stage at diagnosis and country for patients with non-small cell lung cancer diagnosed during 2004–2007
One-year survival for patients with TNM stage I and II disease was significantly lower in the UK (stage I: 72.5%; stage II: 59.8%) and Denmark (stage I: 73.3%; stage II: 59.1%) than in Canada (stage I: 86.3%; stage II: 78.5%) and Sweden (stage I: 88.4%; stage II: 70.7%) (table 3). Survival was also lower in the UK for stage III (35.3% vs 42.8–46.4% elsewhere) and stage IV (15.9% vs 20.8–25.6% in Denmark and Sweden). The apparent survival advantage in Canada for early stage NSCLC was not evident at more advanced stage, and survival for stage IV disease was 16.8%, similar to that for patients in the UK.
For TNM stages I–II, the excess hazard in the UK and Denmark was higher than in Canada and Sweden at all time points up to 18 months, but the differences were widest soon after diagnosis, narrowing over the first year (figure 1). The excess hazard for stages III–IV NSCLC was consistently high in the UK.
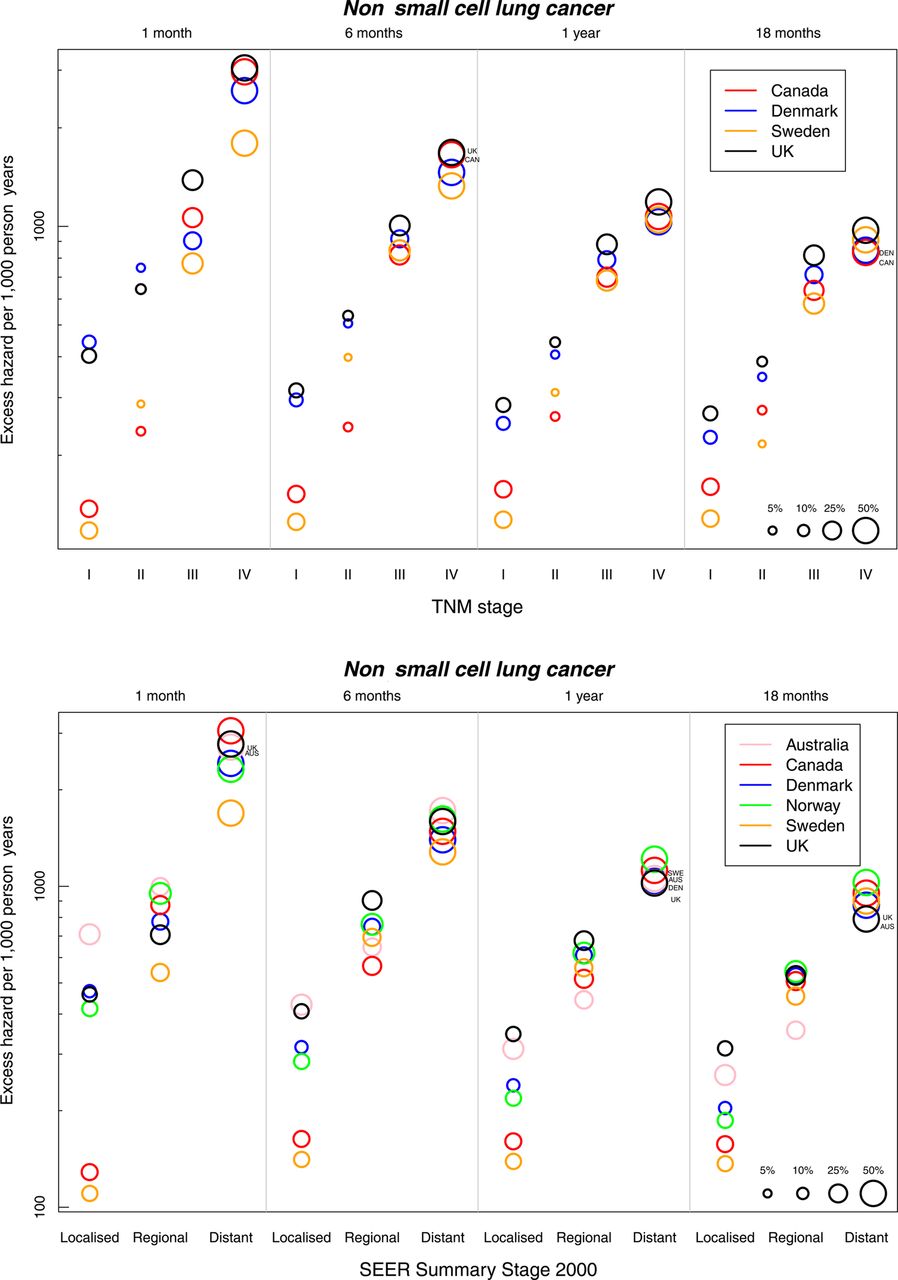
Age-standardised excess hazard (per 1000 person-years, log scale) from non-small cell lung cancer by stage, country and time since diagnosis: TNM stage (upper panel) and SEER Summary Stage 2000 (lower panel). Notes: (1) National data are used for Denmark and Norway. Other countries are represented by regional registries (Australia: New South Wales; Canada: Alberta and Manitoba; Sweden: Uppsala-Örebro and Stockholm-Gotland health regions; the UK (TNM analysis): West Midlands Cancer Intelligence Unit, the Eastern Cancer Registration and Information Centre in England and Northern Ireland; the UK (SEER analysis): Northern Ireland). (2) Bubbles are scaled to represent stage distribution at diagnosis.
Patients with ‘localised’ NSCLC in Australia had low survival, but survival for more advanced disease was average (table 3, figure 2). The excess hazard for Australian patients with ‘regional’ NSCLC declined more steeply with time than in other countries (figure 1). Norwegian patients had average stage-specific survival (table 3).
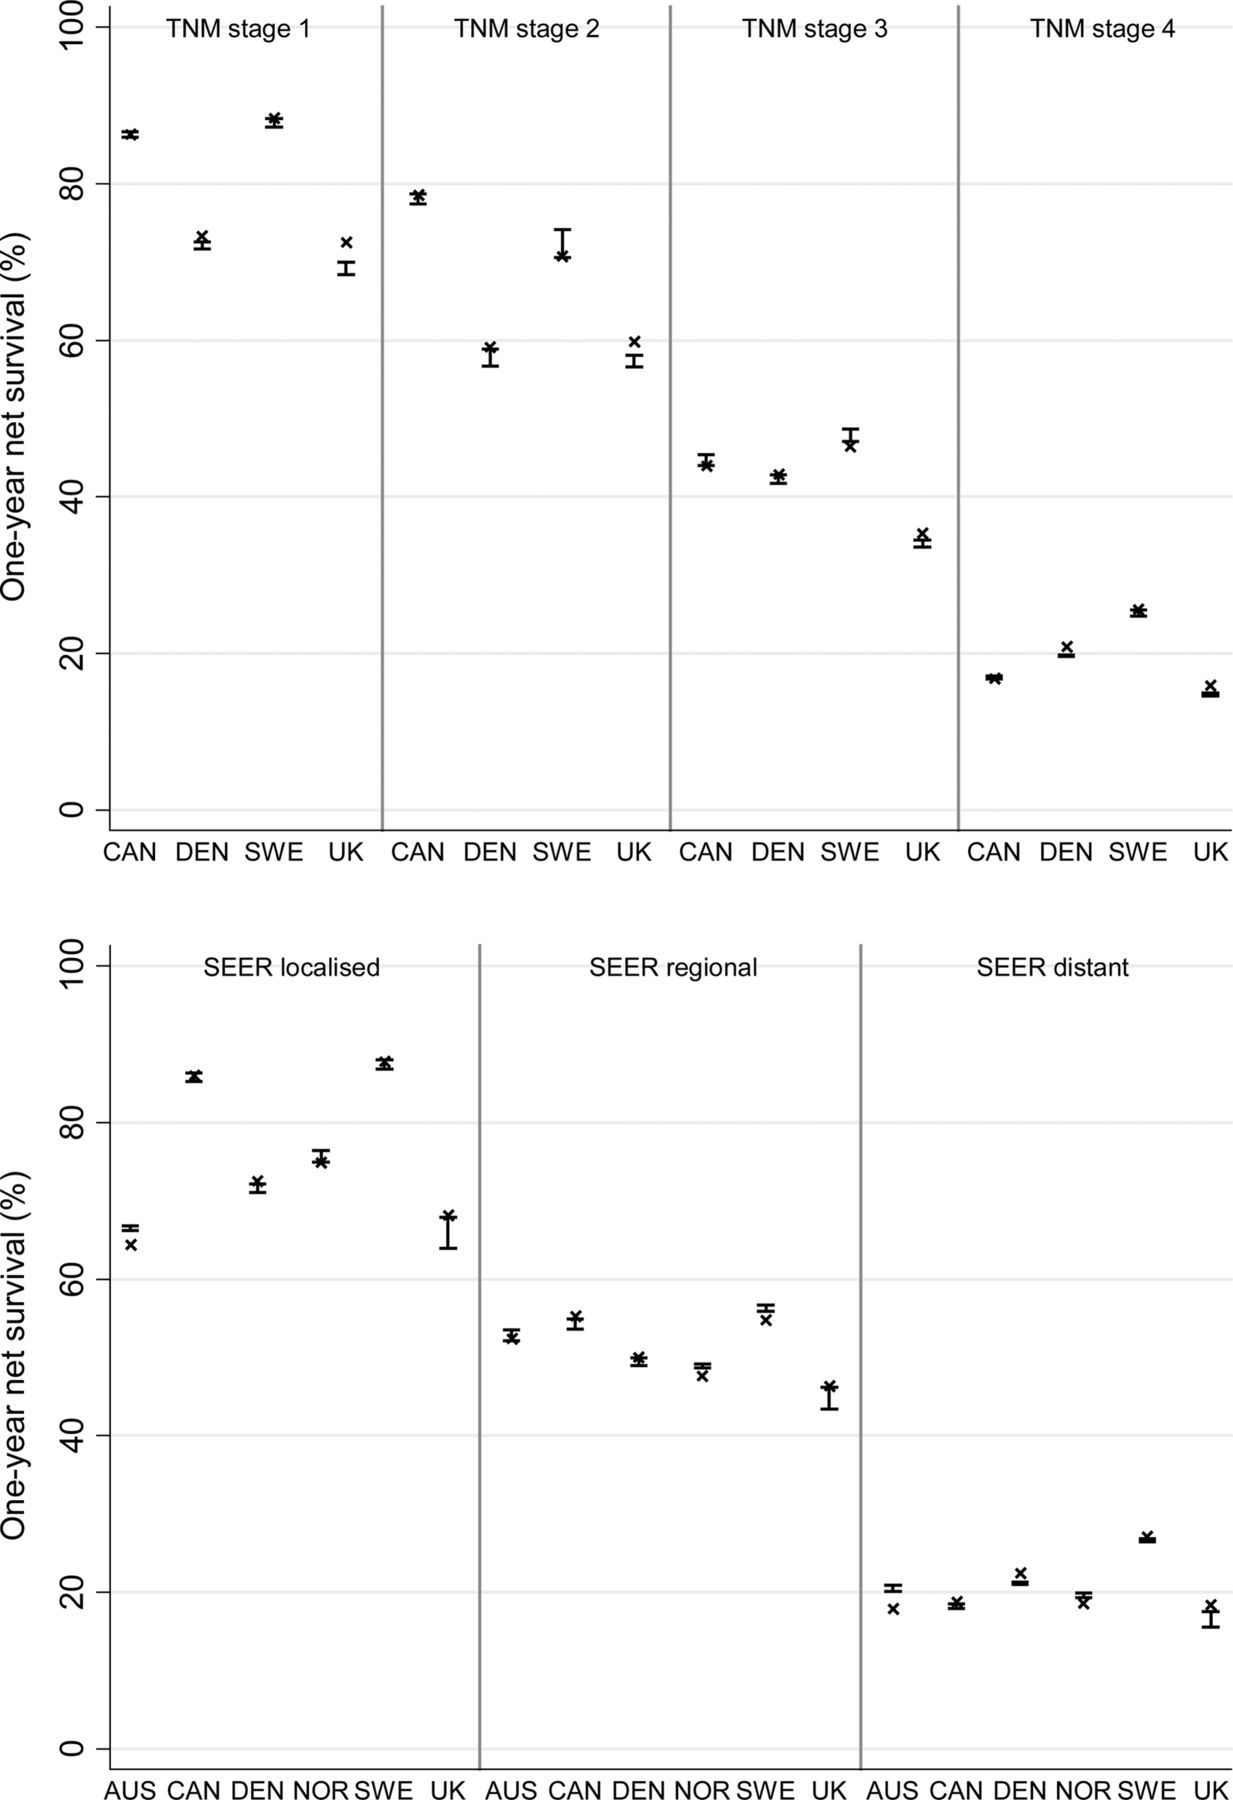
Age-standardised 1-year net survival from non-small cell lung cancer by stage at diagnosis and country using known stage and imputed stage: TNM stage (upper panel) and SEER Summary Stage 2000 (lower panel). Notes: Australia: New South Wales; Canada: Alberta and Manitoba; Sweden: Uppsala-Örebro and Stockholm-Gotland health regions; the UK (TNM analysis): West Midlands Cancer Intelligence Unit, the Eastern Cancer Registration and Information Centre in England and Northern Ireland; the UK (SEER analysis): Northern Ireland.
The inclusion of patients with imputed stage made no material difference to the survival patterns (figure 2).
Survival from small cell lung cancer
One-year age-standardised net survival from SCLC ranged from 24.9% in the UK to 36.6% in Sweden (TNM analyses), and from 23.1% in the UK to 38.7% in Sweden in the SEER analysis (table 4). The estimates differ because patients in England (38% of all patients) were only included in analyses by TNM stage, while Australian and Norwegian patients (38% of all patients) were only included in analyses by SEER stage.
One-year net survival (NS, %) overall, age-standardised and age-specific, by stage at diagnosis and country for patients with small cell lung cancer diagnosed during 2004–2007
Among patients with early stage SCLC (TNM stages I and II), survival was lower in the UK (55.9%) and Denmark (64.5%) than in Canada (71.1%) and Sweden (71.7%) (table 4). The UK had lower survival among patients with stage III (37.3% vs 47.9–52.2%) and stage IV disease (14.4% vs 17.9–27.6%). The excess hazard of death for UK patients with stage III SCLC was very high immediately after diagnosis but became average by 18 months (figure 3). Among patients with stage IV disease, the excess hazard in the UK and in Canada was high throughout the first 18 months.

Age-standardised excess hazard (per 1000 person-years, log scale) from small cell lung cancer by stage, country and time since diagnosis: TNM stage (upper panel) and SEER Summary Stage 2000 (lower panel). Notes: (1) National data are used for Denmark and Norway. Other countries are represented by regional registries (Australia: New South Wales; Canada: Alberta and Manitoba; Sweden: Uppsala-Örebro and Stockholm-Gotland health regions; the UK (TNM analysis): West Midlands Cancer Intelligence Unit, the Eastern Cancer Registration and Information Centre in England and Northern Ireland; the UK (SEER analysis): Northern Ireland). (2) Bubbles are scaled to represent stage distribution at diagnosis.
Norway had average survival for patients diagnosed at each SEER stage, and the excess hazard was generally average throughout follow-up (figure 3). Patients in Australia had quite low stage-specific survival from SCLC (table 4). The range in the excess hazard between SEER stages was narrower in Australia than in other countries throughout follow-up (figure 3).
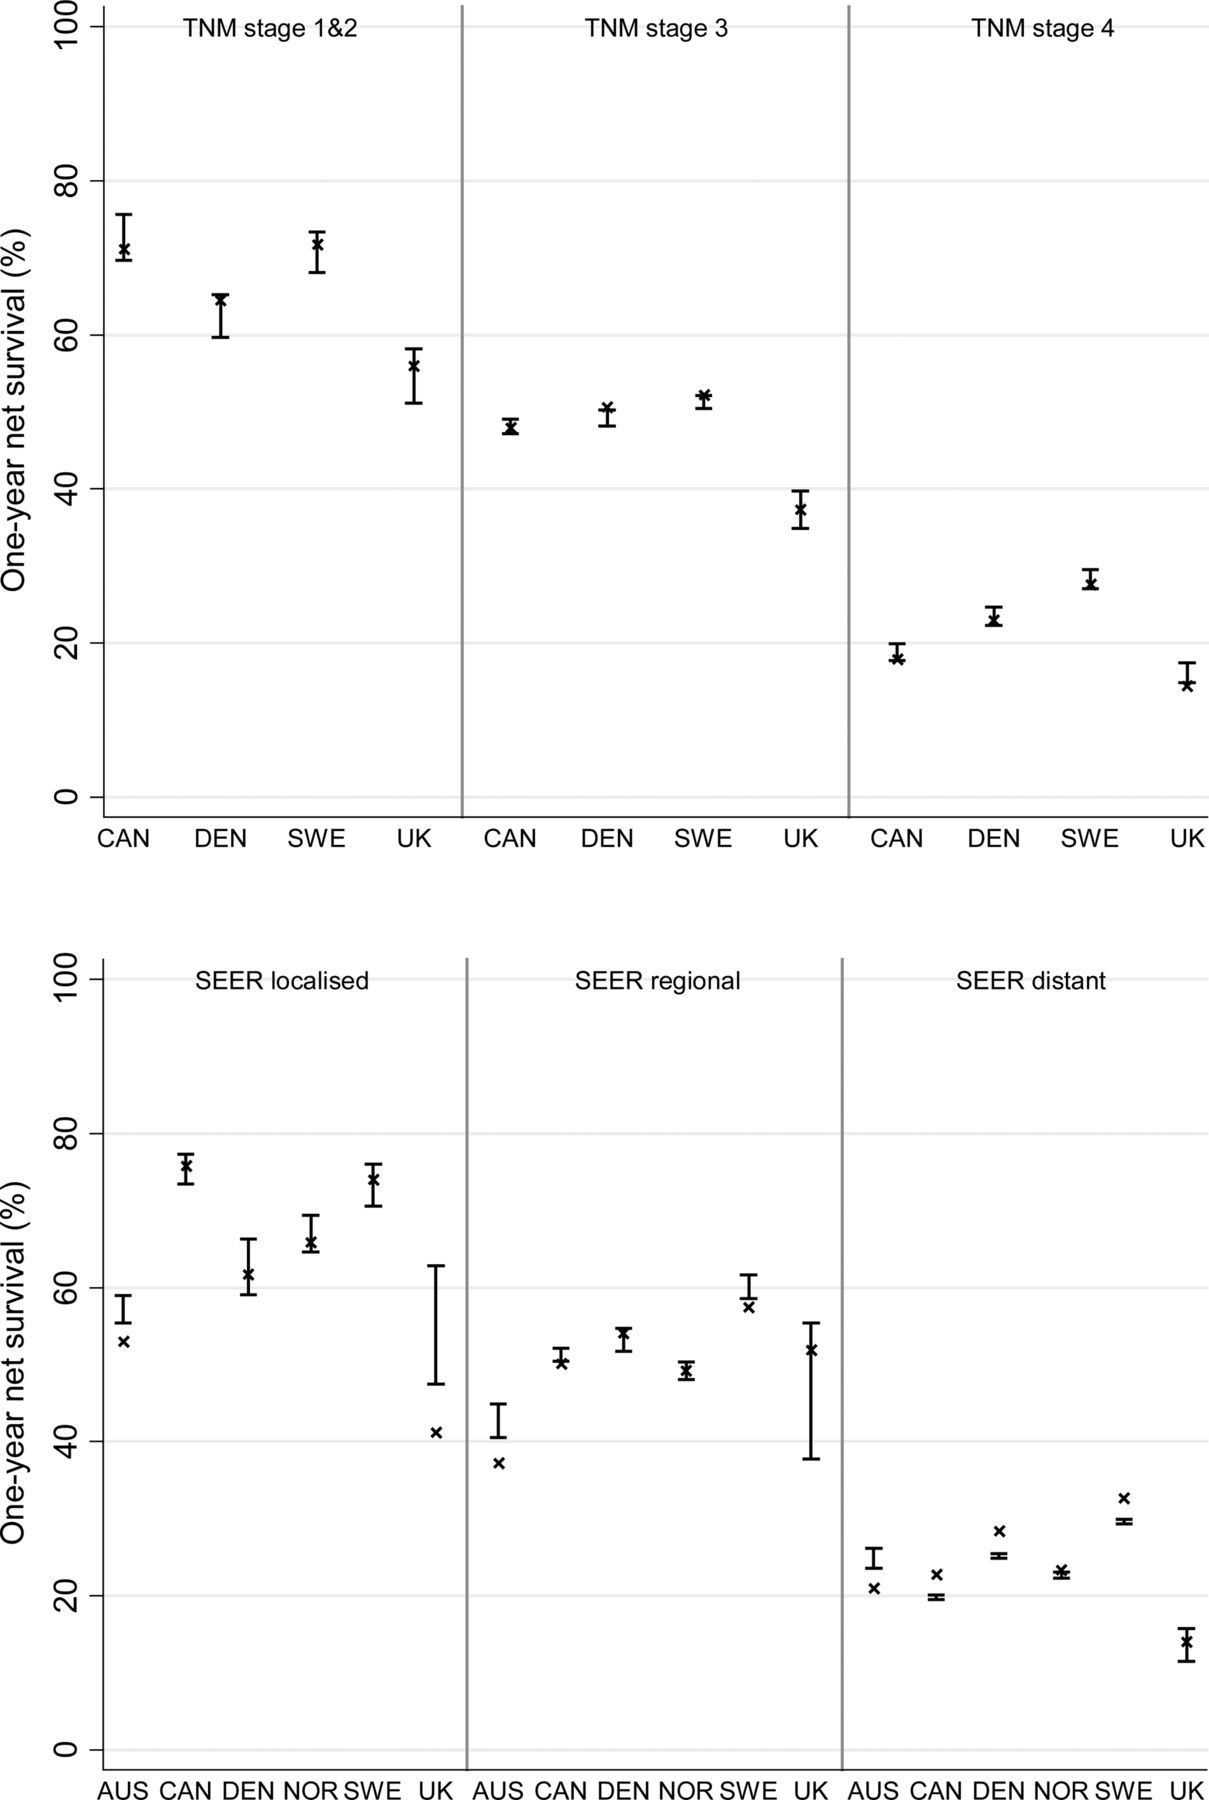
Survival estimates including patients with imputed stage were generally close to those for patients with known stage. The main exception was for the UK (Northern Ireland only) in the SEER analyses, where the number of patients was small (figure 4).
Age-standardised 1-year net survival from small cell lung cancer by stage at diagnosis and country using known stage and imputed stage: TNM stage (upper panel) and SEER Summary Stage 2000 (lower panel). Notes: Australia: New South Wales; Canada: Alberta and Manitoba; Sweden: Uppsala-Örebro and Stockholm-Gotland health regions; the UK (TNM analysis): West Midlands Cancer Intelligence Unit, the Eastern Cancer Registration and Information Centre in England and Northern Ireland; the UK (SEER analysis): Northern Ireland.
Discussion
Lung cancer survival varied widely between these six wealthy countries in 2004–2007. Age-standardised 1-year net survival for NSCLC ranged from 30% in the UK to 46% in Sweden. Survival was relatively low in Denmark, intermediate in Norway and high in Australia and Canada. For SCLC, 1-year survival was 12–16% lower in the UK than in Sweden and Australia and intermediate elsewhere.
These survival differences are partly explained by differences in stage at diagnosis. Denmark in particular had a more adverse stage distribution. However, international differences in survival were also evident within each stage of disease for both types of lung cancer: generally low in the UK and high in Sweden. Denmark had low survival for patients with early stage disease but average survival for those with more advanced disease while, in Canada, the comparatively high survival for early disease was not apparent for patients with more advanced disease. International differences in stage at diagnosis may arise because of differences in disease aetiology (which may affect the aggressiveness of disease), or delays in diagnosis or in the staging procedures themselves. Stage-specific survival may also vary because of differences in the quality of and access to stage-specific treatment.
Population-based survival estimates are invaluable for public health surveillance because they include all patients—young and old, rich and poor, with early or late disease and with or without comorbidity—not just the small percentage of younger, fitter patients typically recruited to clinical trials. This study was based on 57 352 unselected patients with lung cancer from population-based registries.
However, using such data requires extensive quality control16 to ensure comparability of stage data. We consider our consolidation of raw data from different staging classifications to have been largely successful; the stage distributions by age, survival and morphology are clinically coherent as well as internally consistent and comparable with previous estimates,20–22 but some potential for misclassification remains. For example, small differences between the New South Wales coding scheme and SEER could explain why New South Wales has an apparently higher proportion of localised disease than elsewhere (eg, the distance of main stem bronchial tumours from the carina is not considered in the New South Wales system whereas it is in SEER). This down-staging in New South Wales produces lower stage-specific survival because their localised disease category includes some patients who would be classified as having a more advanced stage within SEER. We have detailed the potential misclassification when mapping T, N and M data to SEER and have made recommendations on the coding of stage at diagnosis for international surveillance of cancer control.16
Differences in the thoroughness of staging may also contribute to international variation in stage distributions and stage-specific survival. The proportion of histologically-verified tumours varied widely, from 74.0% in the UK to 94.8% in Sweden. The high proportion in Sweden was consistent with published estimates,23 and lower levels of histological verification in the UK are also well known, with mounting evidence that elderly patients are much less likely to undergo these invasive procedures in the UK due to concerns about their frailty.24
Low stage-specific survival in the UK could conceivably arise in part because of suboptimal staging, and this misclassification of stage in a proportion of patients could lead to inappropriate treatment and therefore overall lower survival. In order to understand the impact of different staging procedures on international differences in survival, cancer registries will need to capture information on the staging procedures used for each patient—for example, whether sensitive investigations such as positron emission tomography (PET)-CT were used—enabling patients with very low volume metastatic NSCLC to be correctly identified as having advanced disease, or whether liver function tests were used to identify advanced stage SCLC. At the very least, registries should record whether the recorded stage was defined clinically (based on physical examination, imaging or endoscopy) or following histological examination.
Stage data were missing for 2–43% of patients, despite restriction to those registries where at least 50% of patients were staged. Patients with missing data on stage tended to be older and to have poorer survival than staged patients. To reduce bias, we imputed stage where it was missing, using the available covariables.19
We used standard approaches to deal with other potential biases that face all international comparisons of cancer survival using population-based data, such as age standardisation to control for differences in the age distribution.25 Nonetheless, some compositional differences remained: men made up over 59% of the patients in Australia, Norway and the UK compared with less than 54% elsewhere, and men generally have lower lung cancer survival than women.26 The histological subtypes of lung cancer also varied. Non-microscopically verified cancers were grouped with NSCLC, but those could have included some patients with SCLC or misdiagnosed cancer. Any effect would have been small, but probably more important in the UK which had the lowest proportion of patients with histological confirmation (74.0%). The UK also had the lowest proportion of adenocarcinomas, which have a better prognosis, and this was true even after imputing morphology where it was missing (results not shown).
In general, the completeness of all these registries is high, but small differences in information capture could also contribute to differences in survival. In Sweden, cancer registrations are not initiated from death certificates as they are elsewhere, which may mean some patients with very poor survival are missed. The effect on overall survival will be minimal given the very high completeness of the Swedish data.27
Despite these issues of data quality and comparability, there remains evidence of large international differences in lung cancer survival. For NSCLC, the low survival in Denmark is driven partly by more advanced stage at diagnosis. In the UK, the proportion of patients diagnosed at an early stage is also lower than elsewhere. A more advanced stage distribution may arise because of faster disease progression (possibly related to a higher incidence of smoking28) or because of delays in diagnosis. Research has pointed to diagnostic delay in Denmark,13 ,29 and policies are now in place in Denmark and the UK to shorten the time to diagnosis.29 ,30
However, survival from NSCLC in the UK was also comparatively low for each stage of disease. Compared with Sweden, 1-year survival in the UK was statistically significantly 10–16% lower within each TNM stage I–IV and 9–19% lower than in Canada for stages I–III (survival for stage IV was low in Canada). Danish patients had low stage-specific survival for TNM stages I–II.
Patients in the UK also had lower overall survival from SCLC despite the relatively favourable stage distribution, because stage-specific survival at each stage was generally lower than elsewhere.
Low stage-specific survival may indicate poorer levels of stage-specific treatment. Previous studies have shown that surgery for lung cancer is less frequently performed in the UK31 ,32 than elsewhere in Europe33 ,34 or Canada.20 ,35 Similarly, lower provision of chemotherapy and radiotherapy has been reported in the UK32 than in Australia,36 Canada20 and Sweden.34 These studies are not directly comparable because they use different methods, data and calendar periods. The overall pattern is nevertheless suggestive of the need for wider access to optimal treatment.
We are currently examining how far differences in treatment between the six ICBP countries may explain the variation in survival. Other explanations that may be considered include factors such as obesity, smoking, performance status and comorbidity. It would be desirable to have data on these factors, which may be more common in the countries with lower overall survival,33 but such factors would have to be both highly prevalent and powerfully prognostic to explain the survival differences between countries reported here. Clinical choices may also be more conservative in some countries than others in the face of comorbidities, older age and lower performance status.
This study demonstrates wide differences between six wealthy countries in short-term survival from lung cancer, the most common cause of cancer death worldwide. These differences seem unlikely to be explained by artefacts of method or unrecorded confounders, and differences in stage at diagnosis and stage-specific treatment are likely to be important explanations.
The study also shows the importance of including stage at diagnosis in international survival comparisons. It is essential that the quality, completeness and comparability of stage data are improved, both in clinical settings and in population-based cancer registries, in order to facilitate surveillance of international trends in survival. Such comparisons incentivise policy development and act as benchmarks for setting national cancer plans.
Acknowledgments
We thank the cancer registry staff in all jurisdictions, whose sustained efforts in data collection and quality control over many years have enabled lung cancer survival to be compared by stage at diagnosis. The authors would like to thank Martine Bomb, Catherine Foot and Donia Sadik at Cancer Research UK for their logistical support.
References
Supplementary materials
Supplementary Data
This web only file has been produced by the BMJ Publishing Group from an electronic file supplied by the author(s) and has not been edited for content.
Files in this Data Supplement:
- Data supplement 1 - Online appendix 1
- Data supplement 2 - Online appendix 2
Footnotes
-
Collaborators ICBP Module 1 Working Group: Programme Board—Søren Brostrøm (Danish National Board of Health, Hospital Services and Emergency Management, Copenhagen, Denmark); Heather Bryant (Canadian Partnership Against Cancer, Toronto, Ontario, Canada); David Currow (Cancer Institute New South Wales, Sydney, New South Wales, Australia); Anna Gavin (Northern Ireland Cancer Registry, Belfast, UK); Gunilla Gunnarsson (Swedish Association of Local Authorities and Regions, Stockholm, Sweden); Jane Hanson (Welsh Cancer National Specialist Advisory Group, Cardiff, UK); Todd Harper (Cancer Council Victoria, Carlton, Victoria, Australia); Stein Kaasa (University Hospital of Trondheim, Trondheim, Norway); Michael A Richards (National Cancer Action Team, Department of Health, London, UK); Michael Sherar (Cancer Care Ontario, Toronto, Ontario, Canada); Bob Thomas (Department of Health Victoria, Melbourne, Victoria, Australia). Module 1 Collaborators and Cancer Registries—Jan Adolfsson (Regional Cancer Centre, Stockholm County Council and the CLINTEC Department, Karolinska Institutet, Stockholm, Sweden); Ole Andersen (National Board of Health, Health Planning Division, Copenhagen, Denmark); Heather Bryant (Canadian Partnership Against Cancer, Toronto, Ontario, Canada); Andy Coldman (Cancer Surveillance and Outcomes, British Columbia Cancer Agency, Vancouver, British Columbia, Canada); Dhali Dhaliwal (CancerCare Manitoba, Winnipeg, Manitoba, Canada); Gerda Engholm (Department of Cancer Prevention and Documentation, Danish Cancer Society, Copenhagen, Denmark); Anna Gavin (Northern Ireland Cancer Registry, Belfast, UK); David Forman (Section of Cancer Information, International Agency for Research on Cancer, Lyon, France); Marianne L Gjerstorff (Danish Cancer Registry, Statens Serum Institut—National Institute for Health Data and Disease Control, Copenhagen, Denmark); Juanita Hatcher (Alberta Health Services, Edmonton, Alberta, Canada); Charlotte Hosbond (National Board of Health, Copenhagen, Denmark); Tom B Johannesen (Norwegian Cancer Registry, Oslo, Norway); Mats Lambe (Regional Oncological Centre, Uppsala University Hospital, Uppsala, Sweden and the Karolinska Institutet, Stockholm, Sweden); Karen M Linklater (Thames Cancer Registry, London, UK); Loraine Marrett (Cancer Care Ontario, Toronto, Ontario, Canada); Colleen E McGahan (Cancer Surveillance and Outcomes, British Columbia Cancer Agency, Vancouver, British Columbia, Canada); John McLaughlin (Cancer Care Ontario, Toronto, Ontario, Canada); David Meechan (Trent Cancer Registry, Sheffield, UK); Richard Middleton (Northern Ireland Cancer Registry, Belfast, UK); Kamini Milnes (Cancer Care Ontario, Toronto, Ontario, Canada); Diane Nishri (Cancer Care Ontario, Toronto, Ontario, Canada); Nicola Quin (Cancer Council Victoria, Carlton, Victoria, Australia); Linda Rabenek (Cancer Care Ontario, Toronto, Ontario, Canada); Carol Russell (Alberta Health Services, Edmonton, Alberta, Canada); Janey Shin (Canadian Partnership Against Cancer, Toronto, Ontario, Canada); John Steward (Welsh Cancer Intelligence and Surveillance Unit, Cardiff, UK); Elizabeth Tracey (Cancer Institute New South Wales, Sydney, New South Wales, Australia); Donna Turner (CancerCare Manitoba, Winnipeg, Manitoba, Canada). Clinical Committee—Stefan Bergström (Department of Oncology, Central Hospital, Gävle, Sweden); Michael Boyer (Sydney Cancer Care Centre, Sydney, New South Wales, Australia); John Butler (Royal Marsden Hospital, London, UK); William Evans (Juravinski Cancer Centre at Hamilton Health Sciences, Cancer Care Ontario, Toronto ON, Canada); Louise Hanna (Velindre NHS Trust, Cardiff, UK); Erik Jakobsen (Odense University Hospital, Odense, Denmark); Karl Kölbeck (Karolinska University Hospital, Stockholm, Sweden); Jason Lester (Velindre NHS Trust, Cardiff, UK); Jonathan McAleese (Belfast City Hospital, Belfast, UK); Michael D Peake (NHS Cancer Improvement, National Cancer Intelligence Network, Department of Respiratory Medicine, Leicester, UK); Stein Sundstrøm (Department of Oncology, St Olavs Hospital, University Hospital of Trondheim, Trondheim Norway); Nicholas Young (School of Social and Community Medicine, University of Bristol, Bristol, UK); Ian Williamson (Royal Gwent Hospital, Newport, UK). Central Analytic Team—Sarah Walters, Camille Maringe, Michel P Coleman, Bernard Rachet (Cancer Research UK Cancer Survival Group, London School of Hygiene and Tropical Medicine, London, UK).
-
Contributors Programme Board (SB, HB, DC, AG, GG, JH, TH, SK, MAR, MS and BT) identified the questions and the countries to be studied, supervised the study and contributed to drafting the report. Module 1 collaborators (JA, OA, HB, DF, AG, CH, TBJ, ML, MLG, DM, RM, NQ, LR, JS, JSt and ET) contributed to study design and drafting the report. Cancer registry contributors (JA, HB, AC, DD, GE, AG, MLG, JH, TBJ, CL, ML, KML, LM, CEM, JMcL, DM, RM, KM, DN, CR, JSt, JS, ET and DT) collected, prepared and transmitted the raw data, advised on the protocol, corrected data after quality control and checked the results of the analyses. Clinical Committee (SB, MB, JB, WE, LH, EJ, KK, JL, JMcA, MDP, SS, NY and IW) advised on methodology, helped interpret the findings and contributed to drafting the report. Central Analytic Team (SW, CM, MPC and BR) drafted the protocol, obtained statutory and ethics approvals, had access to all the raw data, did the data preparation, quality control and analyses and drafted the report. All authors had access to the results of all steps of data preparation, quality control and analyses and contributed to the final report.
-
Funding This work was supported by the Department of Health, England. Cancer Research UK supports the Cancer Survival Group (C1336/A11700). The Northern Ireland Cancer Registry is funded by the Northern Ireland Public Health Agency.
-
Competing interests MAR is the National Cancer Director (England, funded by the Department of Health). Other authors declare that they have no conflicts of interest.
-
Provenance and peer review Not commissioned; externally peer reviewed.